I& #39;ve updated my dynamic monthly market charts on my site (hover over to see any values). I& #39;ll share a couple of screenshots of interesting ones in this thread, then link to all.
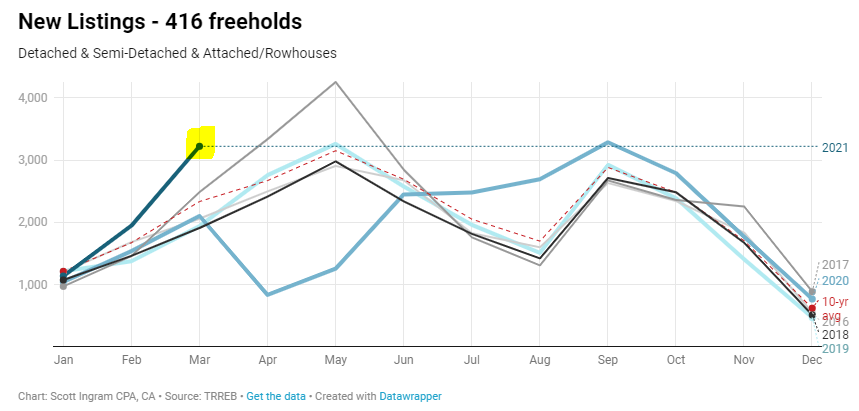
Firstly, new listings are at really high levels. /1
Firstly, new listings are at really high levels. /1
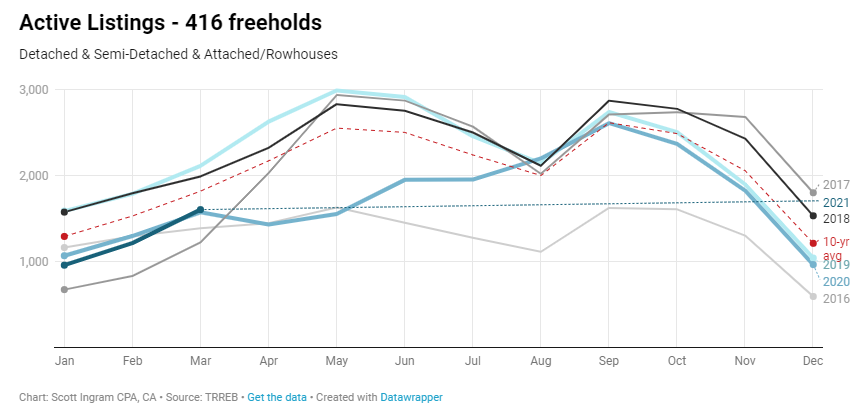
But they& #39;re getting soaked up quickly as you can see active listings are below the 10-year avg. /2
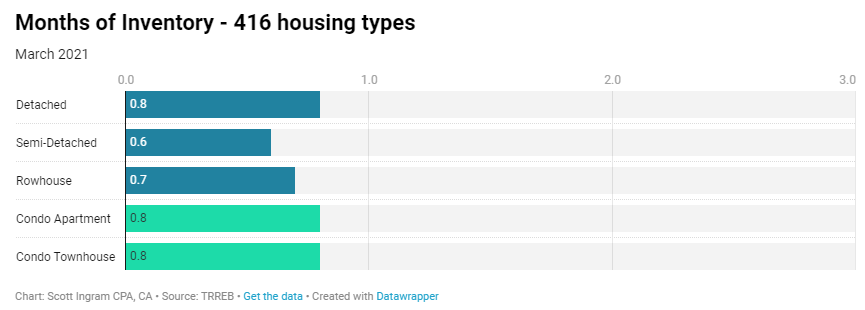
Those were Freehold charts but Condos are same story (can see on my site). Sales are going bananas now too, so with high sales and low active inventory, months of inventory is low across all housing types (meaning deep seller& #39;s market). /3
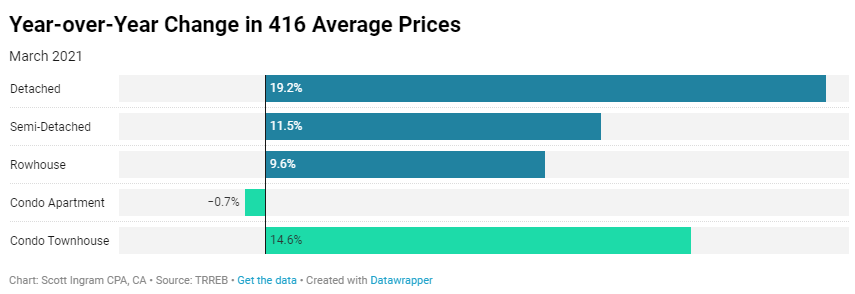
We& #39;re not seeing the big pricing pressure on Condo Apts like on the others - but note that -0.7% this month was -6.4% just last month, so it indeed is rising rapidly - just can& #39;t see in the popular (but arbitrary) 12 month comparison period. /4
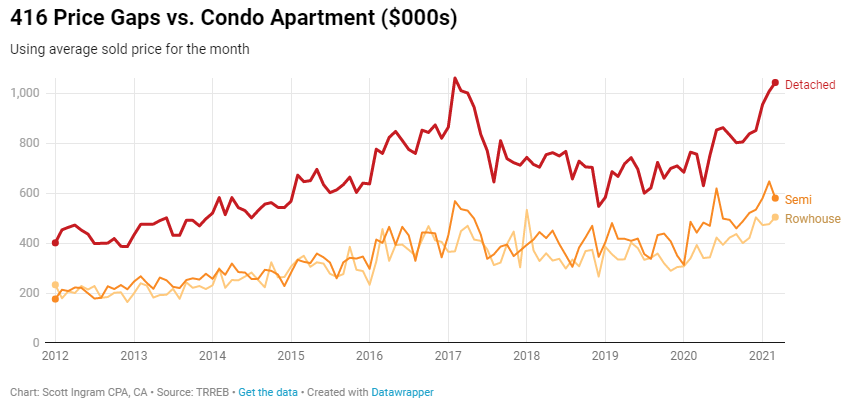
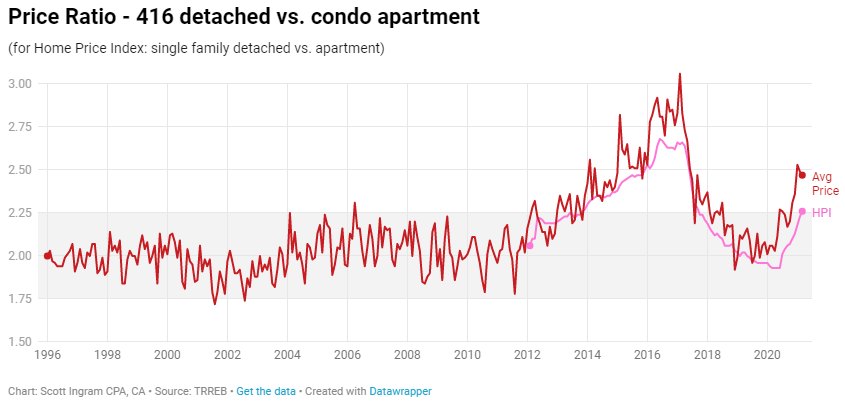
Price gap of detached vs. condo apt ($1043K) is just off its all-time high ($1061K). I also have a chart comparing the ratio, which is important because that number stays within a certain range historically and it& #39;s high now... suggesting detached prices will come down ... /5
and/or condo apt prices will rise (as more people pour into that space that are priced out of lowrise). /6
You& #39;ll always be able to see the latest versions of these (with all the numbers) here on the Monthly Market Charts page of my website.  https://abs.twimg.com/emoji/v2/... draggable="false" alt="📈" title="Tabelle mit Aufwärtstrend" aria-label="Emoji: Tabelle mit Aufwärtstrend">
 https://abs.twimg.com/emoji/v2/... draggable="false" alt="📉" title="Tabelle mit Abwärtstrend" aria-label="Emoji: Tabelle mit Abwärtstrend">/7 https://areacode416homes.com/monthly-market-charts">https://areacode416homes.com/monthly-m...

 Read on Twitter