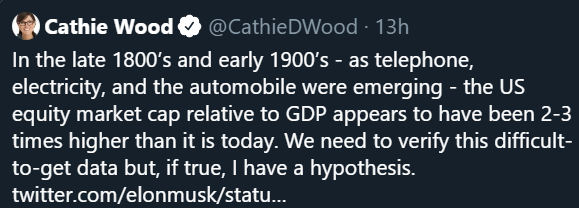
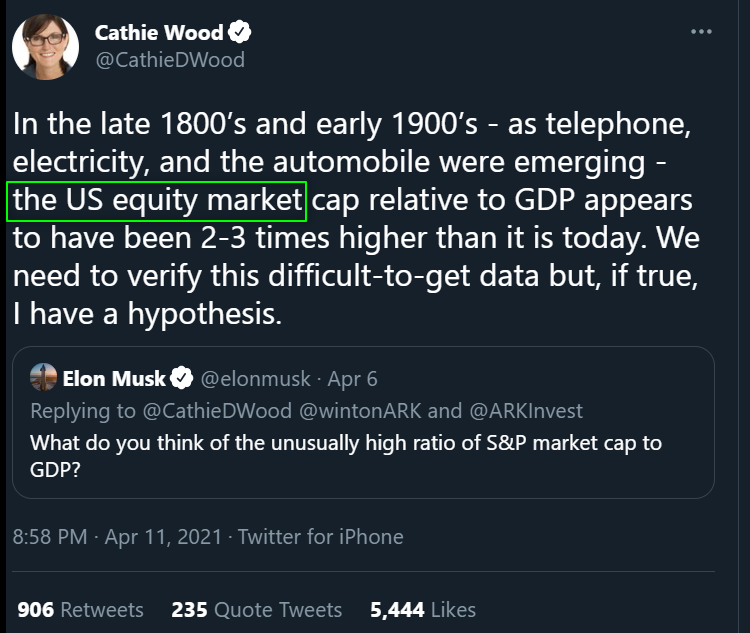
Many people might have seen this tweet yesterday.
I am sure a lot of people spent time to digest it & debunk it as it is obviously a very wrong statement.
Spoiler, it& #39;s 5-10 times bigger now than then.
Here is a THREAD. https://twitter.com/CathieDWood/status/1381230136918433792">https://twitter.com/CathieDWo...
I am sure a lot of people spent time to digest it & debunk it as it is obviously a very wrong statement.
Spoiler, it& #39;s 5-10 times bigger now than then.
Here is a THREAD. https://twitter.com/CathieDWood/status/1381230136918433792">https://twitter.com/CathieDWo...
1/ What is she looking at?
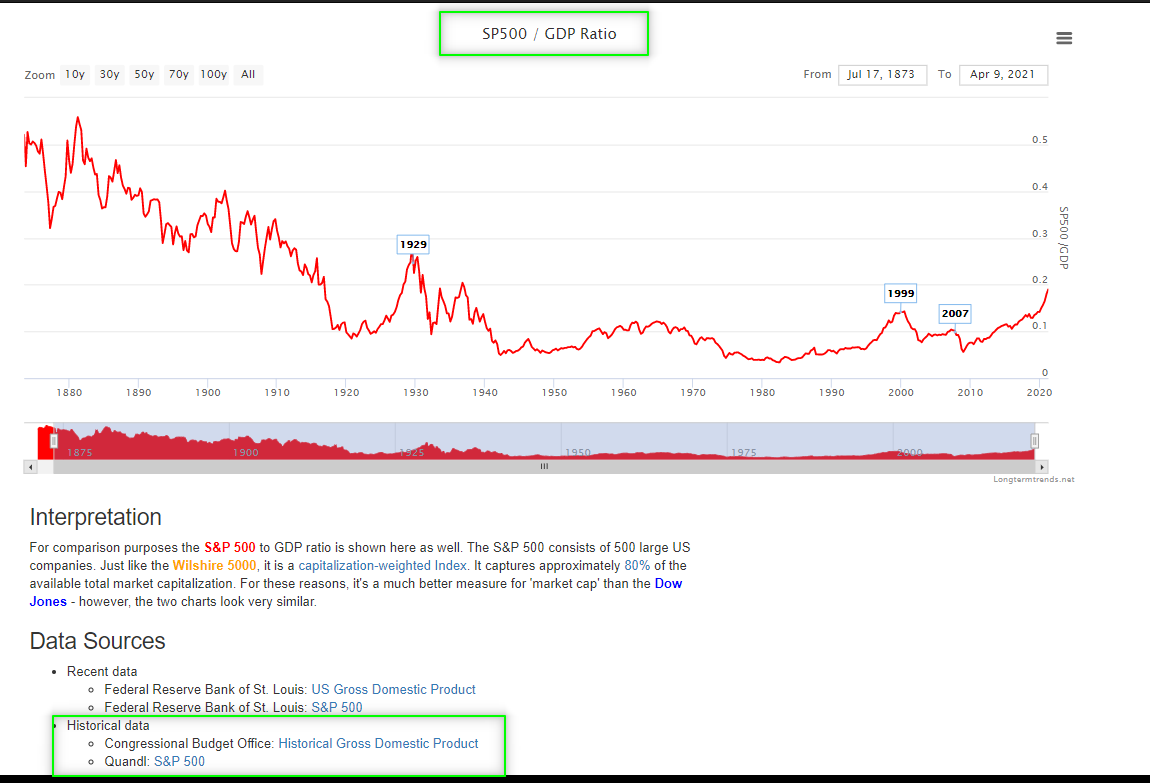
She is looking at the S&P in price divided by the US GDP in Billions.
So today: 4,100/21,000 Bn = 0.2
She is looking at the S&P in price divided by the US GDP in Billions.
So today: 4,100/21,000 Bn = 0.2
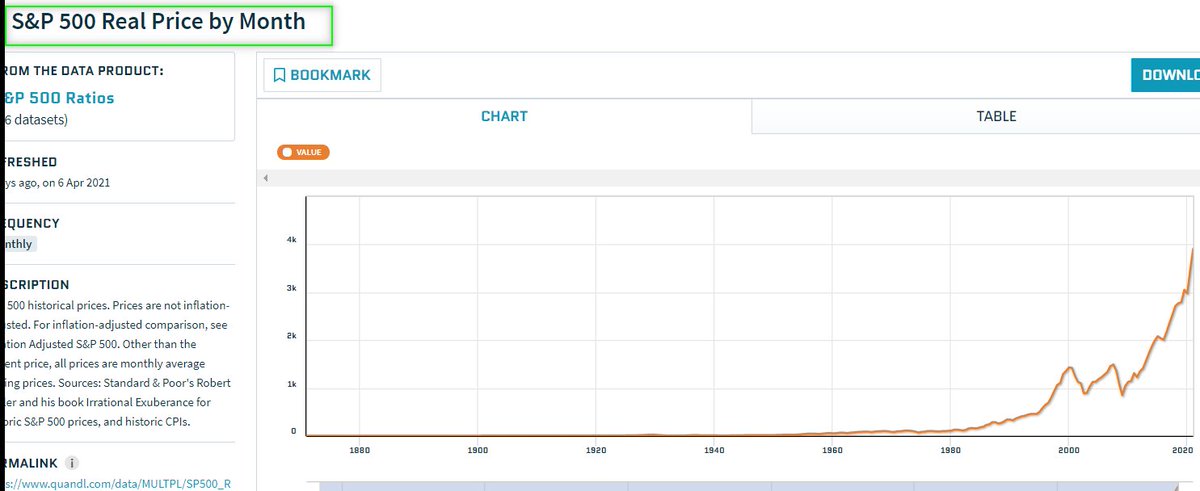
2/ Here are the details of the 2 different sources.
I hope I don& #39;t need to explain why this is an ultimate #chartcrime that can easily compete with @Schuldensuehner.
I invite @TheStalwart to include that on his list of "to debunk".
I hope I don& #39;t need to explain why this is an ultimate #chartcrime that can easily compete with @Schuldensuehner.
I invite @TheStalwart to include that on his list of "to debunk".
3/ In addition to making little sense, her Tweet is factually incorrect as she says "US equity market", which actually is the S&P in price.
She& #39;s stating her source though, site that I also use.
She& #39;s stating her source though, site that I also use.
4/ I was quite shocked to read this because it makes so little sense.
a. The economic structure of the previous century was obviously very different as it is now: You can assume the US most of economic output was coming from SMEs than mega caps.
a. The economic structure of the previous century was obviously very different as it is now: You can assume the US most of economic output was coming from SMEs than mega caps.
5/
The market cap of the 5 biggest firms in 1917 amounted of 8% of US GDP, today the 5 top cos represents 78%
This looks like it confirms my theory. OFC you would say world wasn& #39;t as globalized ... well we& #39;ll look at aggregates later.
Sources.:
Forbes
Companiesmarketcap
The market cap of the 5 biggest firms in 1917 amounted of 8% of US GDP, today the 5 top cos represents 78%
This looks like it confirms my theory. OFC you would say world wasn& #39;t as globalized ... well we& #39;ll look at aggregates later.
Sources.:
Forbes
Companiesmarketcap
6/
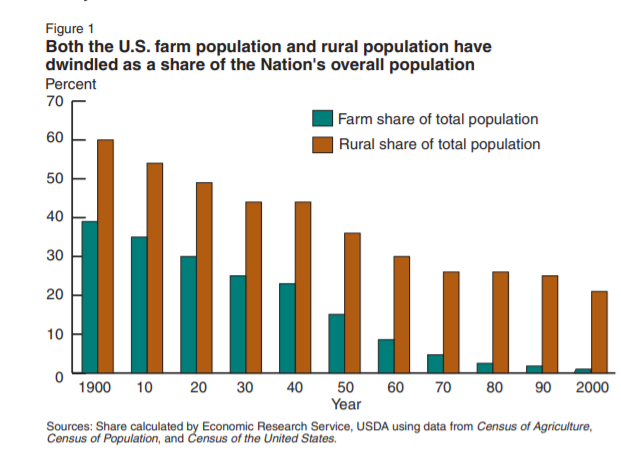
b. The demographic was very different. Most of the population was rural or factory workers and had little capital to invest in the stock market.
Source: USDA
b. The demographic was very different. Most of the population was rural or factory workers and had little capital to invest in the stock market.
Source: USDA
7/
c. The technology was very different & didn& #39;t enable masses to invest in stocks.
d. The plethora of derivatives & derivates of derivatives that exist today didn& #39;t which wouldn& #39;t allow for an exponential expansion of the stock market vs. the real economy
c. The technology was very different & didn& #39;t enable masses to invest in stocks.
d. The plethora of derivatives & derivates of derivatives that exist today didn& #39;t which wouldn& #39;t allow for an exponential expansion of the stock market vs. the real economy
8/ These are just a few examples but anyone with more than 5 functioning neurons can figure out that it was impossible that the equity market cap to GDP would be larger then than now.
9/
I would also like to highlight the demagogy of her statement.
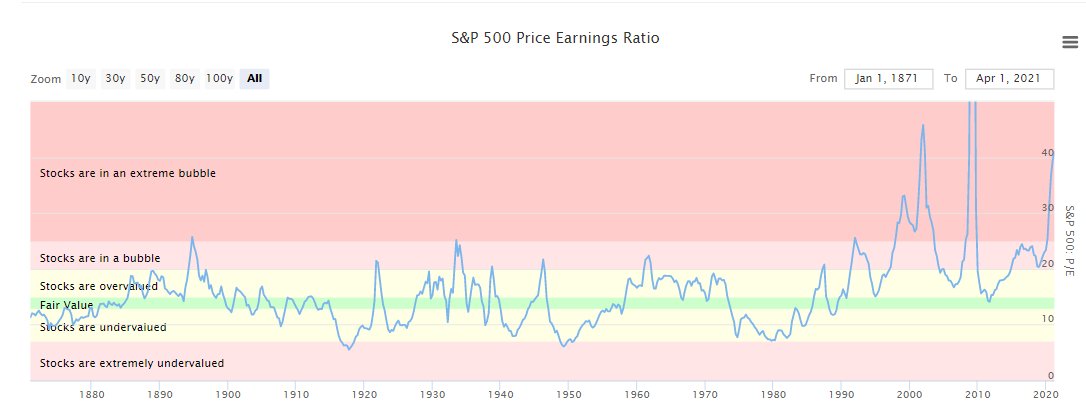
Anyone saying PE in 1900 was 8 so we are overvalued would look like a fool.
This works both ways.
I would also like to highlight the demagogy of her statement.
Anyone saying PE in 1900 was 8 so we are overvalued would look like a fool.
This works both ways.
10/
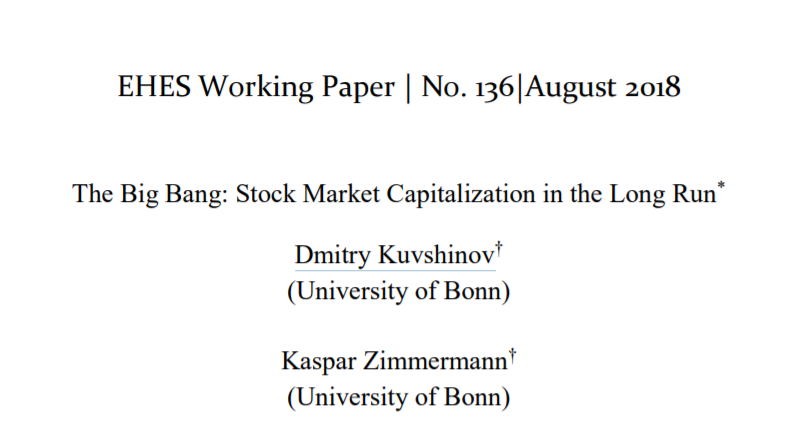
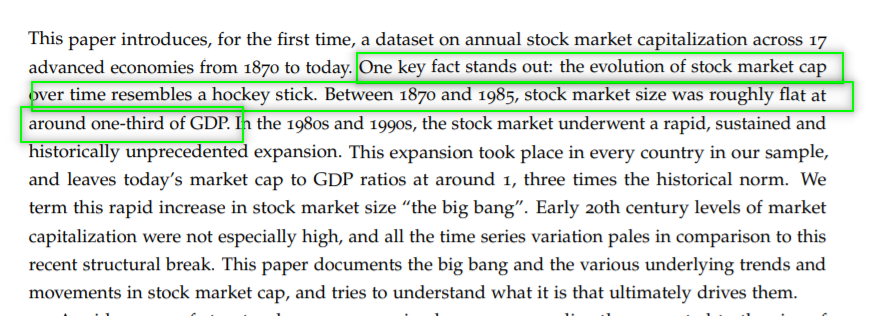
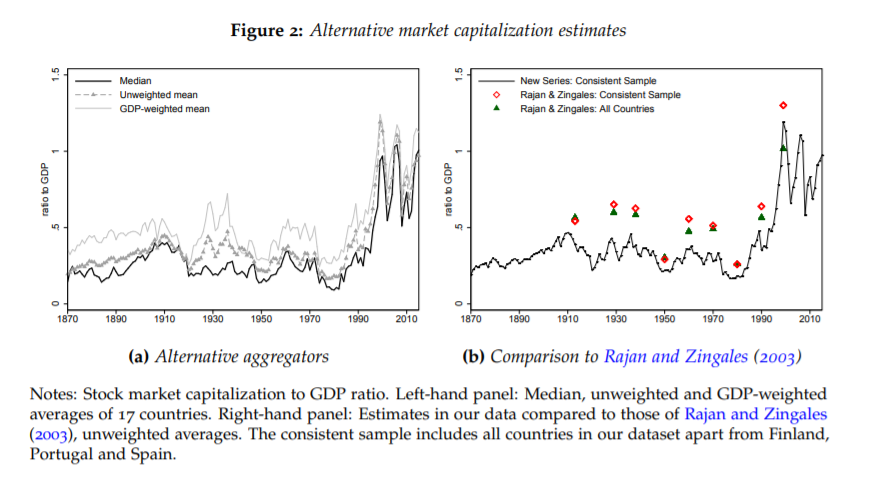
The next tweets will be based on a paper of the "European Historical Economics Society" & two researchers/ professors / PhD of the University of Bonn (DE)
The introduction is story telling.
The next tweets will be based on a paper of the "European Historical Economics Society" & two researchers/ professors / PhD of the University of Bonn (DE)
The introduction is story telling.
11/
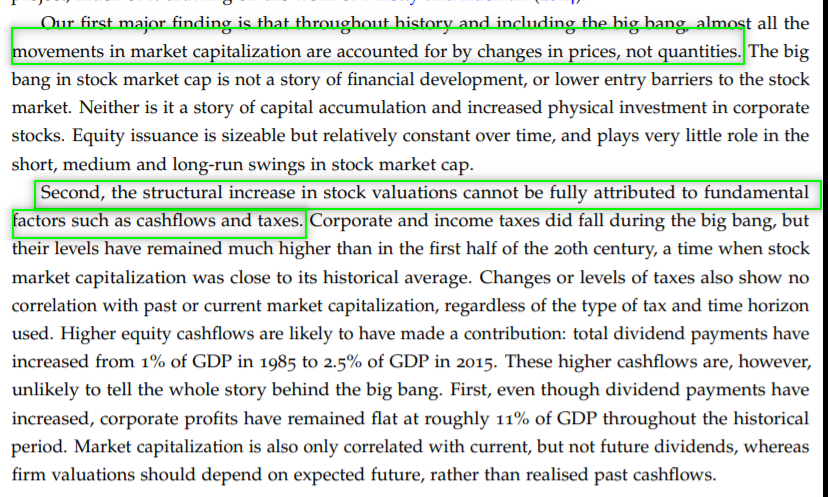
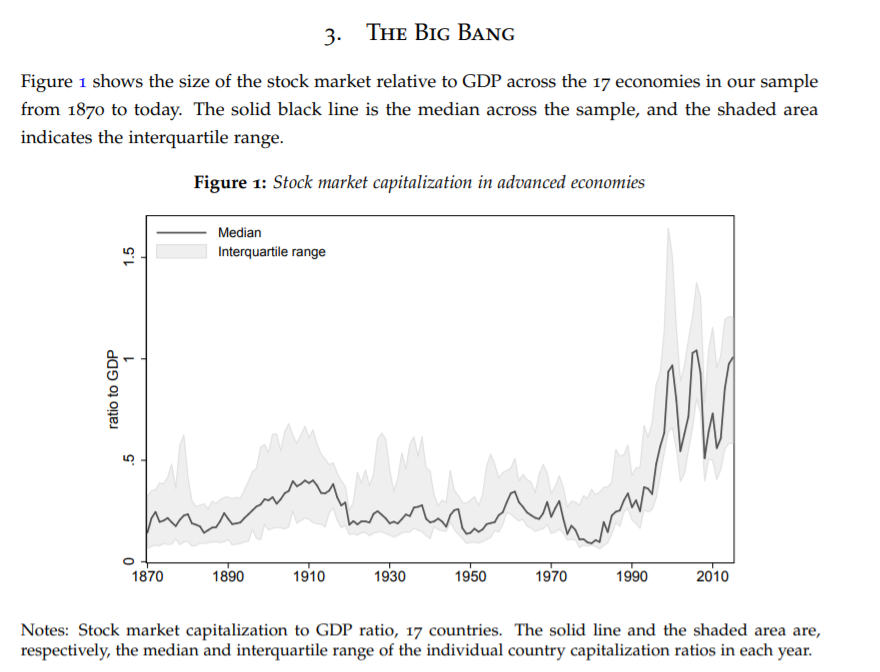
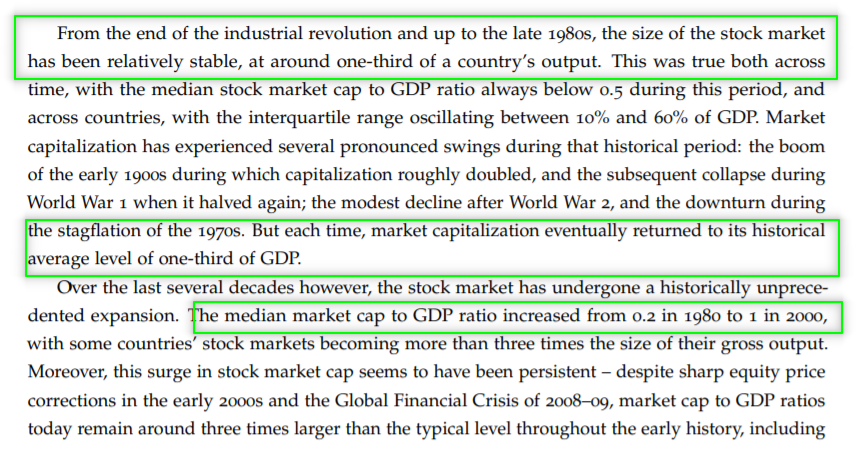
Some of their main findings are that
a. Increased of the market cap over time comes mainly from price, not from quantities
b. Fundamental factors cannot fully explain valuations
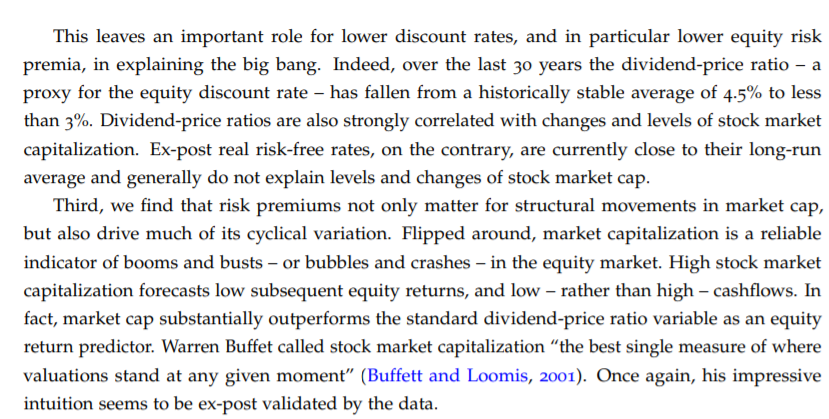
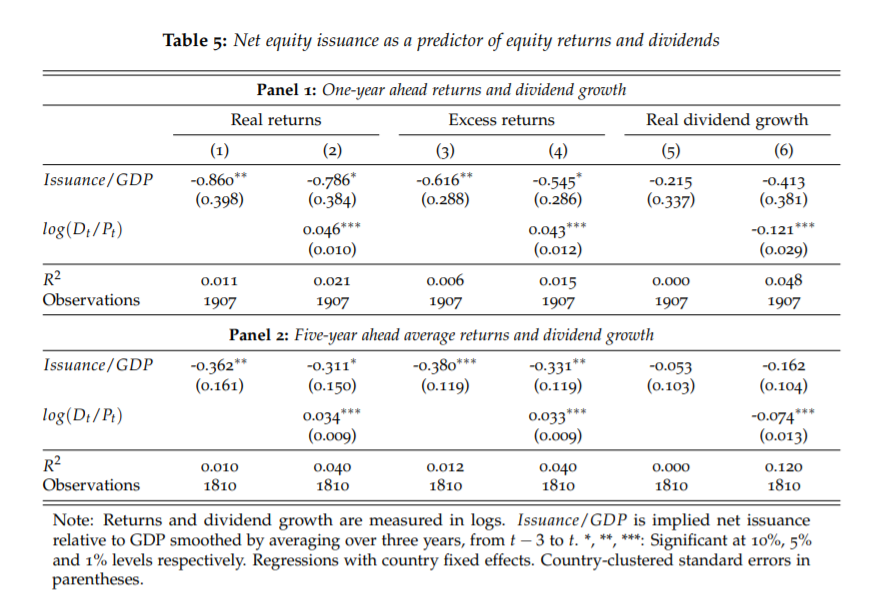
c. High valuation tend to be correlated with lower future returns but higher CF
Some of their main findings are that
a. Increased of the market cap over time comes mainly from price, not from quantities
b. Fundamental factors cannot fully explain valuations
c. High valuation tend to be correlated with lower future returns but higher CF
12/
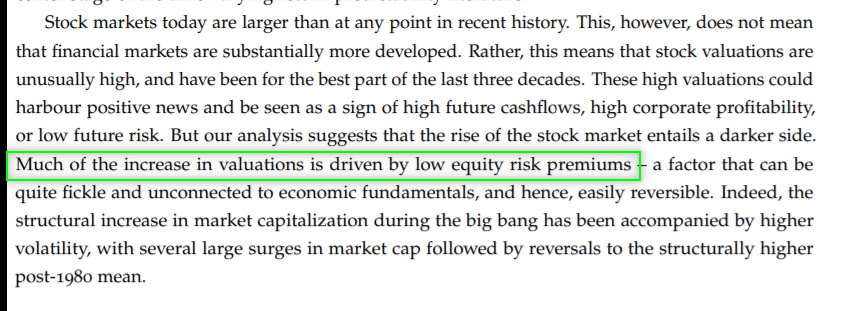
They find out that much of the over-valuation comes from lower risk premiums ( "the FED has your back") ... meaning people thinking co& #39;s can& #39;t default
They find out that much of the over-valuation comes from lower risk premiums ( "the FED has your back") ... meaning people thinking co& #39;s can& #39;t default
14/
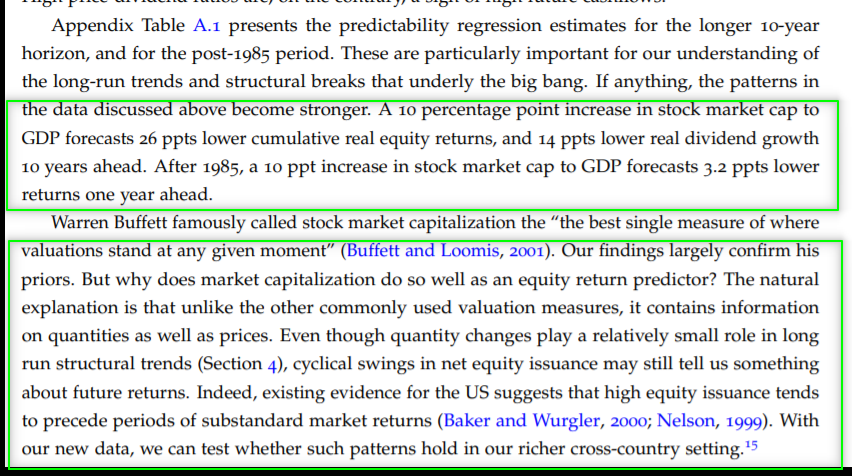
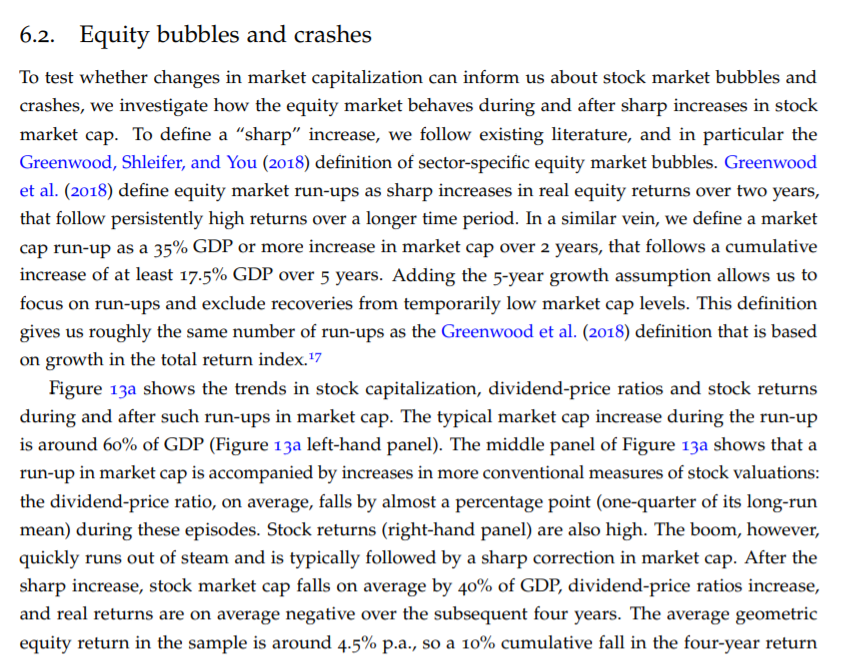
Finally they look at future returns.
The found that "High stock market capitalization forecasts low equity returns, and hence is a measure of low discount rates" & "high stock market capitalization is not a sign of high future cashflows"
Finally they look at future returns.
The found that "High stock market capitalization forecasts low equity returns, and hence is a measure of low discount rates" & "high stock market capitalization is not a sign of high future cashflows"
16/
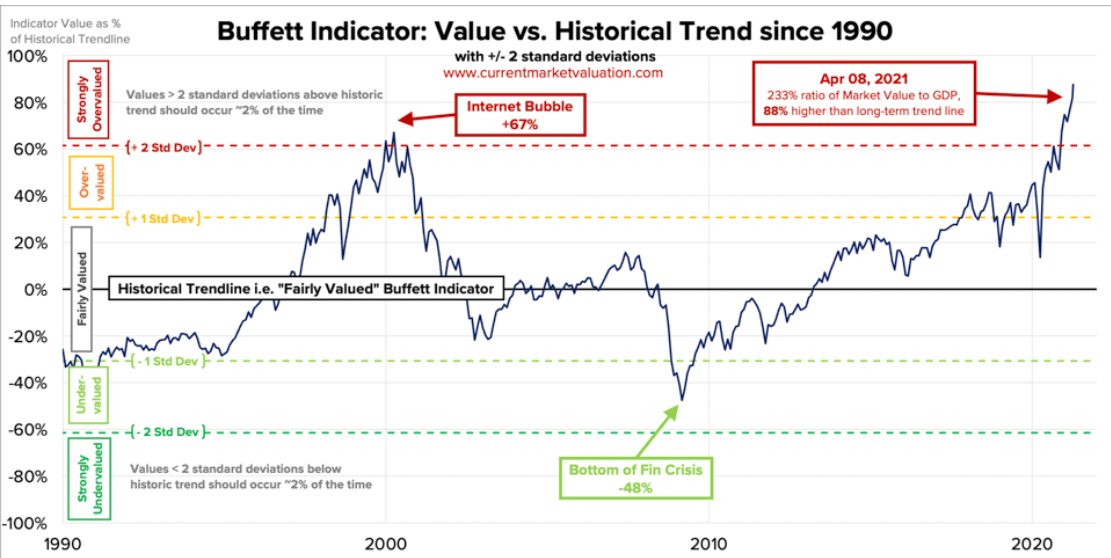
Comparing to the current situation.
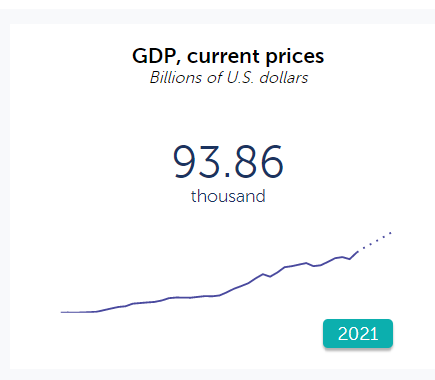
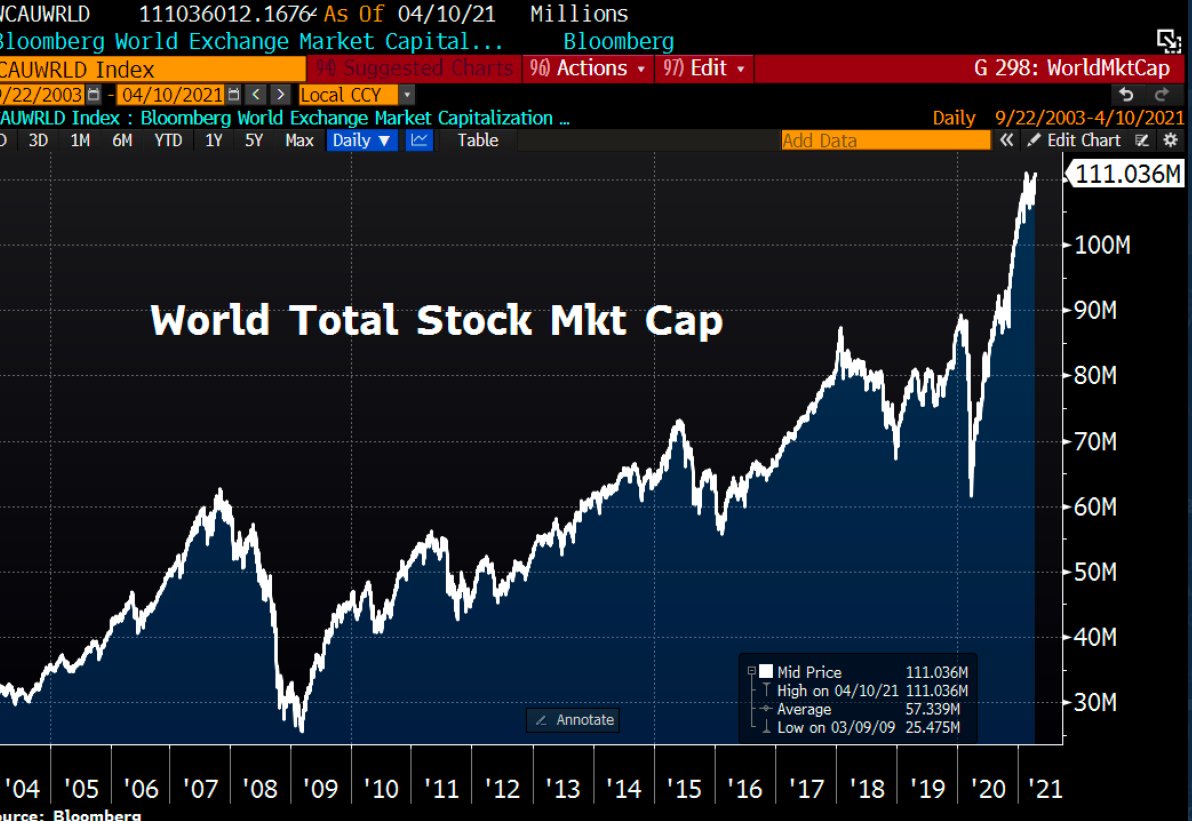
Per my basic computation, current Global MCap to GDP must be around 120%.
For the US it is at a staggering 233%
Sources IMF, BBG, currentmarketvaluation
Comparing to the current situation.
Per my basic computation, current Global MCap to GDP must be around 120%.
For the US it is at a staggering 233%
Sources IMF, BBG, currentmarketvaluation
17/
17/ Full essay:
http://www.ehes.org/EHES_136.pdf
Thanks">https://www.ehes.org/EHES_136.... for reading and sharing.
Link to top (for sharing) https://twitter.com/TheMarketDog/status/1381444683205812227?s=20">https://twitter.com/TheMarket...
17/ Full essay:
http://www.ehes.org/EHES_136.pdf
Thanks">https://www.ehes.org/EHES_136.... for reading and sharing.
Link to top (for sharing) https://twitter.com/TheMarketDog/status/1381444683205812227?s=20">https://twitter.com/TheMarket...

 Read on Twitter