With $ALTS popping left, right and center, we all want to spot the best opportunities.
Last week I explained the biggest cheat code (MAs). Today, I explain another trick from my book: the volume profile.
Last week I explained the biggest cheat code (MAs). Today, I explain another trick from my book: the volume profile.
Usual disclaimers, my thread(s) do not constitute advice in any form. They are my write-up of how I use the tools at my disposal, whatever you do with the information is your sole responsibility.
Do your own research and have fun. Let& #39;s get into it.
Do your own research and have fun. Let& #39;s get into it.
If you& #39;re not following me yet, I have a list of over 15 different trading-related threads pinned to my profile, which I frequently update. Follow me so you don& #39;t miss a thing.
For now, let& #39;s talk volume profiles.
For now, let& #39;s talk volume profiles.
You have probably seen my altcoin tweets in the past weeks, in which I talk about low volume areas and "thin air". The volume profile helps me identify these areas.
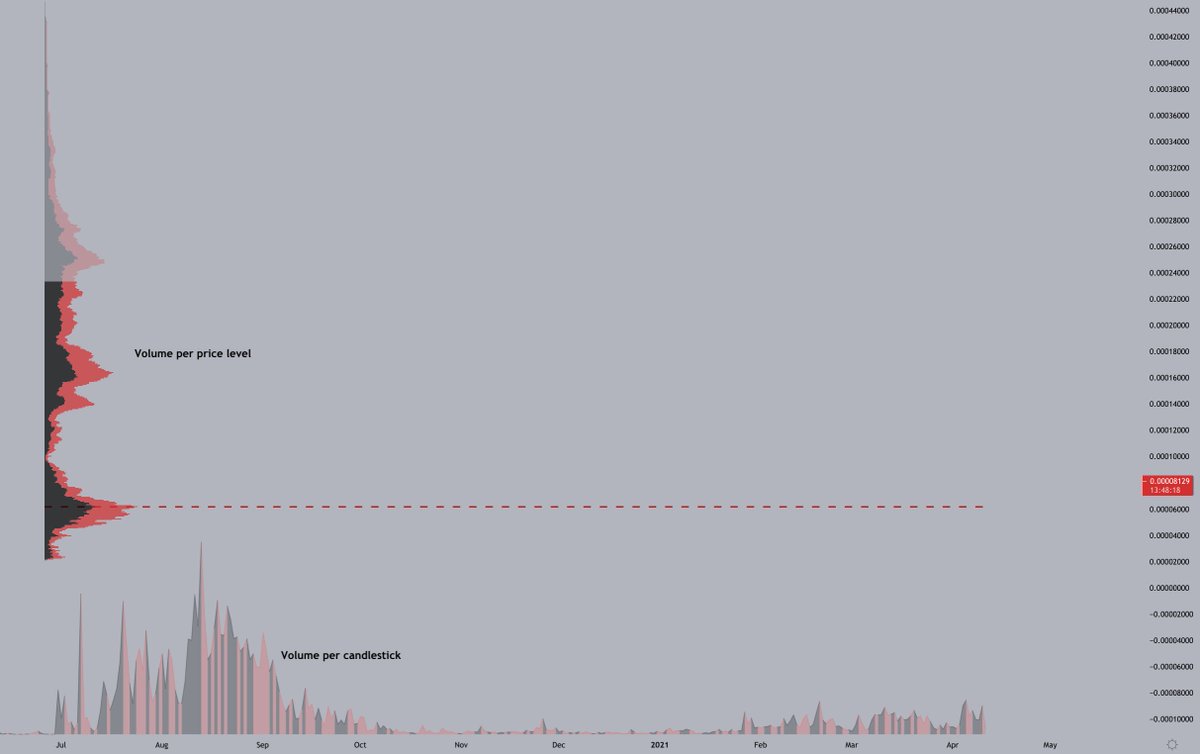
Put simply, the volume profile visualises where the most volume was transacted.
"But Jelle, how is that different from the volume indicator?"
Well, anon. The volume indicator looks at volume per candlestick, whereas the volume profile looks at price levels. See below.
"But Jelle, how is that different from the volume indicator?"
Well, anon. The volume indicator looks at volume per candlestick, whereas the volume profile looks at price levels. See below.
I like to use the fixed range profile, where you define the area the indicator looks at yourself. Alternatively, you can use VPVR, which analyses what is on screen.
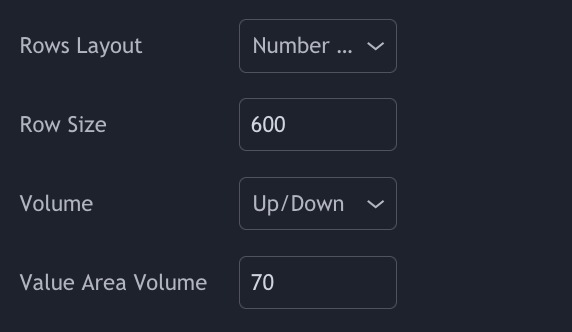
I& #39;ve customised the indicator inputs to a higher row size, to get a more detailed view. This is up to preference.
I& #39;ve customised the indicator inputs to a higher row size, to get a more detailed view. This is up to preference.
We now know what the indicator does: display traded volume by price.
But what does it tell us?
I briefly touched upon this yesterday, when I discussed why I expected the marked zone to be defended.
But what does it tell us?
I briefly touched upon this yesterday, when I discussed why I expected the marked zone to be defended.
I operate under the assumption that people like to defend their entries. High volume areas mean that many transactions took place in that area.
I.e. there will be many people with an interest in defending the area.
What does this remind us of? Bingo, Support and resistance.
I.e. there will be many people with an interest in defending the area.
What does this remind us of? Bingo, Support and resistance.
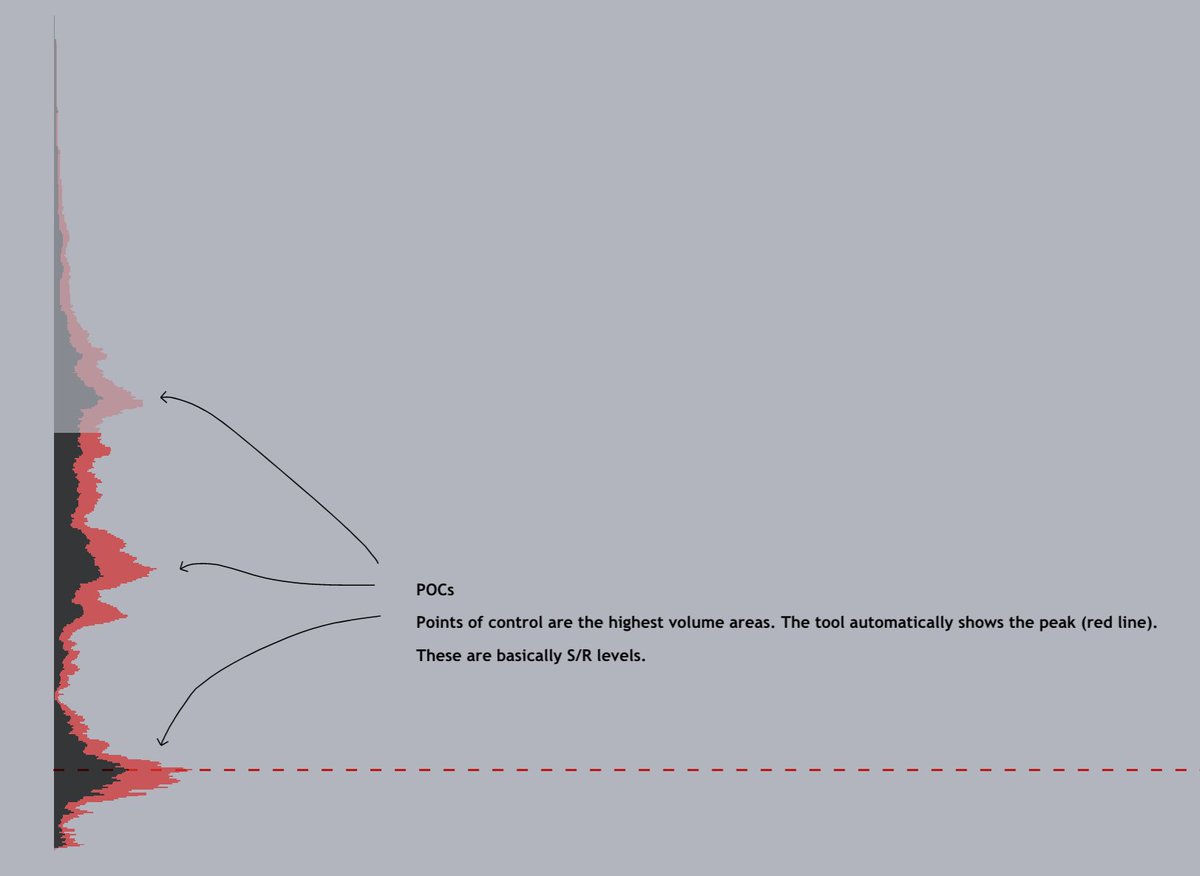
This is where POCs (Point of Control) come in. The highest volume areas in the volume profile generally act as support and resistance.
Here& #39;s a thread on support and resistance in case you need a refresher. https://twitter.com/CryptoJelleNL/status/1357696153102540801?s=20">https://twitter.com/CryptoJel...
However, that& #39;s not my main application for the volume profile. We know how S/R works, and how to identify them.
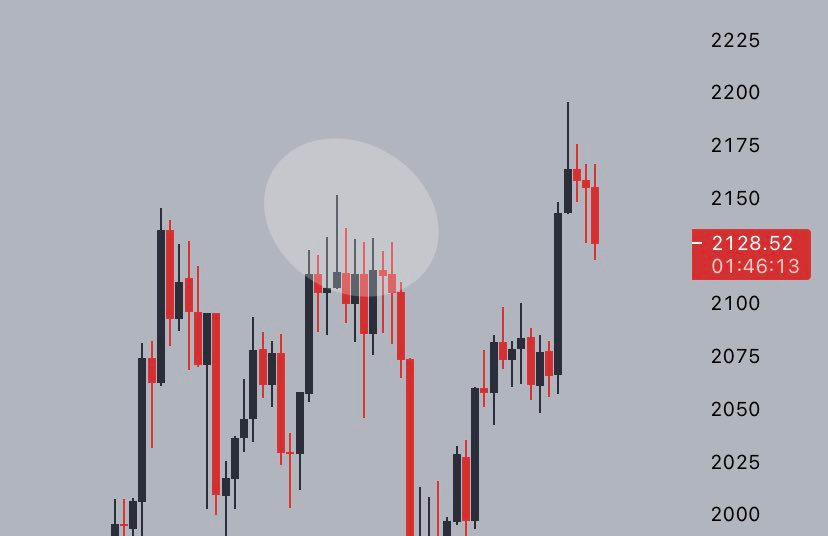
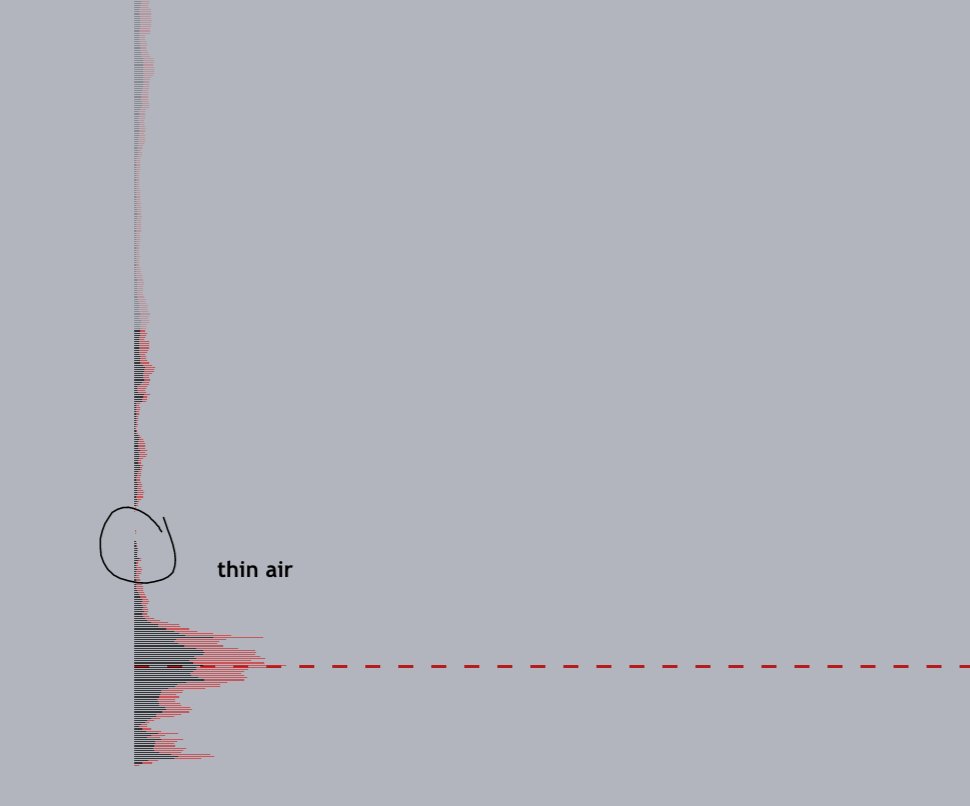
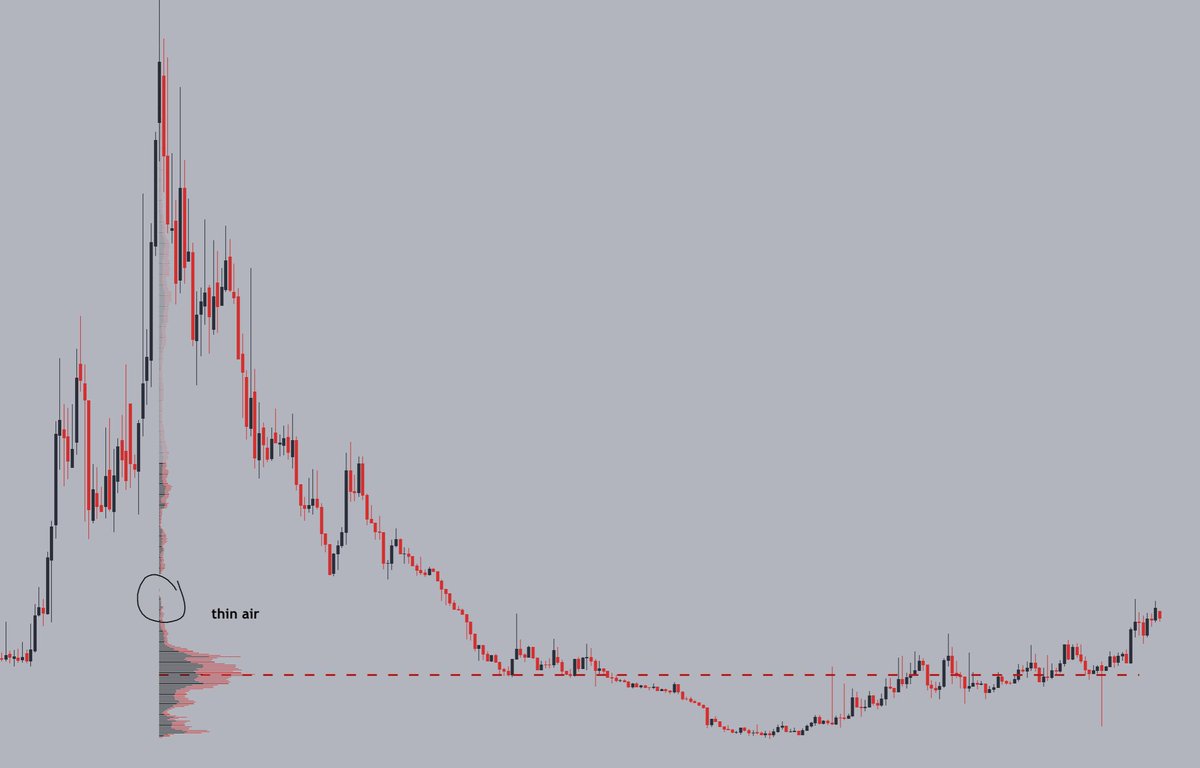
The picture below shows what I like to see. When almost no volume occurred in an area, it means there are few people with an interest to defend that area.
The picture below shows what I like to see. When almost no volume occurred in an area, it means there are few people with an interest to defend that area.
This tells me price will not have a hard time moving through the area, allowing for rapid moves upwards.
So when you find an $ALT with a solid MA structure & volume profile gaps above, you can expect strong moves to the upside.
So when you find an $ALT with a solid MA structure & volume profile gaps above, you can expect strong moves to the upside.
It& #39;s not hard science, and definitely not something to base trades on alone, but it& #39;s something I like to see when scouting altcoins.
The $ALTS market is ruled by MAs. Volume profiles just serve to add confidence to your upside, and to pick out targets.
The $ALTS market is ruled by MAs. Volume profiles just serve to add confidence to your upside, and to pick out targets.
Based on these MA + VP setups, I& #39;ve recently been able to play $SRM, $TOMO, $SXP, $KNC and various other $ALTS for solid gains.
Play around with it, backtest and see if it works for you.
Play around with it, backtest and see if it works for you.

 Read on Twitter