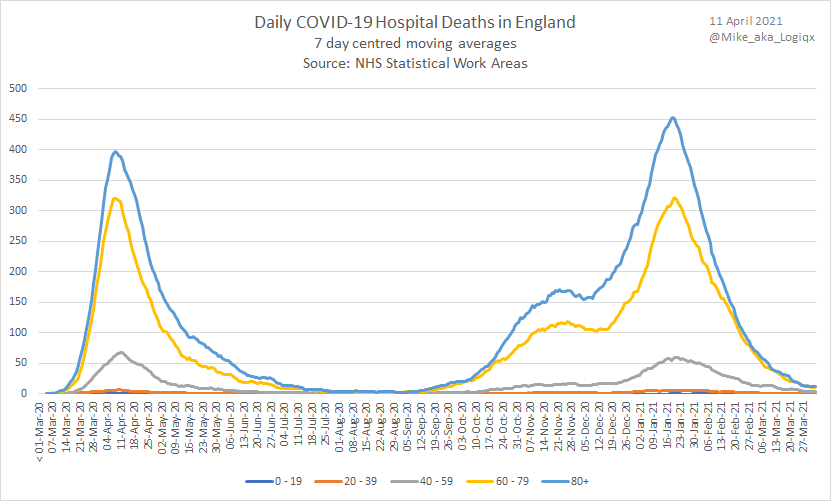
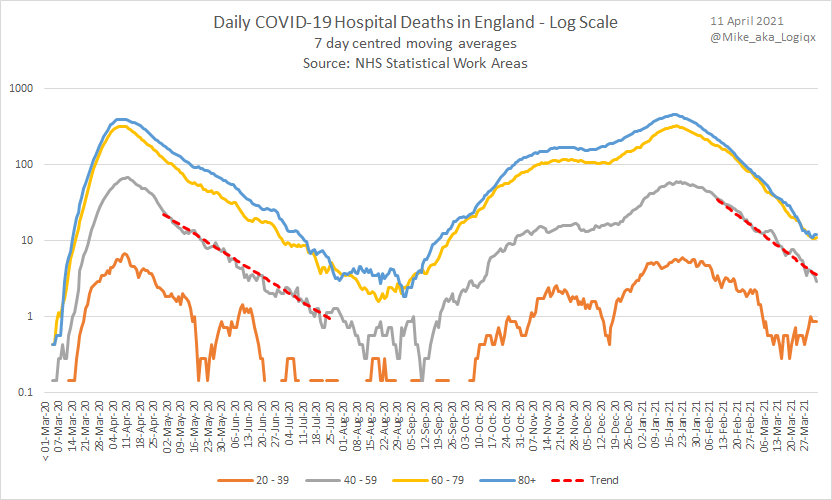
A short thread looking at the rates that COVID-19 deaths have been decreasing as we exit the second / third wave. TLDR - things are improving much more quickly than they did in the first wave. This first chart is a simple plot and just a quick introduction. Log scale follows! 1/5
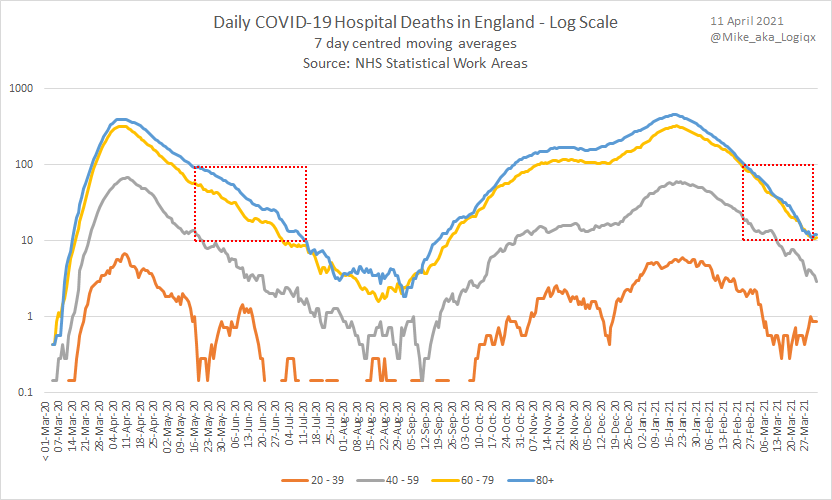
I& #39;ve highlighted the periods where daily deaths (7DMA) have reduced from 100 per day to 10 per day for 80+. Note how 60-79 and 80+ were falling at ~ the same rate in the first wave but 80+ were still higher. Deaths of the 80+ have been comparable to 60-79 since mid-Feb 2021. 2/5
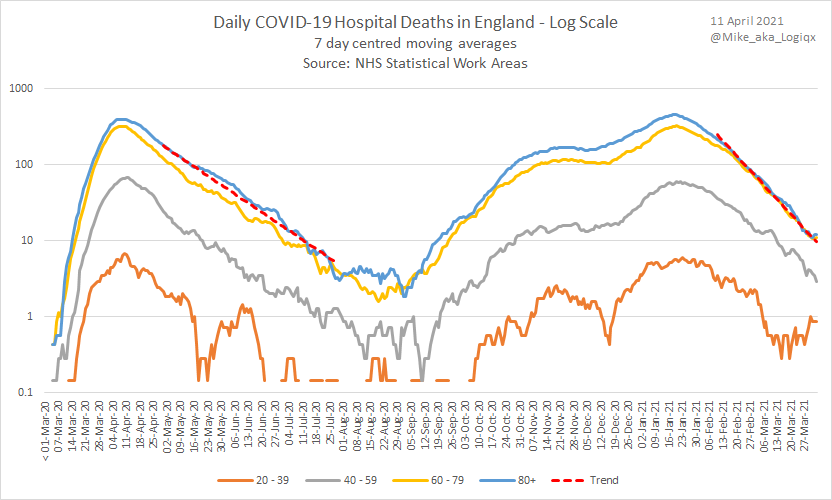
The gradients are very significant. Fitting trend lines to the periods where the 7DMA fell from 100 to 10 we can see the gradient is much steeper this time around. C-19 deaths were falling by 3.9% per day last year but 6.1% per day this time around. That& #39;s a 58% improvement! 3/5
So deaths in the 80+ have been falling almost 60% faster than during the first wave. The gap has also closed between deaths in 80+ and 60-79 but deaths of 60-79 have also been falling at 6.1% per day which is 70% better than the first time around! 4/5
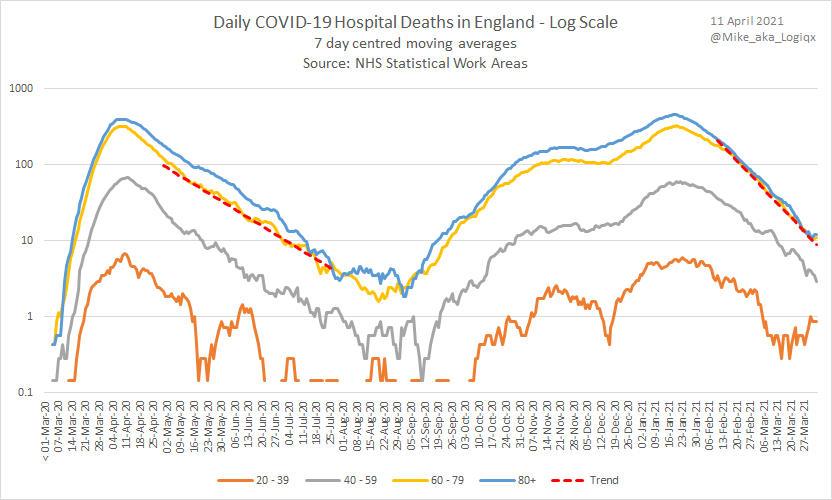
More good news... during the same period, deaths in the 40-59 age group were decreasing at 4.4% per day. This is a 20% improvement on the 3.6% per day during the end of the first wave. I& #39;m sure there are many reasons for this good news but vaccines likely to be a big factor. 5/5

 Read on Twitter