@OptionsCharting Charted a few of my favs from those inside weeks and fresh actseq& #39;s you posted.
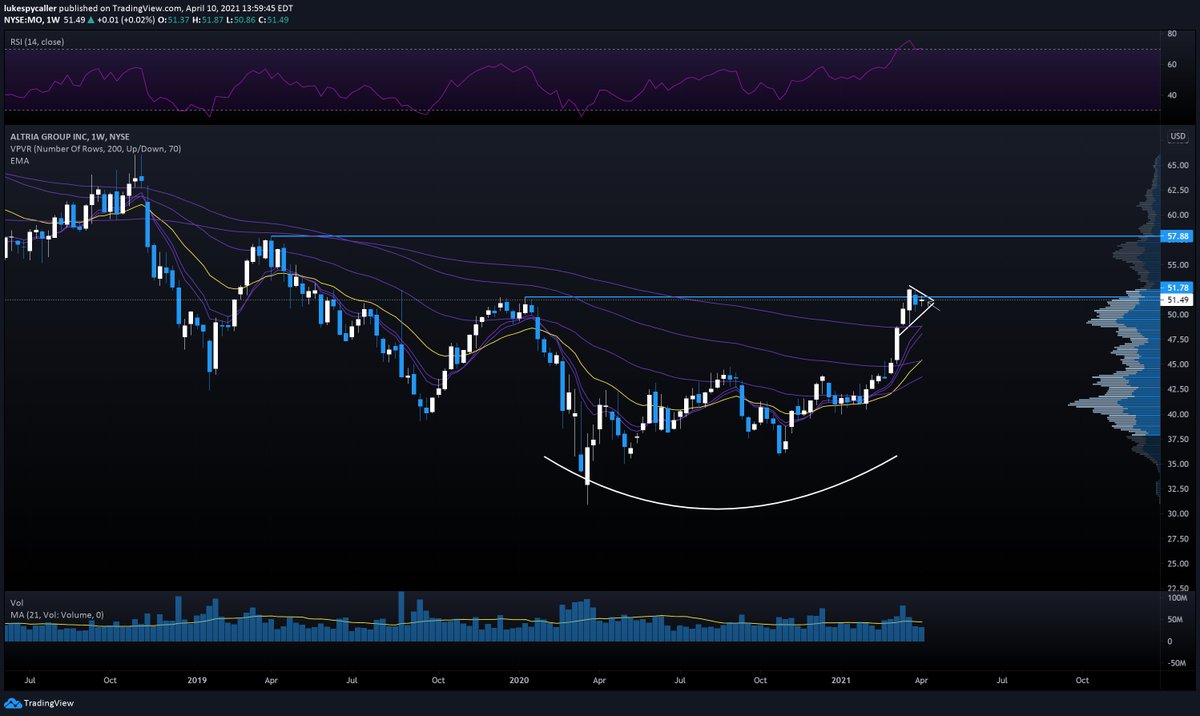
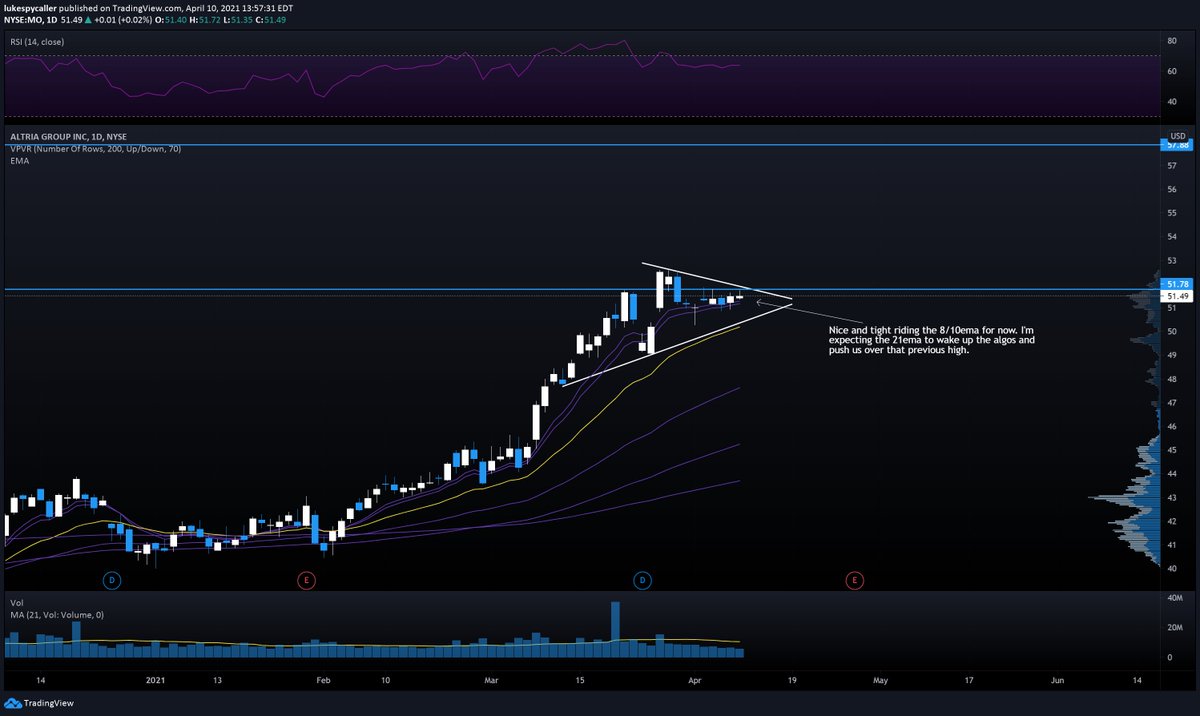
$MO - Weekly showing a large round bottom as we flag with back to back inside weeks right below a previous high. Closer look at the daily we can see the 21ema catching up and price action getting very tight. Expecting the 21 to produce a nice push. Can long above $51.78 imo.
Overall plan I& #39;d be watching for a break of a previous high or last weeks range to go long. 21ema touch also a great entry.
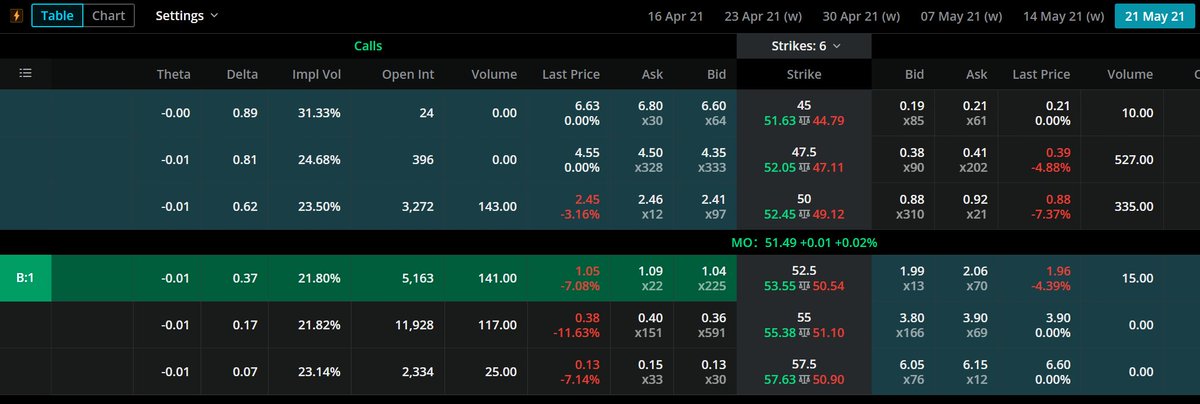
In terms of cons short term I& #39;d be eyeing the $52.5c for May 21 at 1.06. Longer term or larger size position I would eye the $55c for September around 1.34
In terms of cons short term I& #39;d be eyeing the $52.5c for May 21 at 1.06. Longer term or larger size position I would eye the $55c for September around 1.34
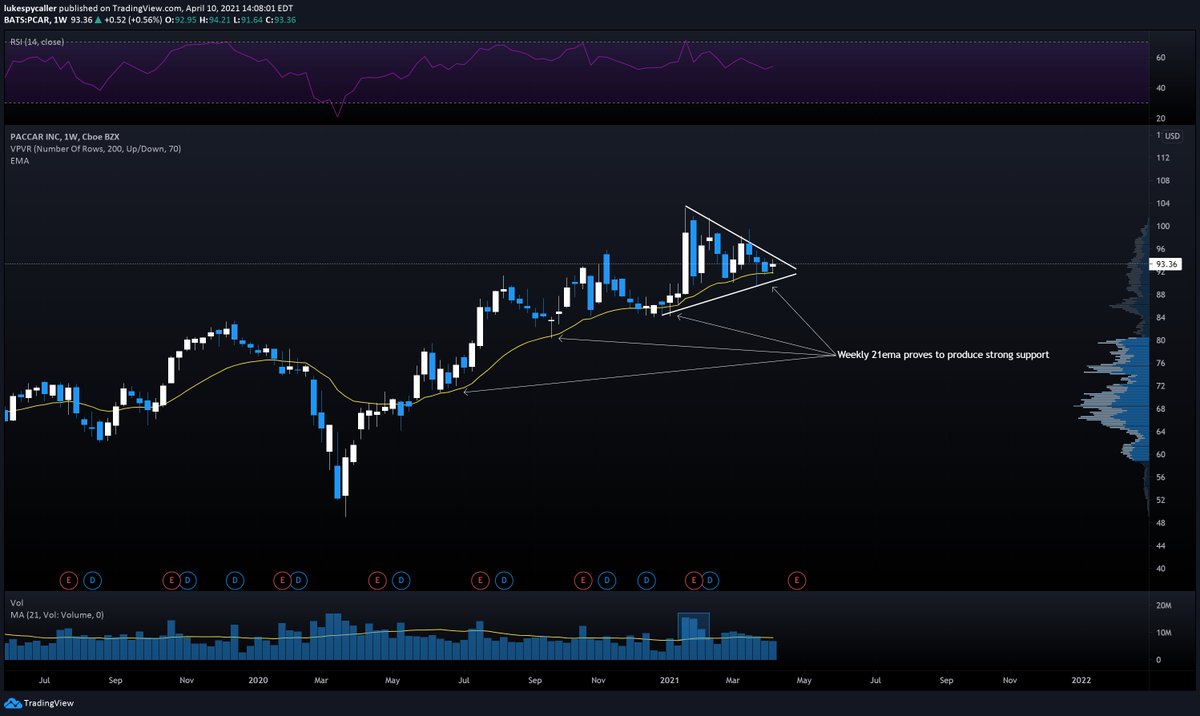
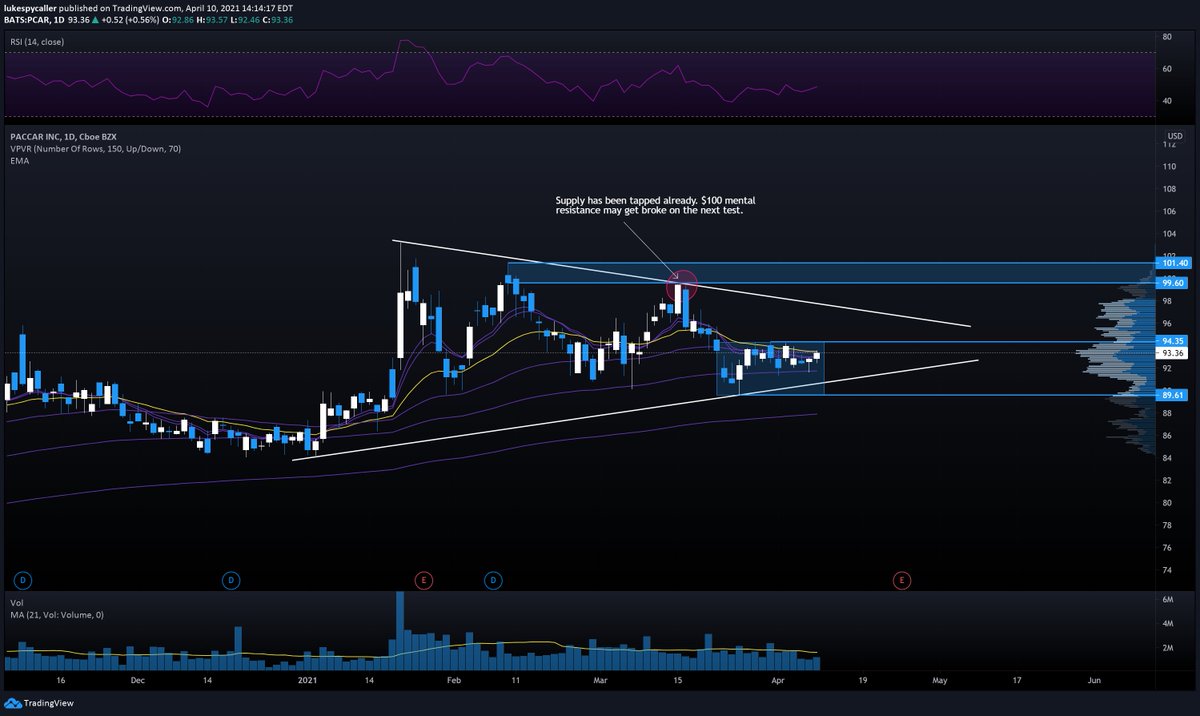
$PCAR - Weekly view showing us that the weekly 21ema has proven itself to produce great support in the past, we can assume the same here. Daily showing a tight range but looks like it wants to reclaim those key 8/21emas. Over this weekly range of $94.35 we can go long targeting..
a test of supply above at $99.60. There may be a dip there due to that mental level of $100 but we can see that supply has been tested once before meaning sellers there are weak.
In terms of cons the $95c for Aug seems like the best choice to capture this move.
In terms of cons the $95c for Aug seems like the best choice to capture this move.
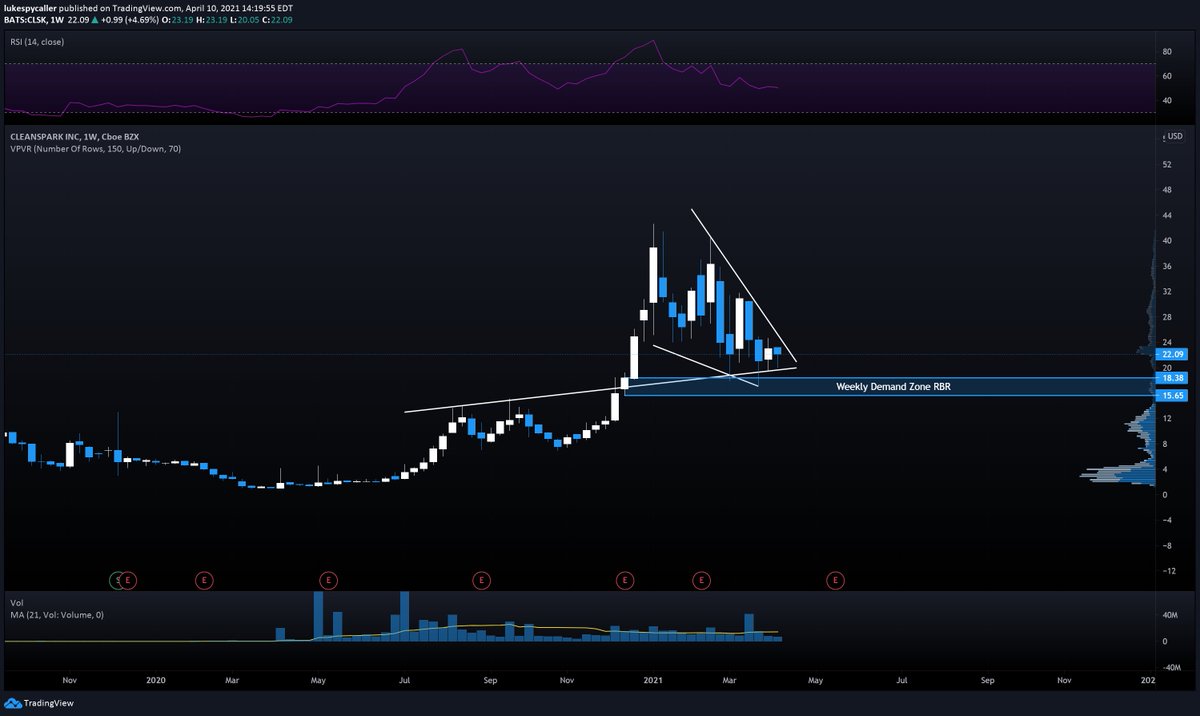
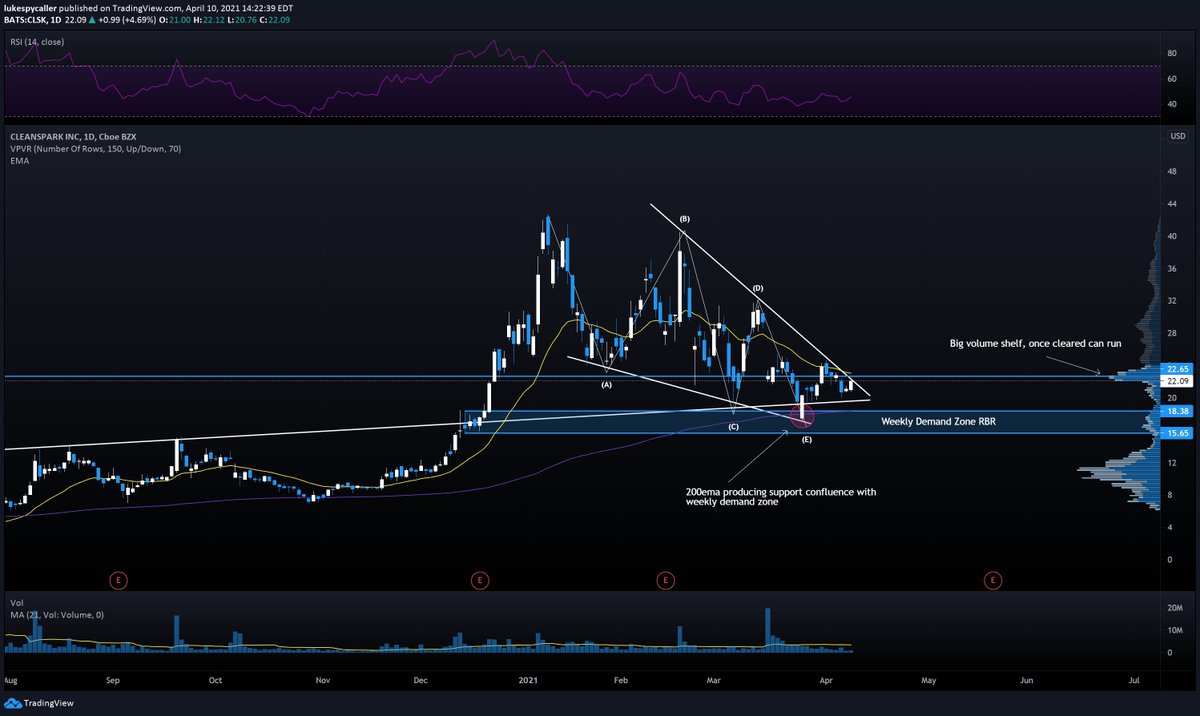
$CLSK - Weekly showing a falling wedge into a weekly RBR demand zone. Closer look at the daily showing ABCDE wedge into demand with a big bullish candle once we fell into it. Buyers obviously have orders waiting there.
Can play the break of the volume shelf identified. There is a gap to fill above as well. Cons are a bit wild with the IV so I would play commons here. To me I would keep loading this position above $15.65 with the bias that we would again retest some highs around $40.
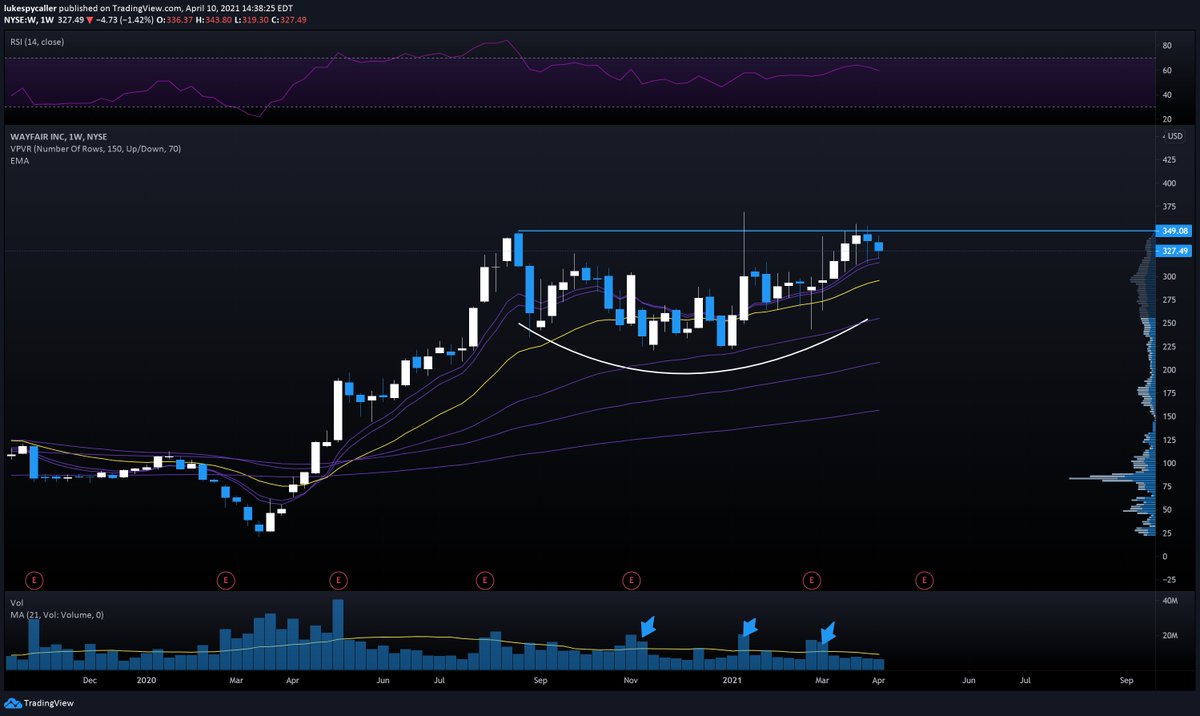
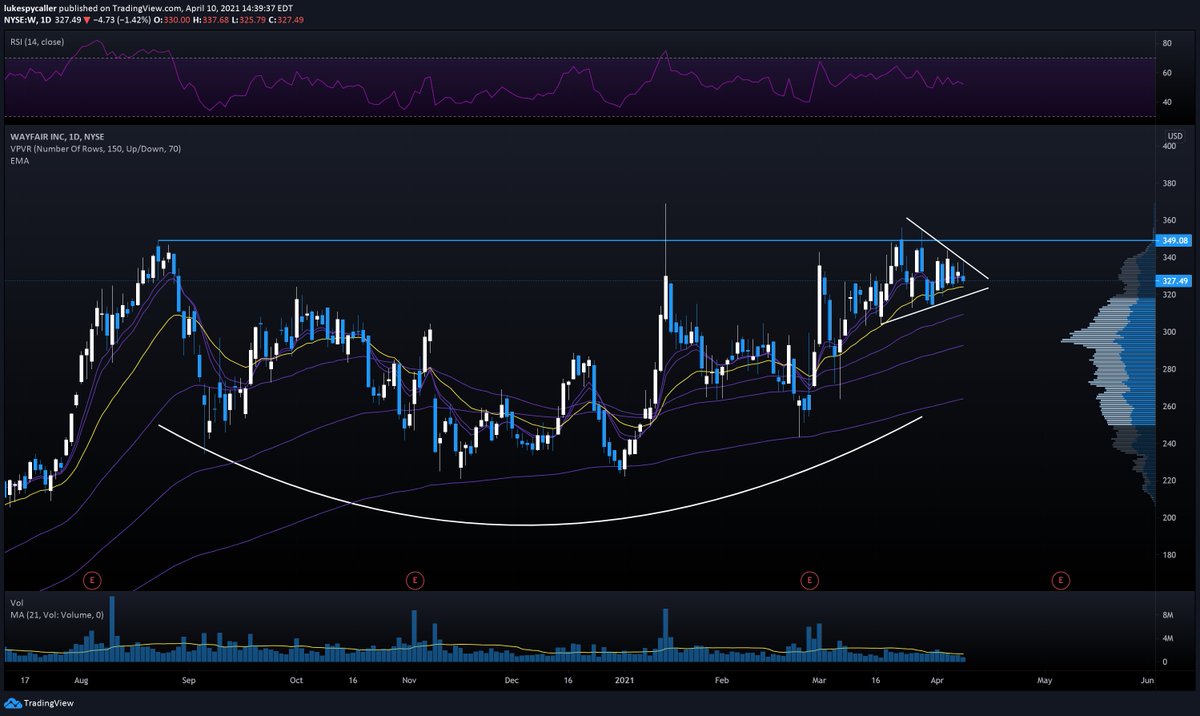
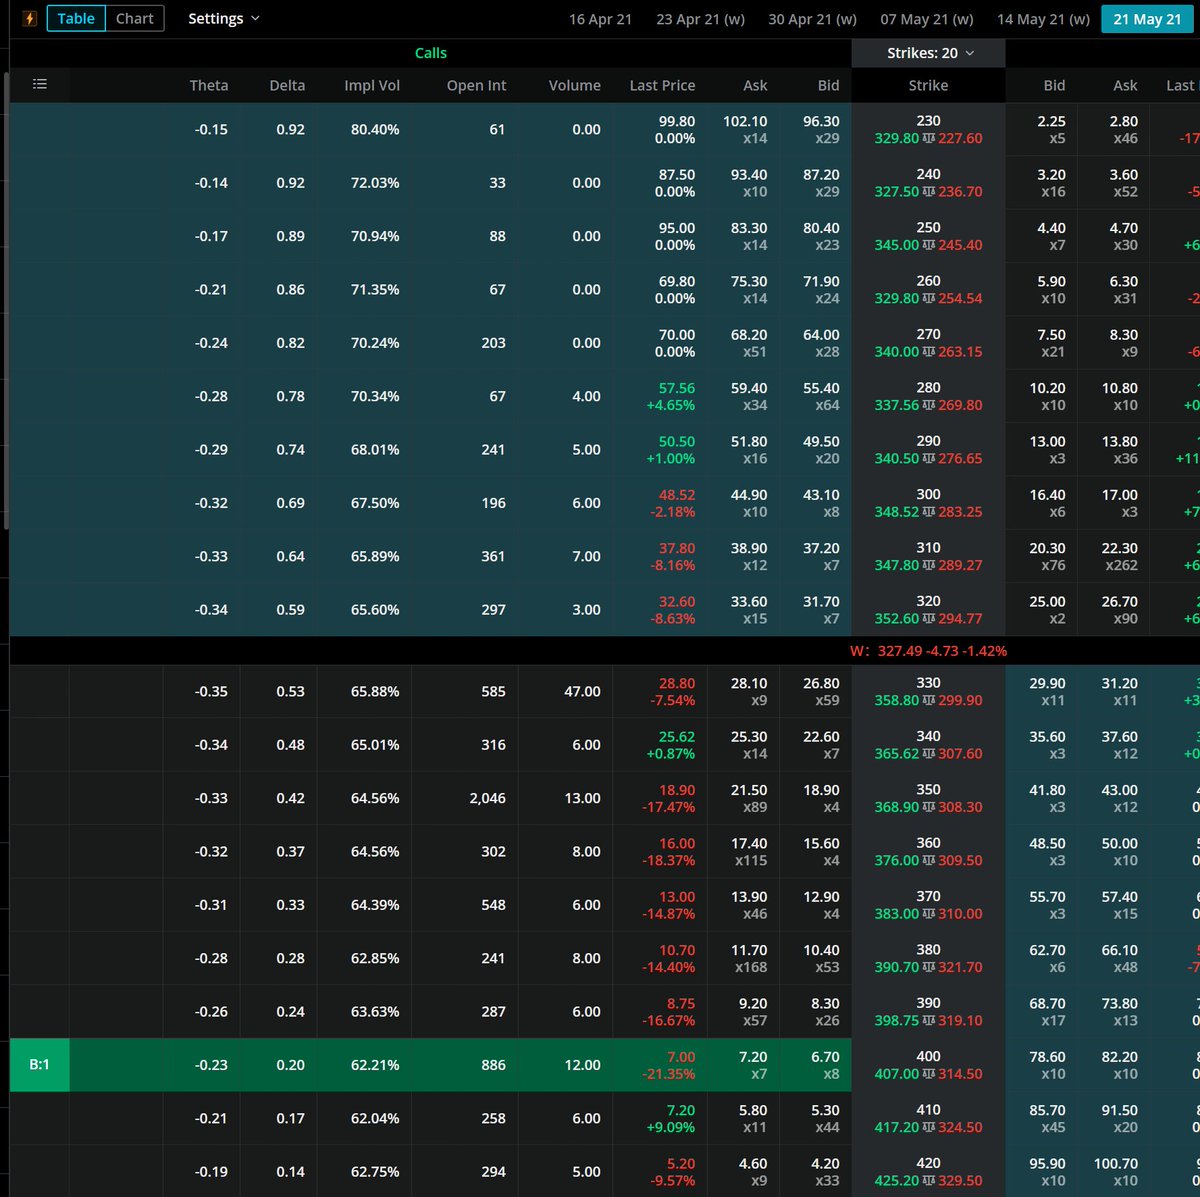
$W - Weekly showing a big cup with clear accumulation since August 2020. This thing has an angry look and is going to rip some faces soon. Daily showing multiple inside days riding the 21ema and obvious accumulation. Break this TL above and its running.
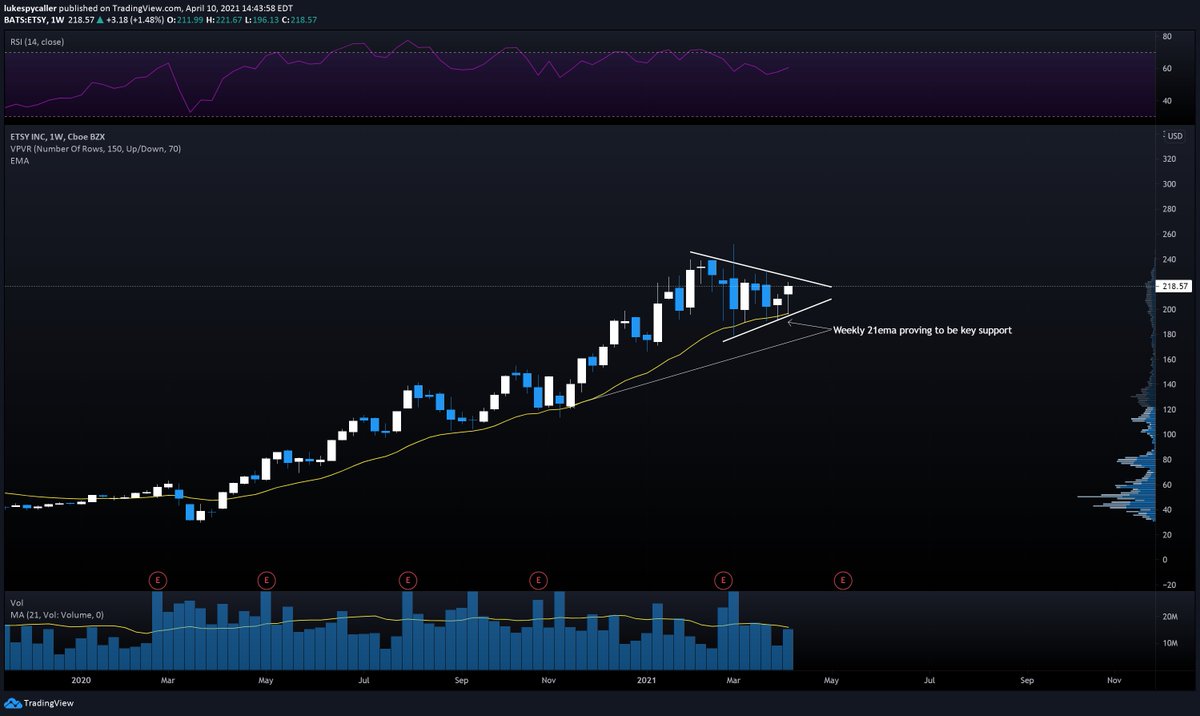
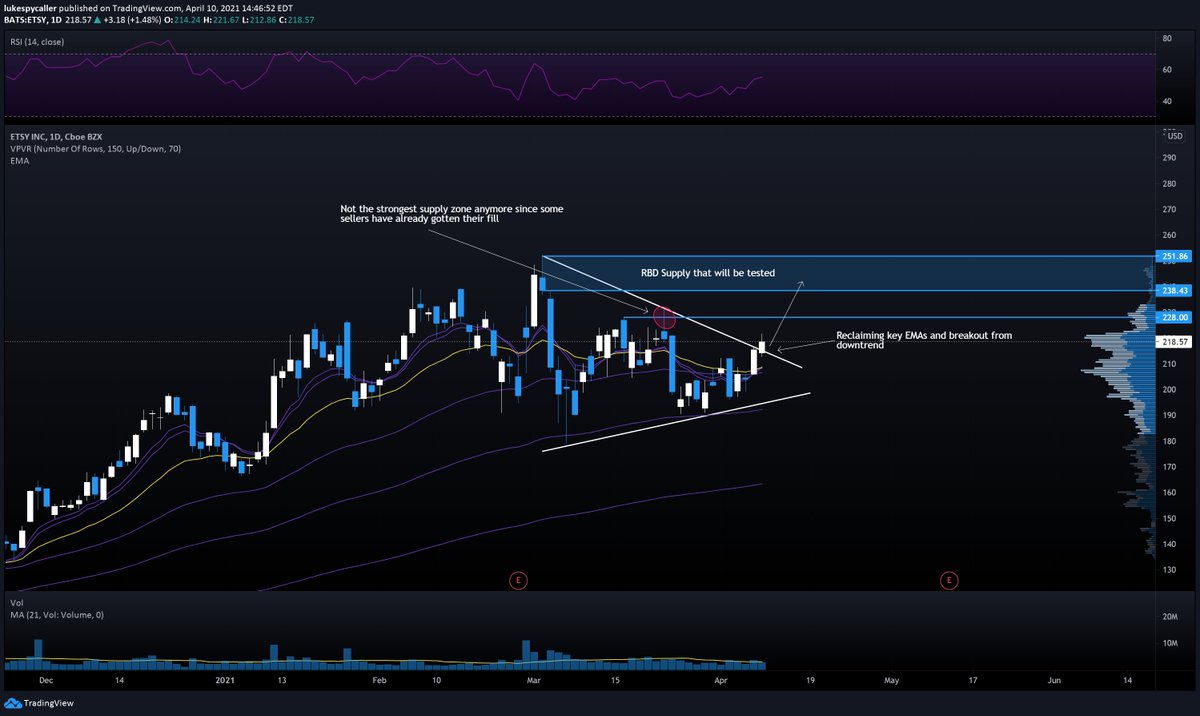
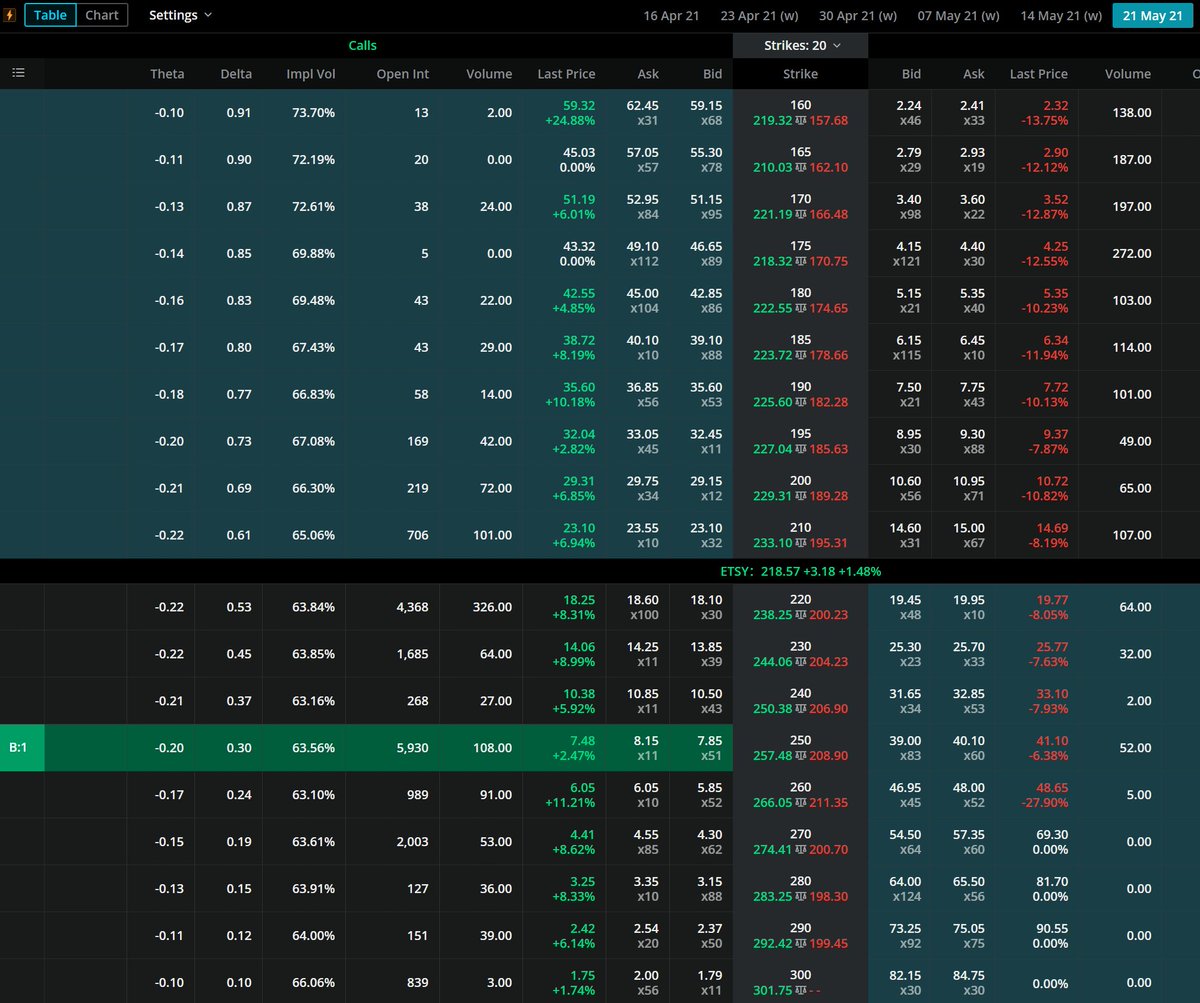
$ETSY - Weekly again showing that the 21ema proves to be great support with this weeks low touching it to the tick. Daily look we can see a downtrend was broken on Friday after a big bullish candle on Thursday. There is some weak supply above and I expect any dips into key...
8/21ema& #39;s to be bought and for the RBD supply zone above at $238.43 to be tested.
I like the 250c for May 21 around $8 for a swing into that supply zone.
I like the 250c for May 21 around $8 for a swing into that supply zone.
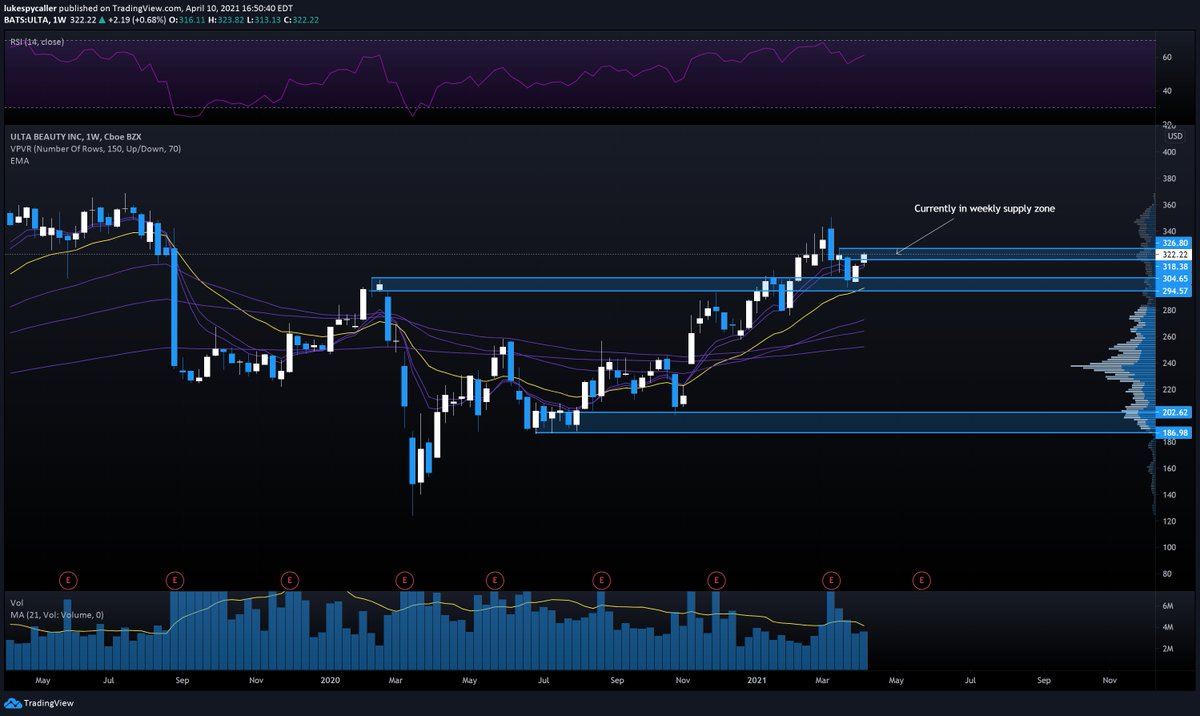
$ULTA - Currently in a weekly supply zone but a closer look at the daily shows that there is some short term strength and a possible inverse HnS forming. A break of this neckline can take us to fill the ER gap down. After a gap down an inverse HnS tells me that buyers found value
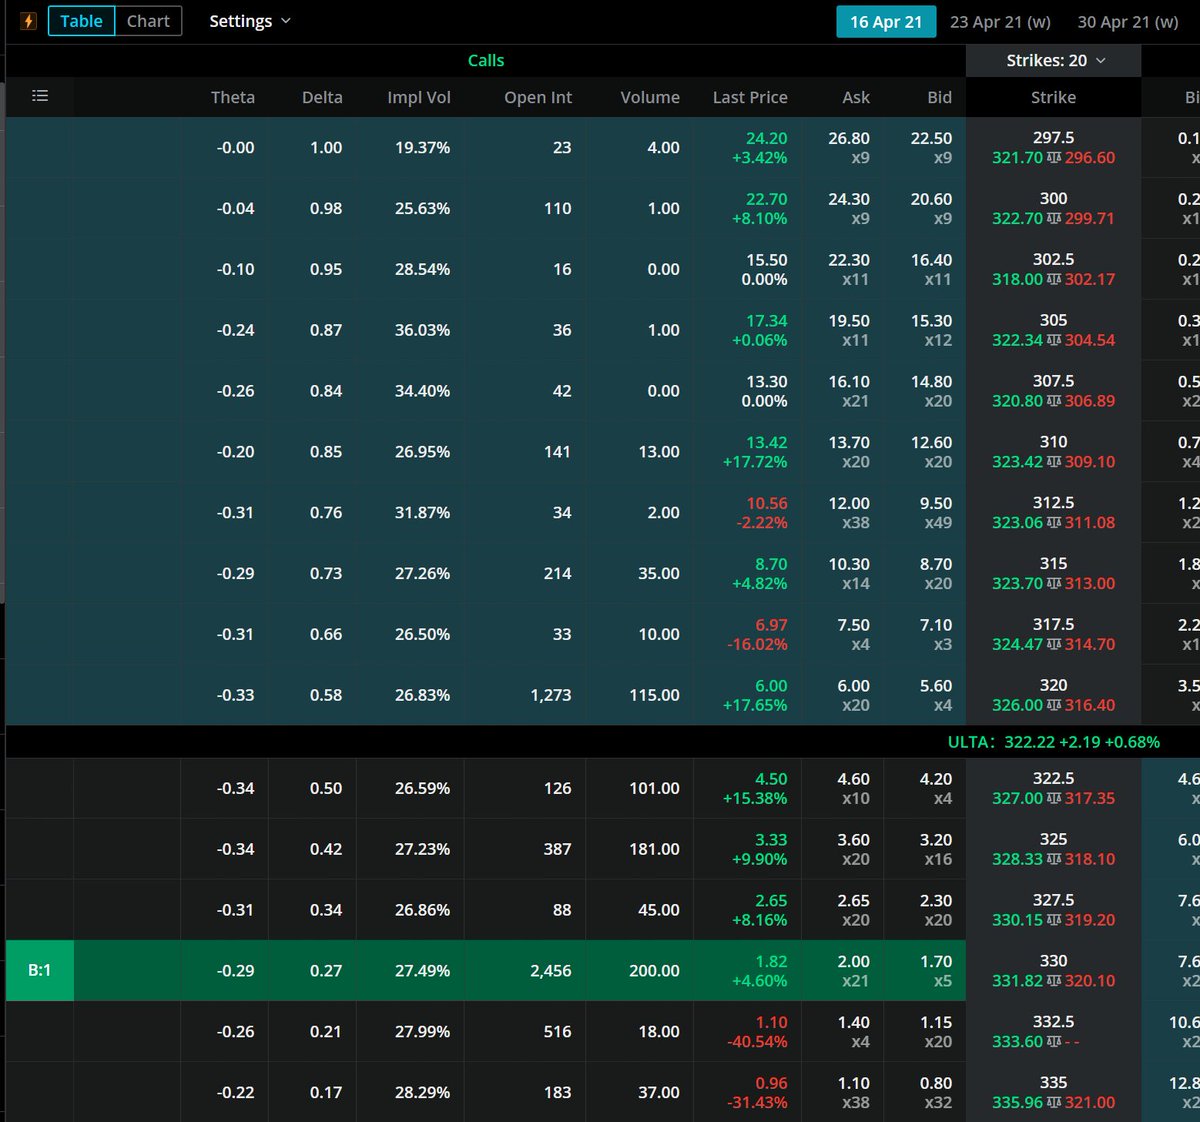
The 330c weekly would actually be of interest to me if we break this neckline as the gap fill could happen quick!
Hope you are having a great weekend brother, ready to kill it this week and find some plays  https://abs.twimg.com/emoji/v2/... draggable="false" alt="💪" title="Angespannter Bizeps" aria-label="Emoji: Angespannter Bizeps">

 Read on Twitter