Interesting new pre-print from Italy looking at the changes in doubling time of infections after school reopening last September. It compares the growth rates of daily new confirmed cases before and after a switch into exponential growth. https://www.medrxiv.org/content/10.1101/2021.04.06.21254993v1">https://www.medrxiv.org/content/1...
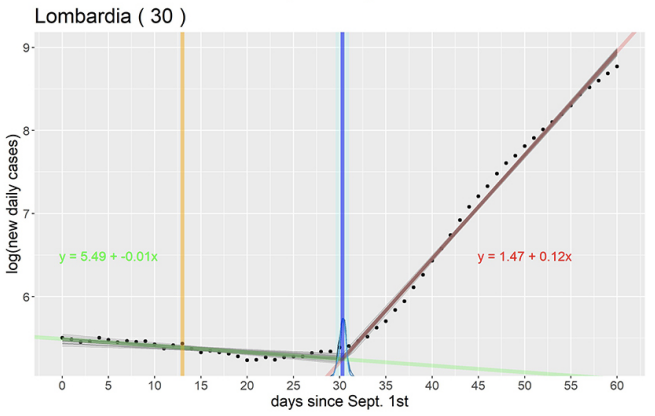
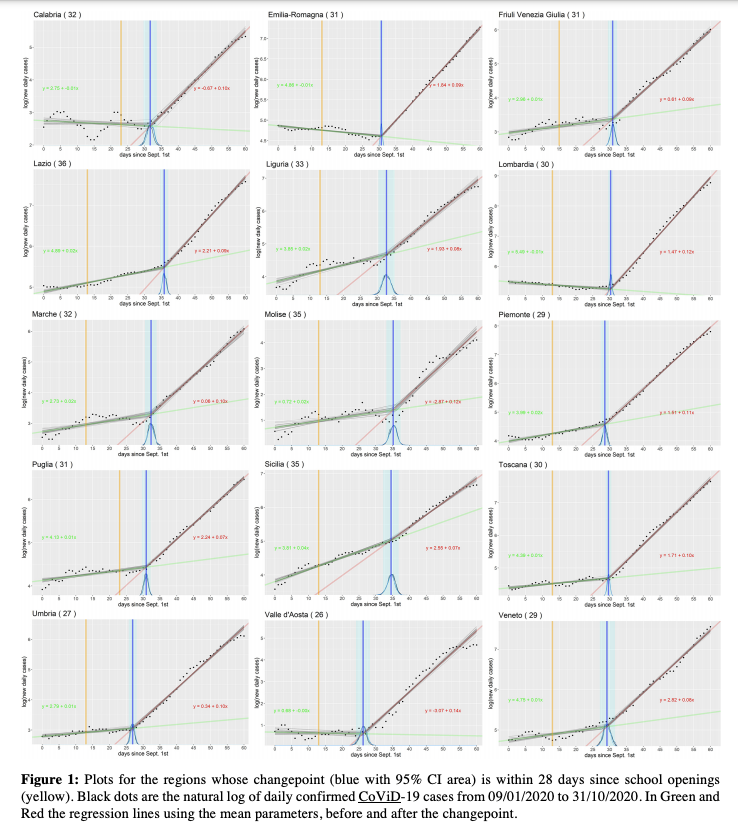
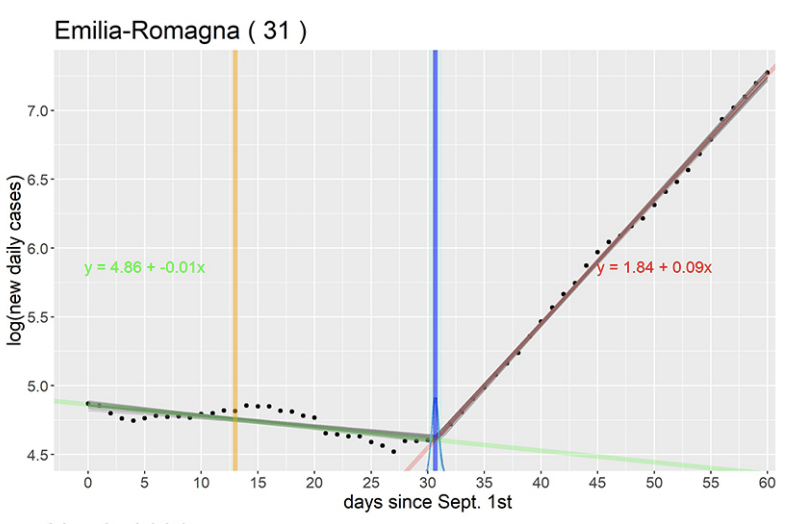
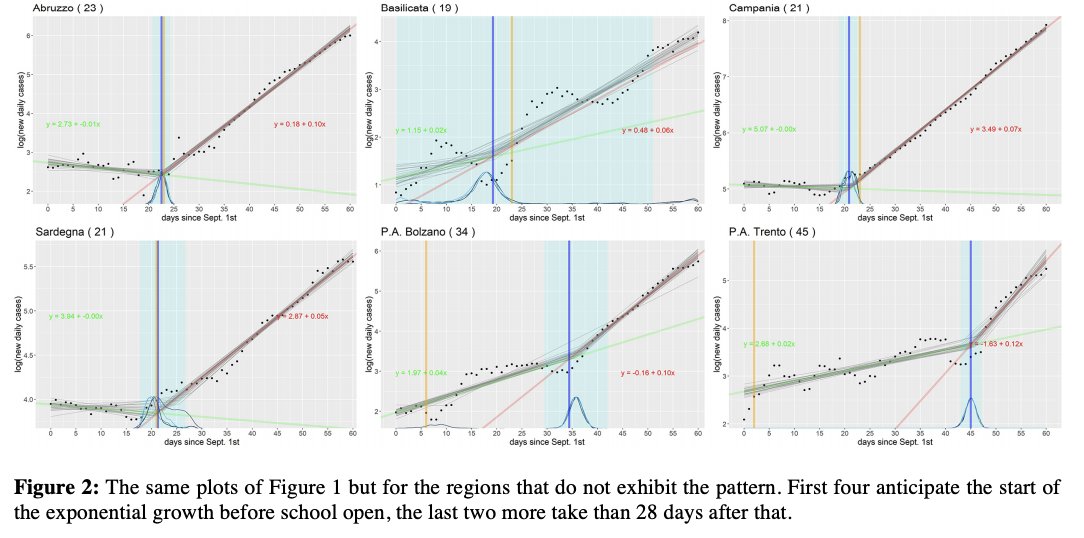
Rates are smoothed using 7-day rolling averages and log-transformed. A series of regional plots as the one below are presented in which the yellow line is date of school reopening in the region and the blue line is the date when the slope switches.
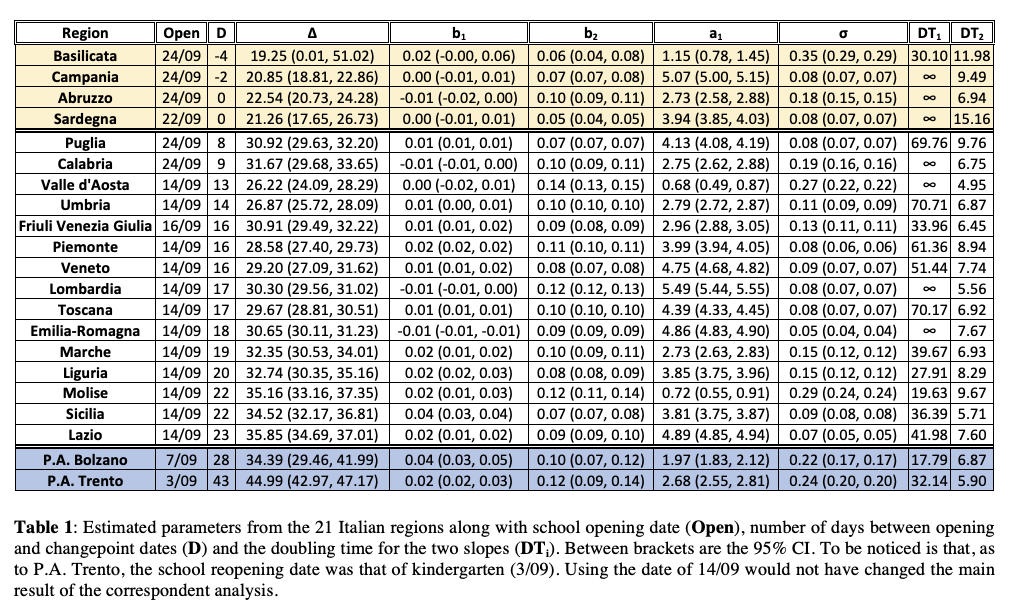
The doubling time of the growth rate (number of daily cases) changed consistently to approximately 7 days (lowest 5 and highest 15 days) in all regions as can be seen in the last column (DT2) of the table below.
70% of all regions had a change in slope within 28 days of reopening - with a mean time of 16 days - or approximately 2 weeks. As can be seen below, the changes are very clear and happened regardless of the pre-reopening trends.
For example, the Emilia-Romagna region was experiencing negative growth (decline) and switched to sharp exponential growth 18 days after reopening schools, achieving a doubling time of 7.7 days.
Only 6 regions had longer (over 28 days) or shorter time to a change in slope after reopening. There are not enough details about context, except that these are coastal regions where summer tourism may have played a role .
In 11/21 regions the average doubling time was 47 days before reopening and reduced to <8 days days just over 2 weeks after reopening. 4 regions with negative growth before reopening were excluded from this calculation as they had phase inversions (no DT1 before reopening).
A helpful perspective by the authors: while a 10% increase in in-person work also happened around the same time schools reopened, that affects the contact patterns of 2.5M people, while school reopening affects the contact patterns of 11M people (school personnel and students).

 Read on Twitter