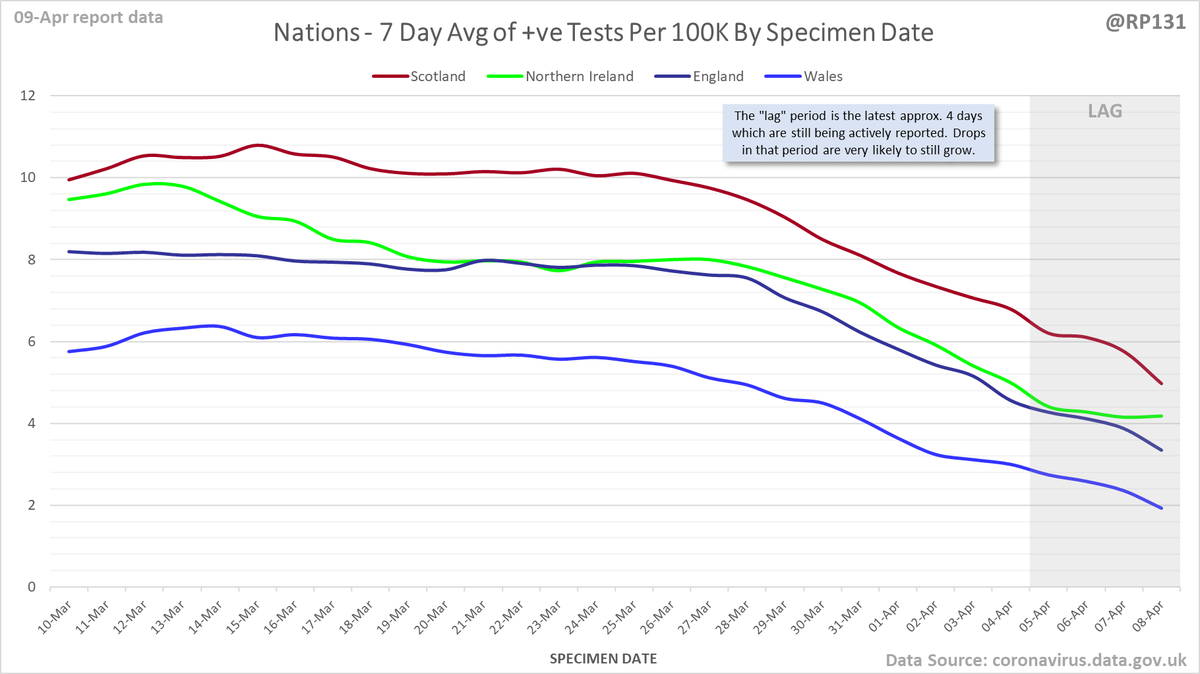
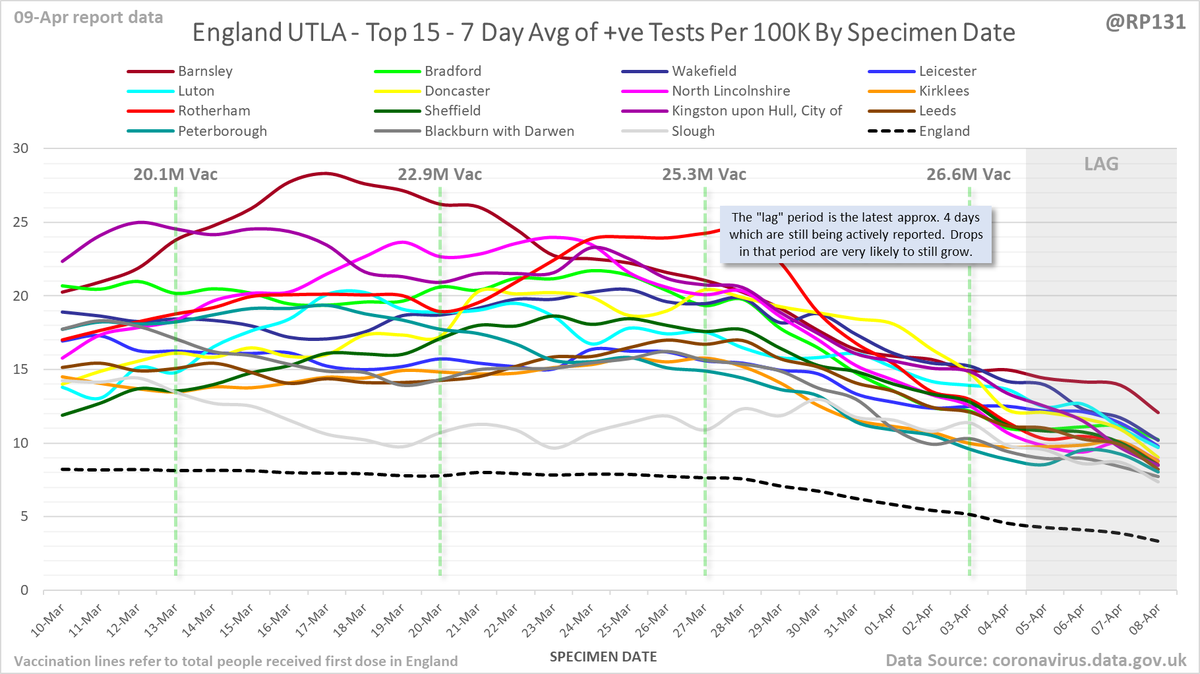
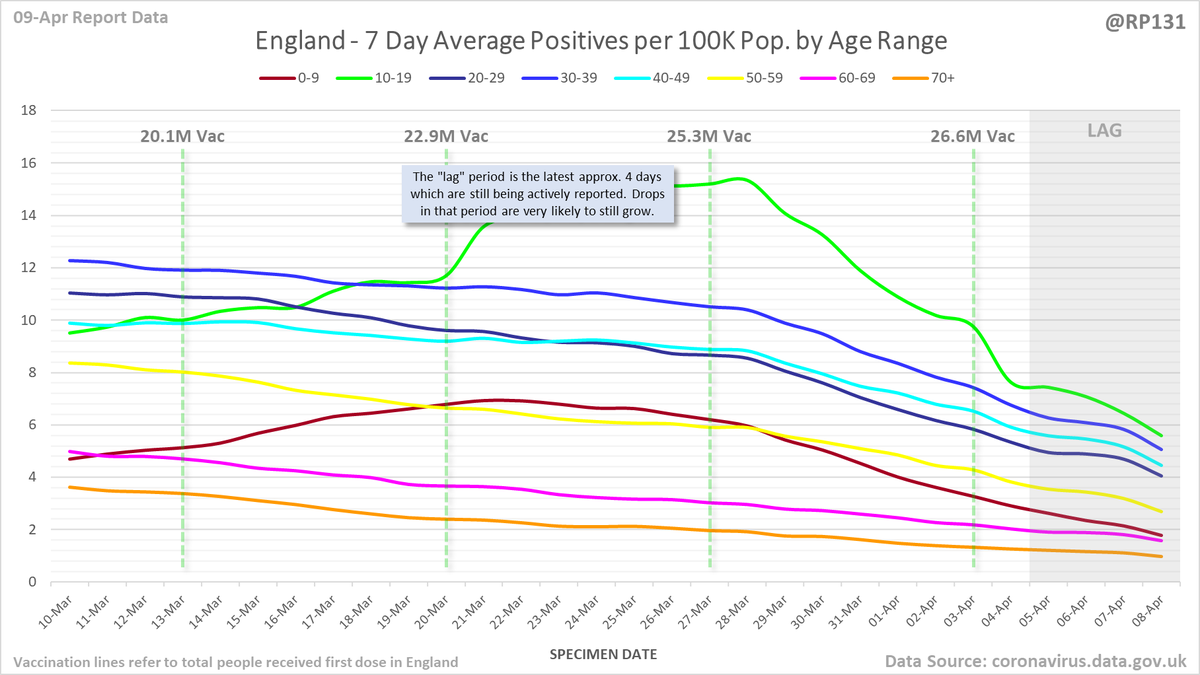
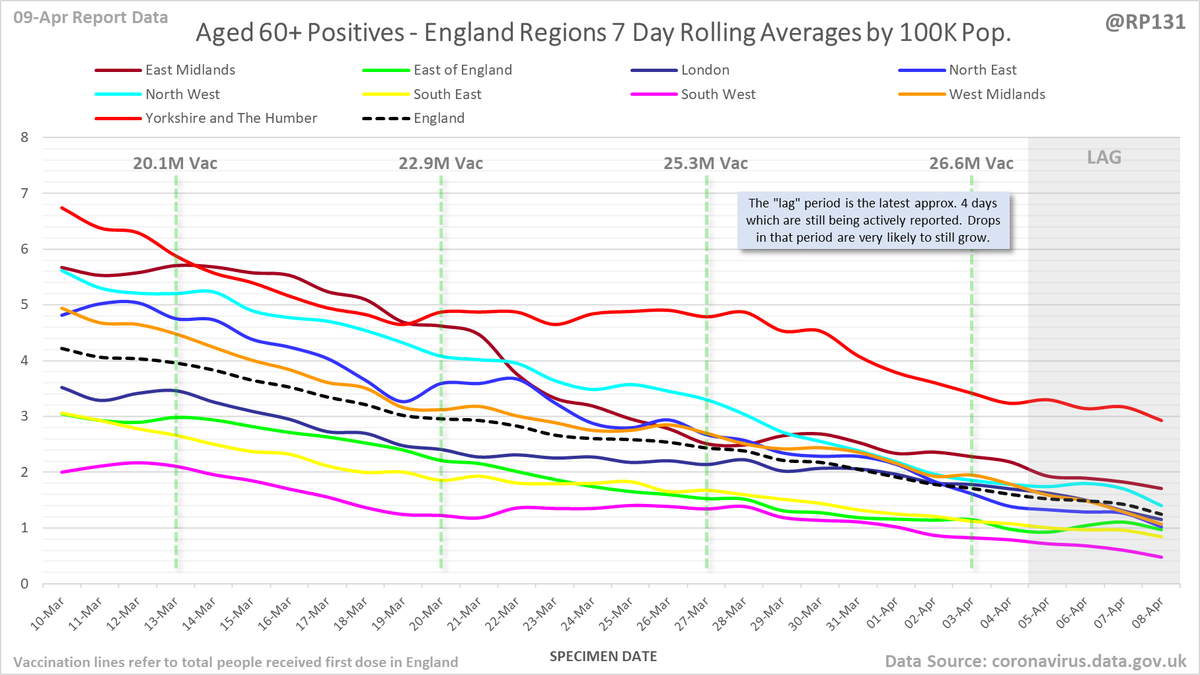
#covid19uk - Detailed positive tests thread. The majority of this thread is a set of views of rolling 7 day average positives per 100K by specimen date. Starting with England regions:
Some of the more detailed content from this thread has been moved to an external page to try and make the twitter updates a bit more manageable. You can still see the full version here: …https://coviddatashare.s3-eu-west-1.amazonaws.com/Detail/Detail_20210409.html">https://coviddatashare.s3-eu-west-1.amazonaws.com/Detail/De...
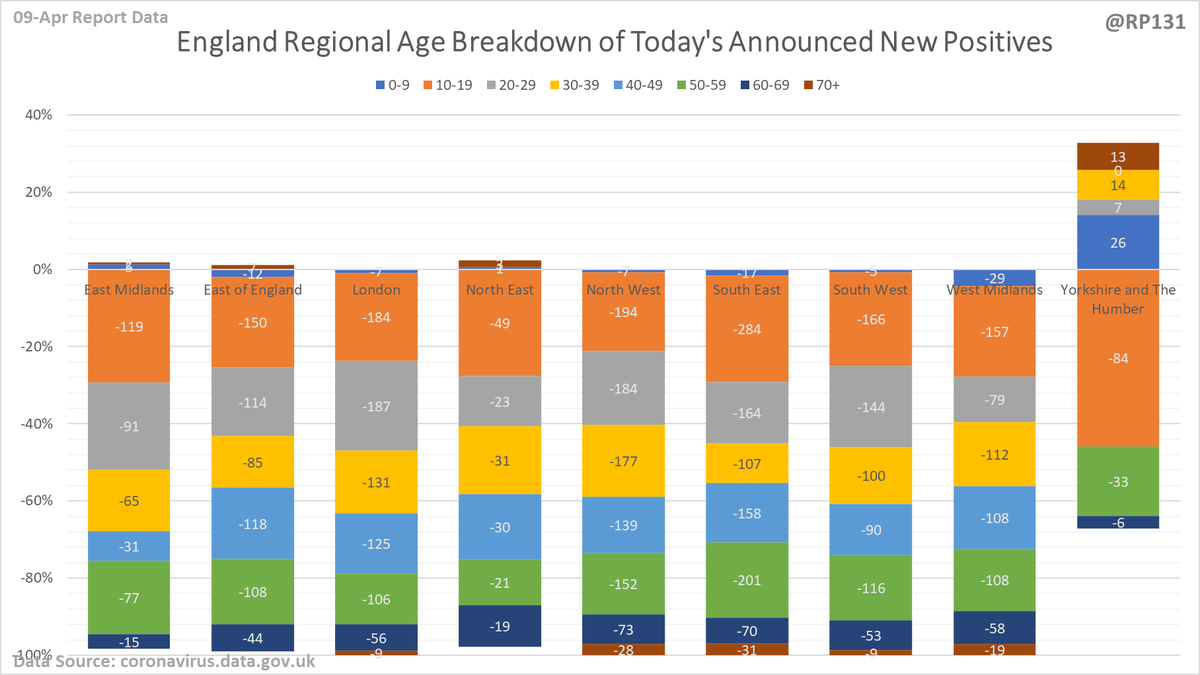
(Broken today by adjustment to remove negative confirmation of LDF) Regional / age distribution of today& #39;s newly announced positives for England.
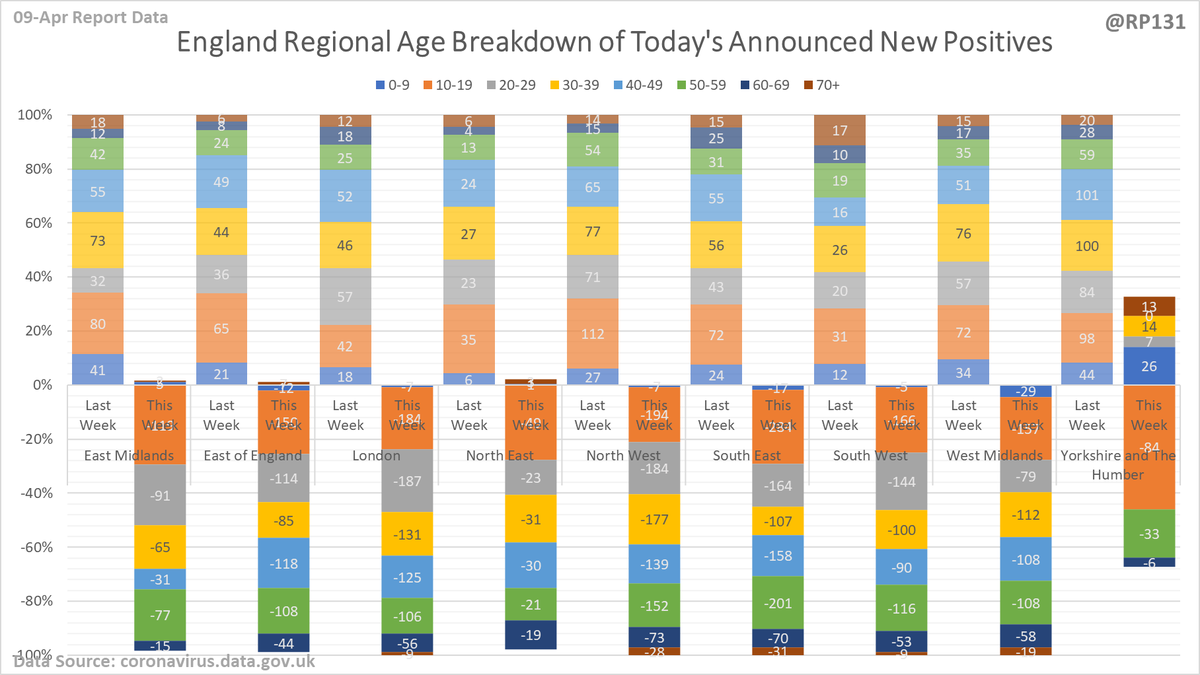
(Broken today by adjustment to remove negative confirmation of LDF) Plus to see how it& #39;s shifting, here& #39;s the same values but with the same day last week for comparison:
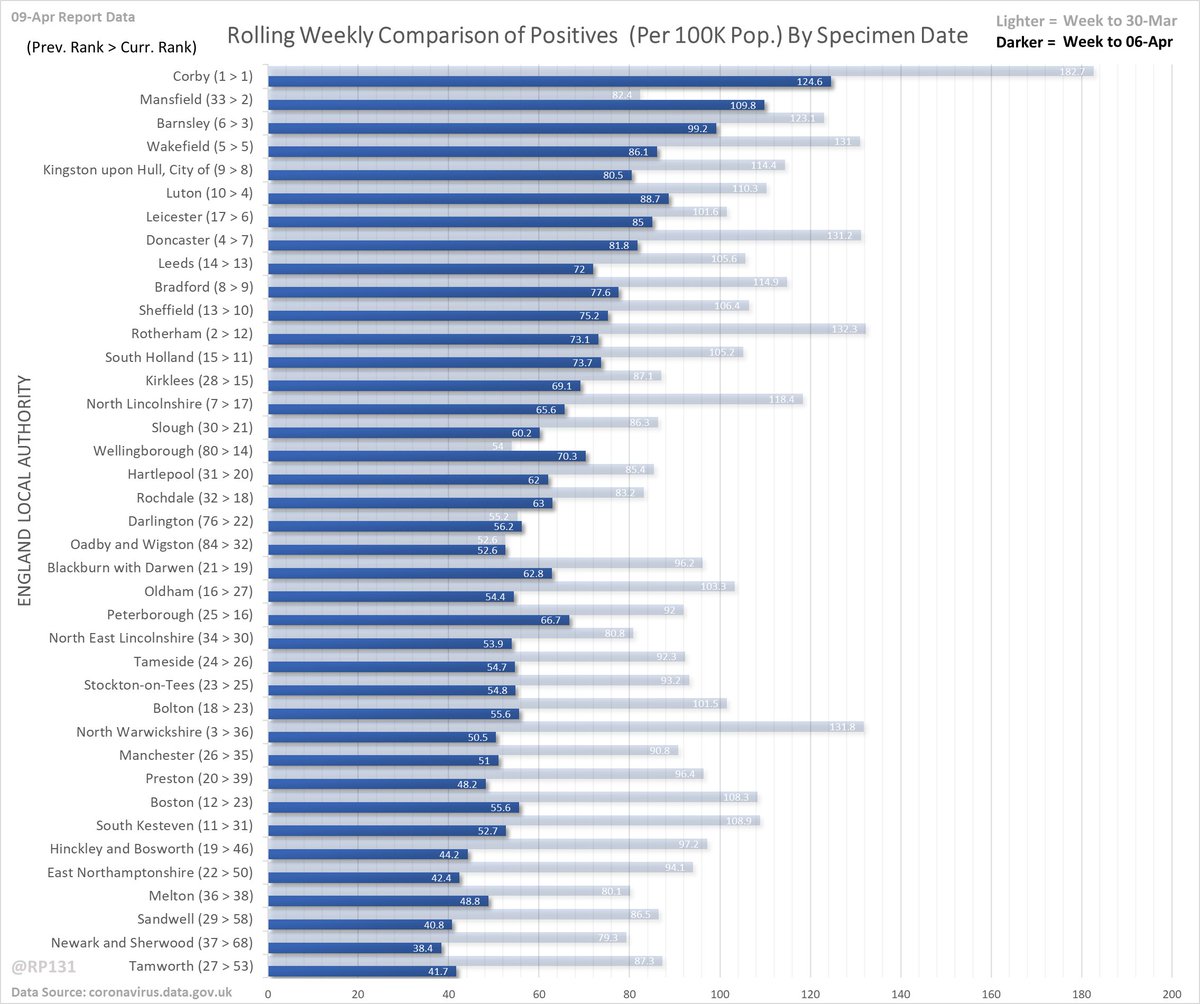
Rolling weekly comparison of totals up to 3 days ago. I think these have mainly been superseded by the bubble charts but keeping them as I know a few people still like them.
Full version of these LA compare charts here:
Weekly (Rates): …https://coviddatashare.s3-eu-west-1.amazonaws.com/Week_20210409.html
Weekly">https://coviddatashare.s3-eu-west-1.amazonaws.com/Week_2021... (Actual): …https://coviddatashare.s3-eu-west-1.amazonaws.com/WeekActual_20210409.html
Daily">https://coviddatashare.s3-eu-west-1.amazonaws.com/WeekActua... (7 Day Avg Rates): …https://coviddatashare.s3-eu-west-1.amazonaws.com/Day_20210409.html">https://coviddatashare.s3-eu-west-1.amazonaws.com/Day_20210...

 Read on Twitter
