$TRY | @TRY_finance | Technical Analysis
Quite a few people have recommended this project to me. Today lets have a look at the chart and see what it is telling us.
(1/6)
Quite a few people have recommended this project to me. Today lets have a look at the chart and see what it is telling us.
(1/6)
| Medium Term |
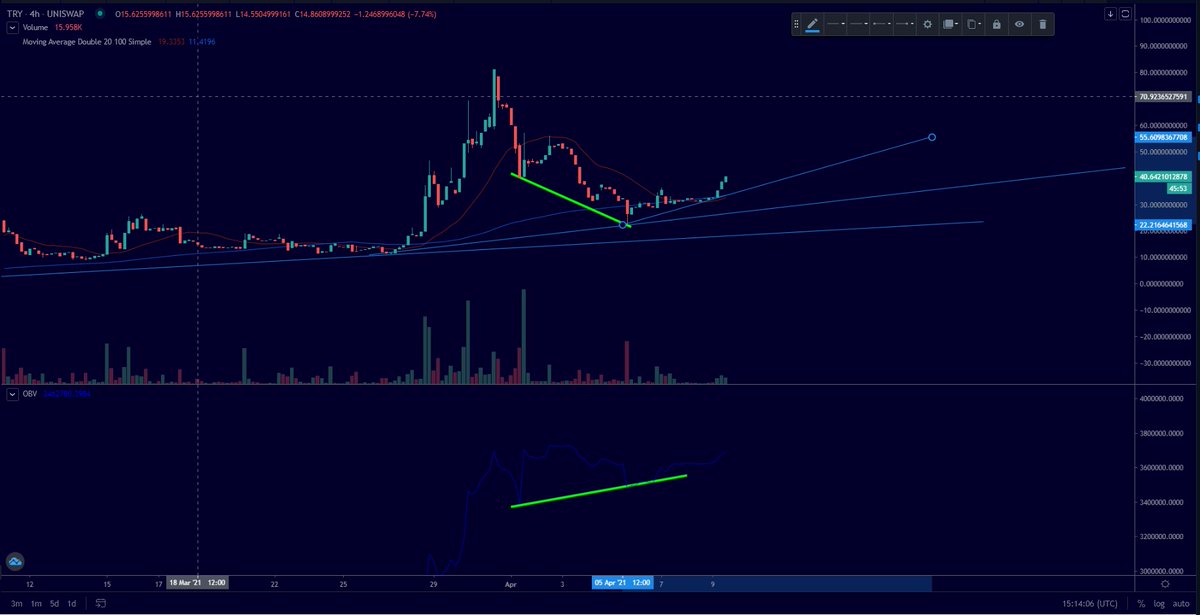
We can see that the price action is long term bullish. We are above the short and long moving averages and the price action is becoming more and more parabolic.
We had a nice pullback and test of support.
There& #39;s a strong demand zone at $30.
(2/6)
We can see that the price action is long term bullish. We are above the short and long moving averages and the price action is becoming more and more parabolic.
We had a nice pullback and test of support.
There& #39;s a strong demand zone at $30.
(2/6)
|MACD|
We have had a bullish cross on the MACD and we are having higher highs on the MACD histogram.
Current momentum is indeed up.
Bullish.
(3/6)
We have had a bullish cross on the MACD and we are having higher highs on the MACD histogram.
Current momentum is indeed up.
Bullish.
(3/6)
| On Balance Volume |
We had absolutely huge bullish divergence recently with the price action.
This shows us that the bulls were in control even during this recent dip and there& #39;s been strong buying volume all the way down.
(4/6)
We had absolutely huge bullish divergence recently with the price action.
This shows us that the bulls were in control even during this recent dip and there& #39;s been strong buying volume all the way down.
(4/6)
|Targets|
Overall I am very bullish looking at this chart. The pullback has provided a great buying opportunity.
Buy Zone: $33-$40
Target 1: $55
Target 2: $85
(5/6)
Overall I am very bullish looking at this chart. The pullback has provided a great buying opportunity.
Buy Zone: $33-$40
Target 1: $55
Target 2: $85
(5/6)
|Summary|
Overall I am bullish on this chart. I am considering having a deeper dive into its fundamentals and what the project is about.
If you want to see more on $TRY then leave a comment below telling me what makes you bullish about the project. https://abs.twimg.com/emoji/v2/... draggable="false" alt="📈" title="Tabelle mit Aufwärtstrend" aria-label="Emoji: Tabelle mit Aufwärtstrend">
(6/6)
Overall I am bullish on this chart. I am considering having a deeper dive into its fundamentals and what the project is about.
If you want to see more on $TRY then leave a comment below telling me what makes you bullish about the project.
(6/6)

 Read on Twitter


