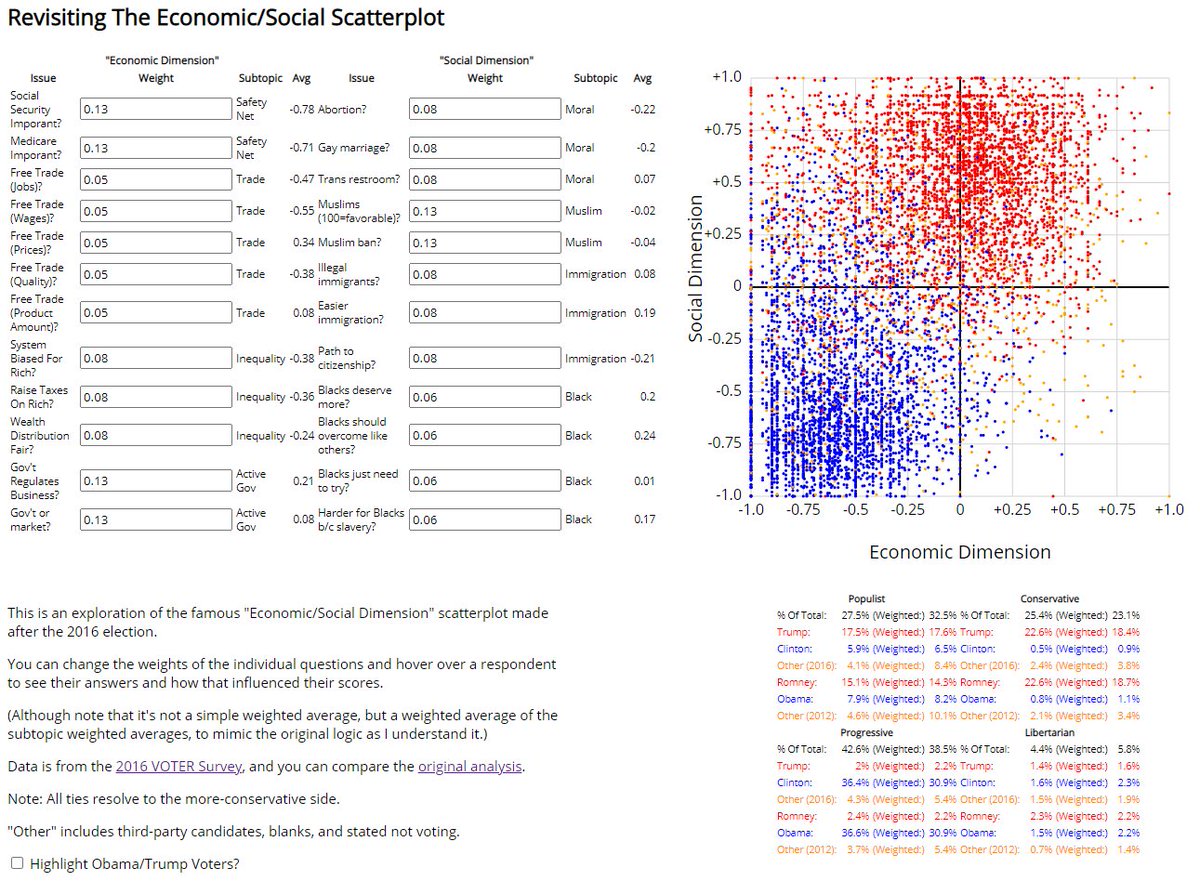
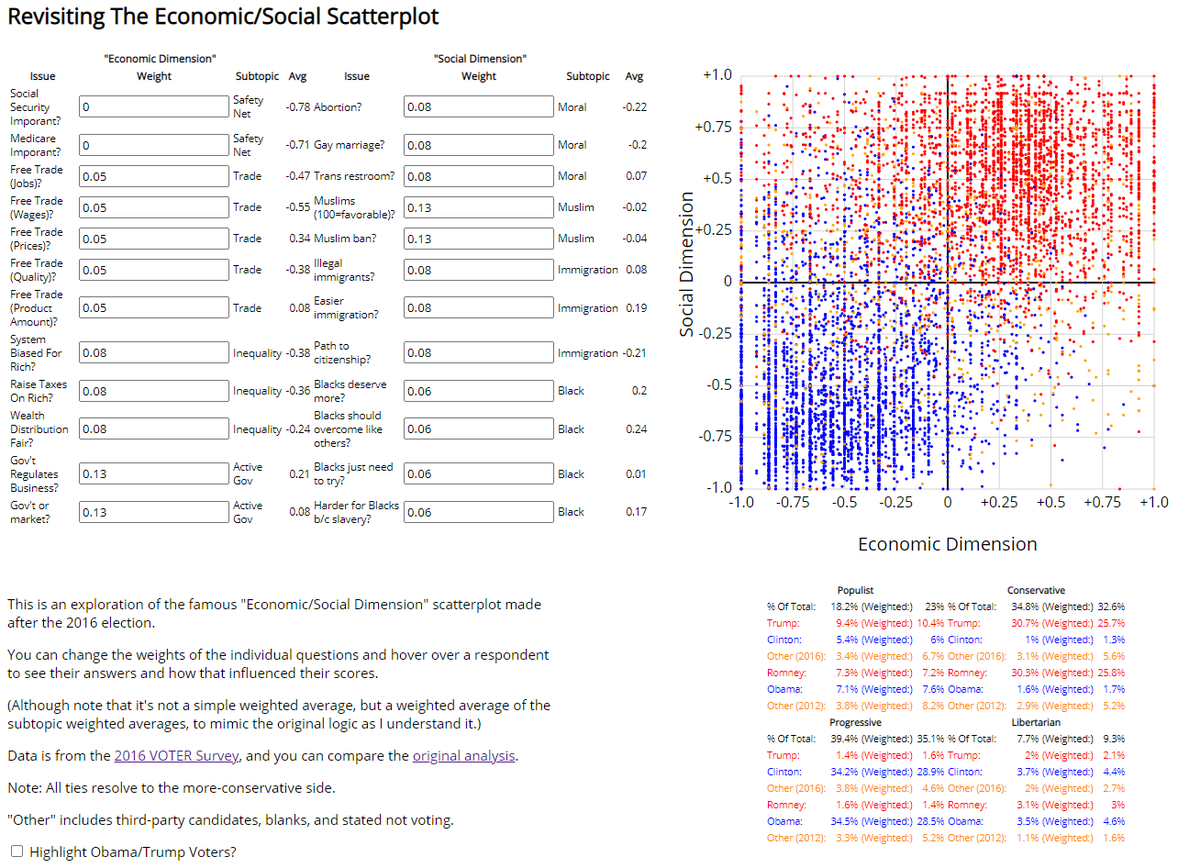
New post on revisiting the famous post-2016 "economic issues vs. social issues" scatterplot. https://medium.com/@xenocryptsite/revisiting-the-famous-2016-economic-views-vs-social-views-scatterplot-55016c1b8888">https://medium.com/@xenocryp...
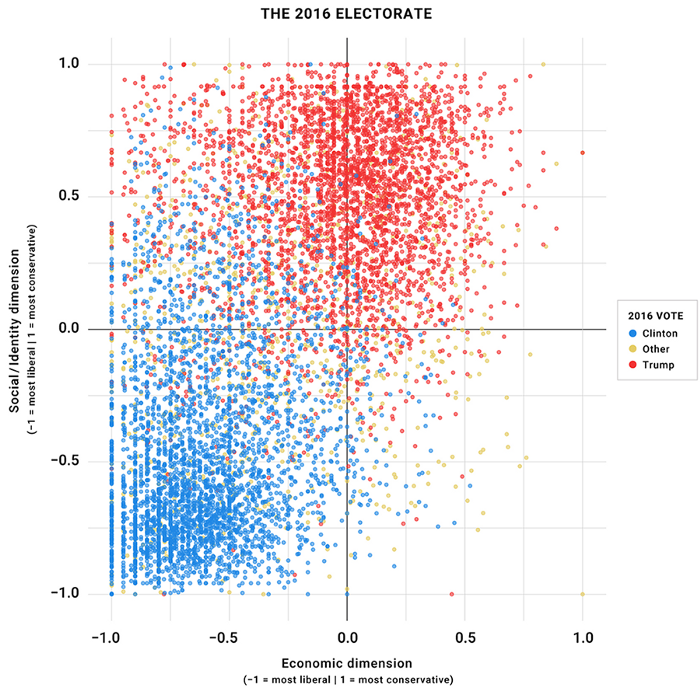
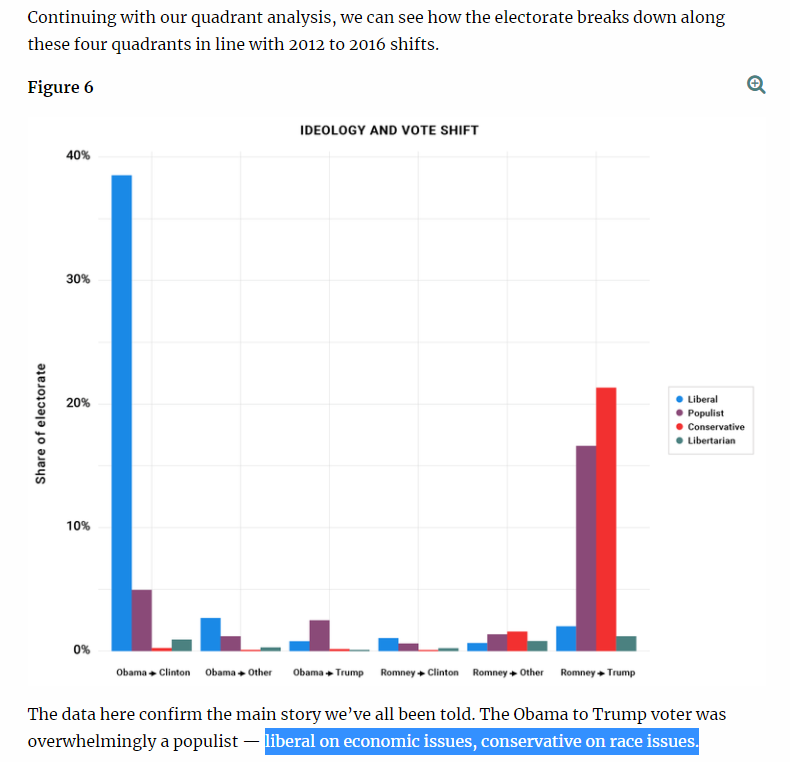
You have probably seen this chart over the last four years. I like it, and the analysis it& #39;s from! But what I don& #39;t like is how, because the chart itself is not very annotated, people can and do read whatever they want into it.
Like you& #39;ll see people say, I don& #39;t know, "Democrats lose because of pronouns, and my proof is, this chart". The chart does not have anything to do with pronouns, but it IS a chart.
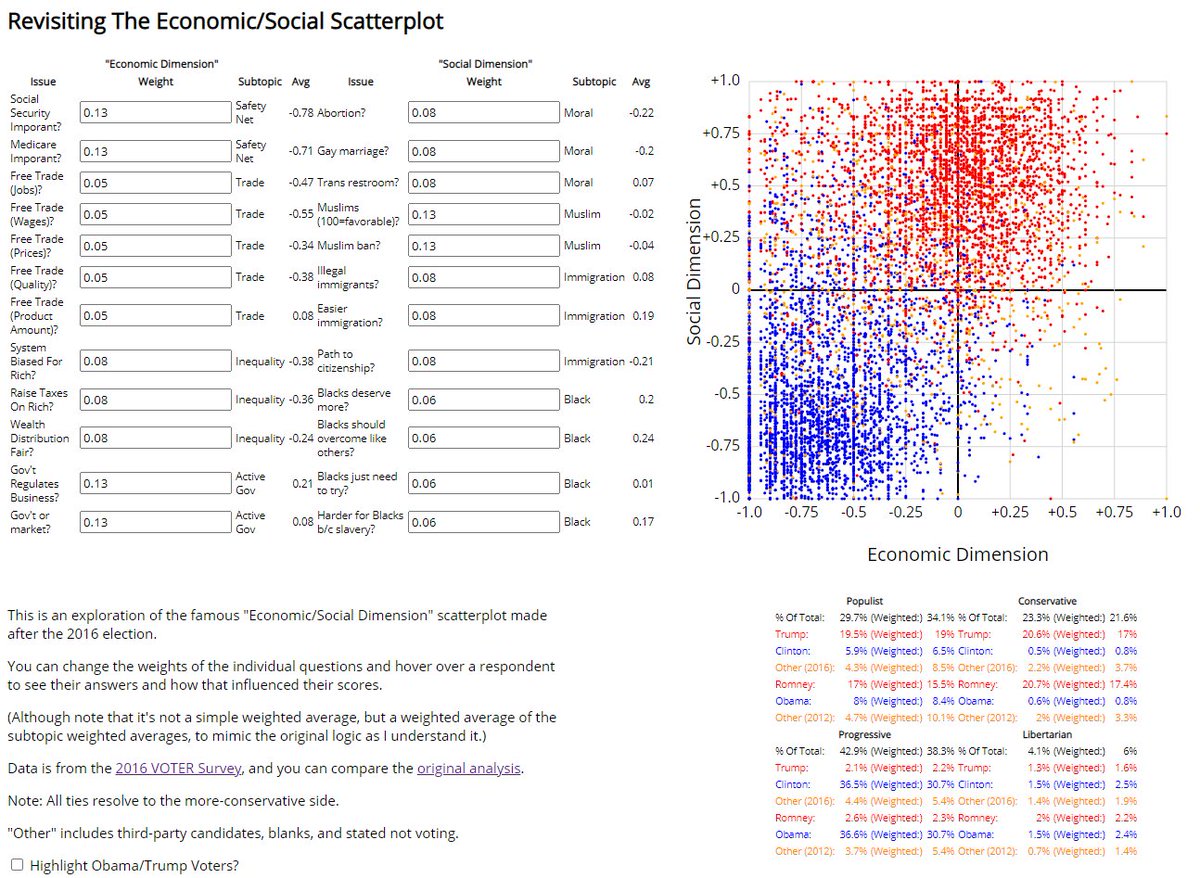
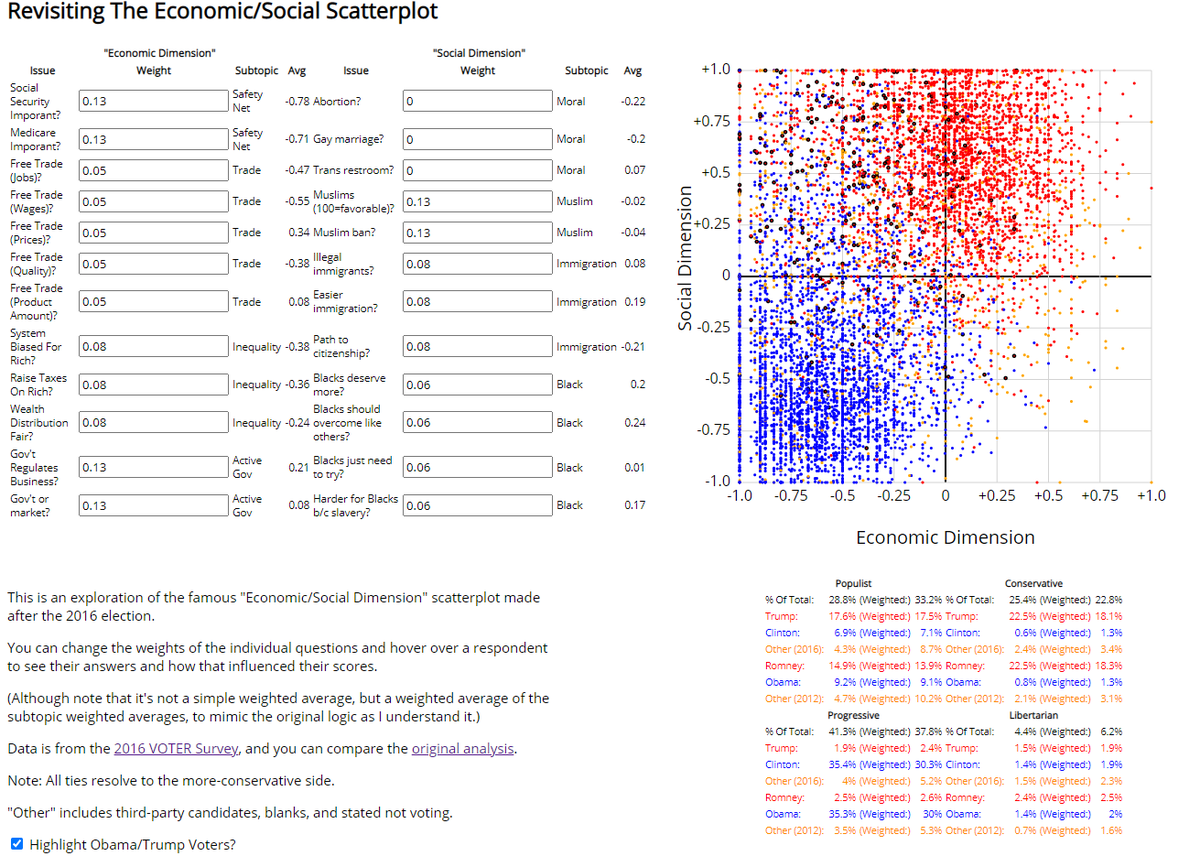
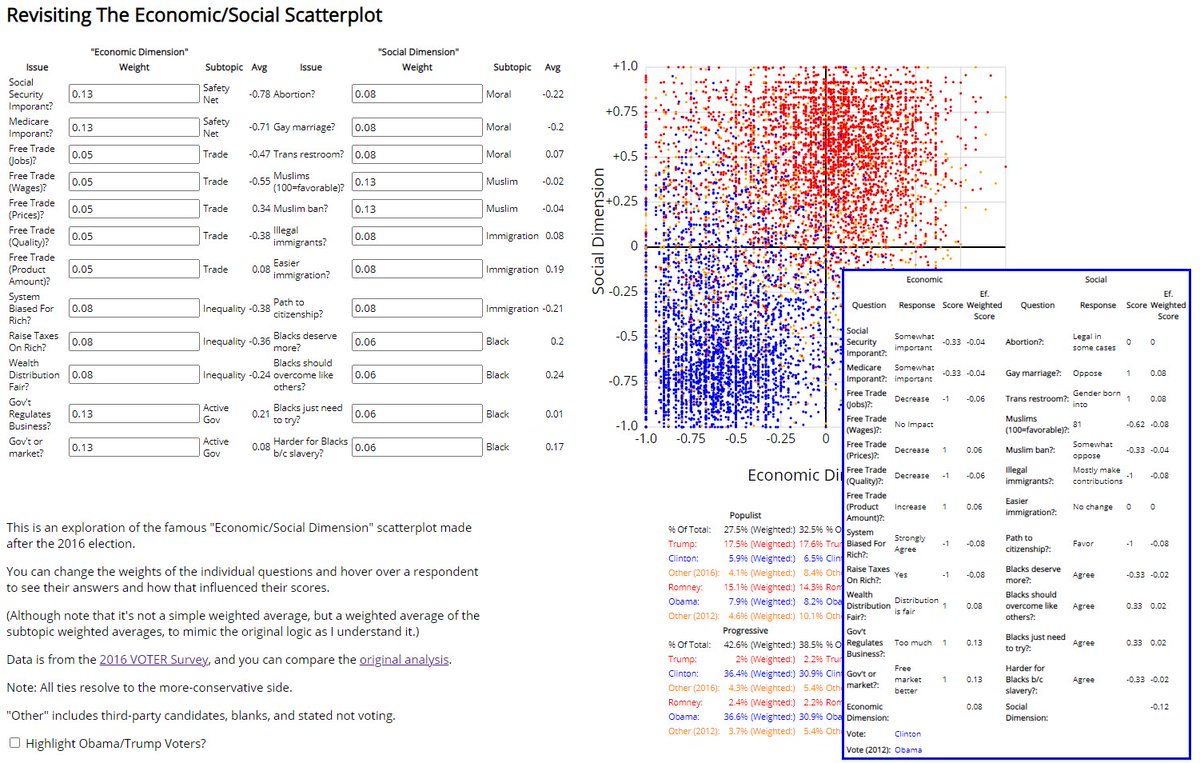
So I thought, what do I wish this chart had, visually? Well, I& #39;d like it to show the individual questions that went into each dimension, and their implicit weights. Since the data is nicely public, you can see my attempt here: http://xenocrypt.github.io/voter_graph_weights.html">https://xenocrypt.github.io/voter_gra...
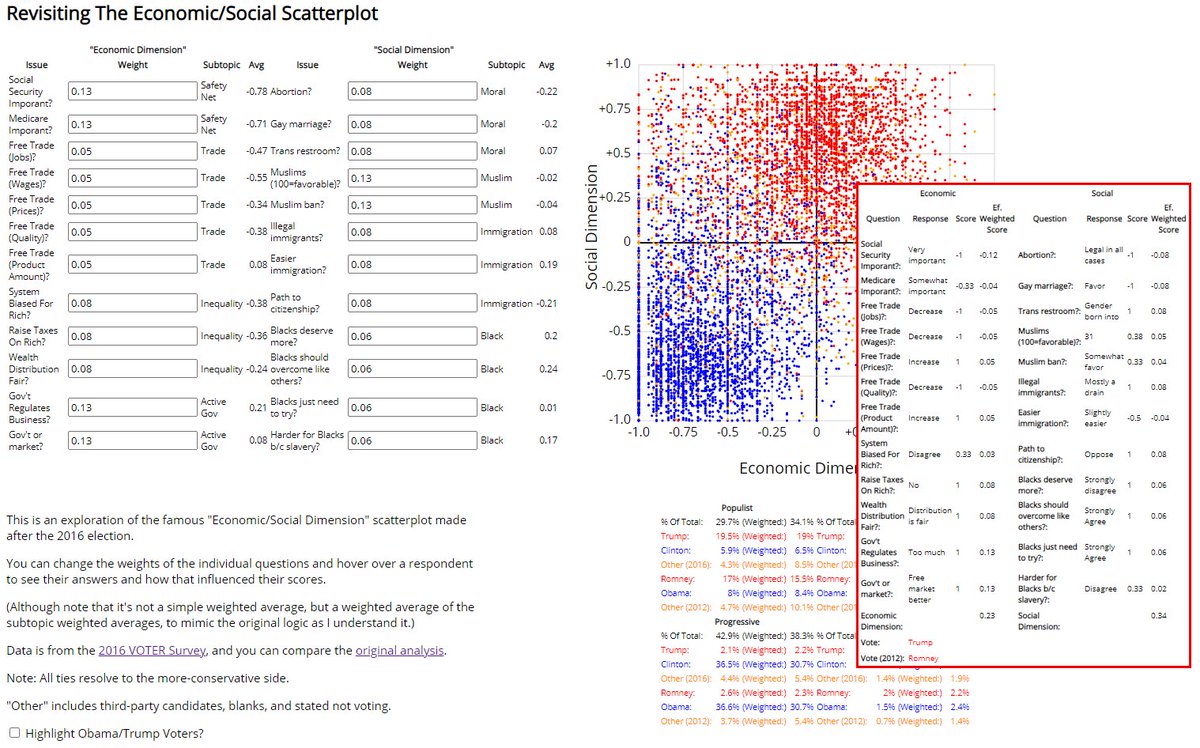
And since one thing I like about the original chart is how it includes one dot for every respondent (I& #39;m a strong believer in "show the most granular data you have"), why not go farther, and allow you to see every respondent& #39;s answers in the visual as well.
In terms of conclusions, one thing that the original article is a little clearer on than the graph itself is that the y-axis is really a bit more of a RACIAL ISSUES dimension than a "social issues" dimension, although TBH it& #39;s all pretty correlated.
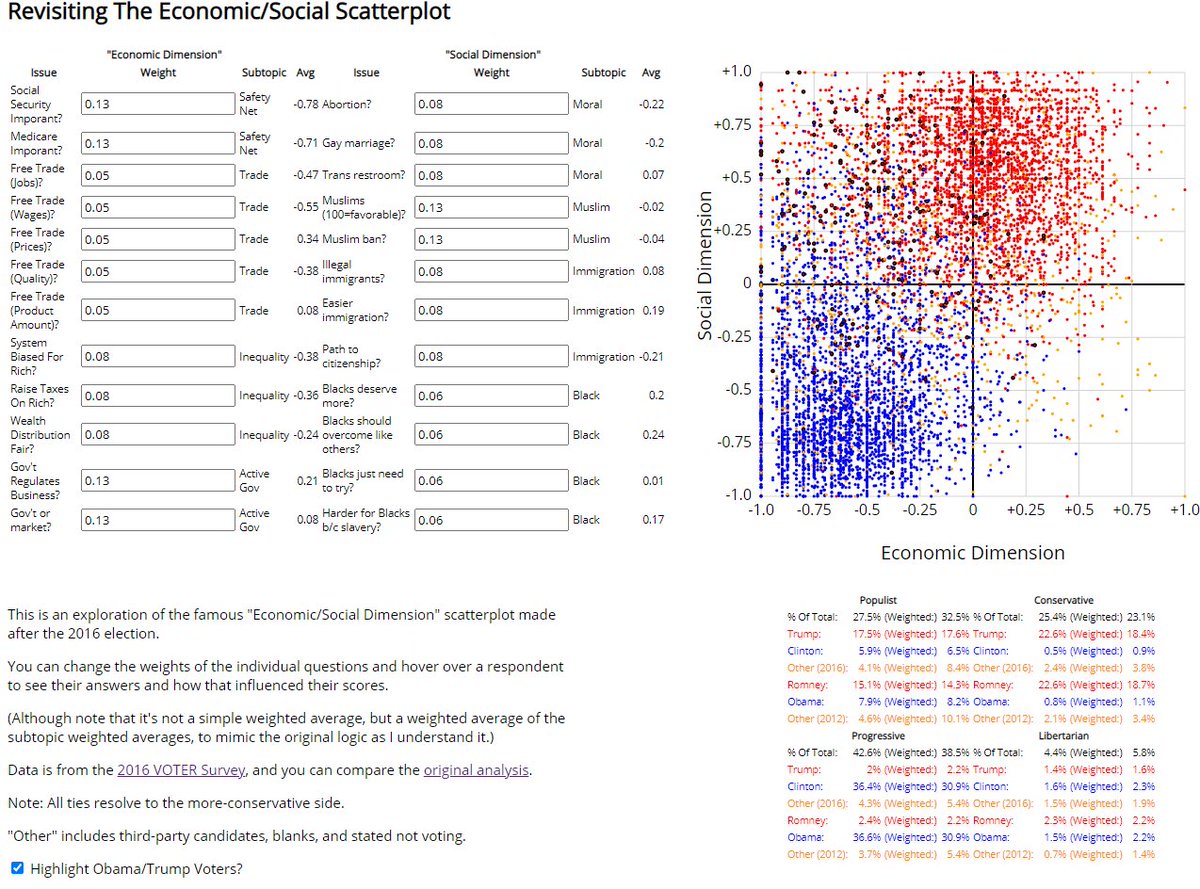
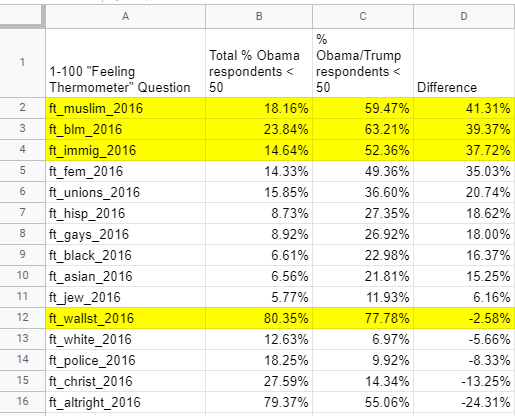
And in particular, I think you really want to emphasize racial/immigration issues when it comes to predicting Obama/Trump voters. If you zero out the weights of the "purely social" issues, then I actually have the "populist" quadrant becoming a bit MORE Obama/Trump-y.
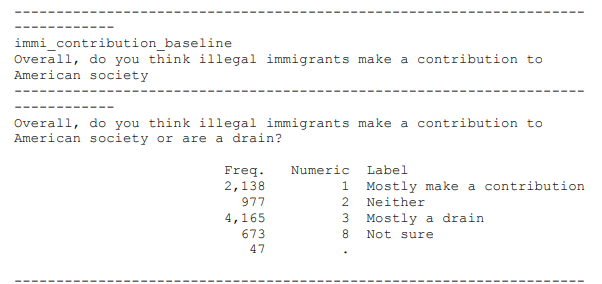
EG, two-thirds of the (eventual) Obama/Trump respondents answered that "illegal immigrants were mostly a drain" in the 2011 (!) wave of the survey, a much higher rate than the other Obama voters at the time.
Again I don& #39;t think I& #39;m saying too much that the original article didn& #39;t ("populist — liberal on economic issues, conservative on race issues"). But I do wish that had made it into the much-shared scatterplot.
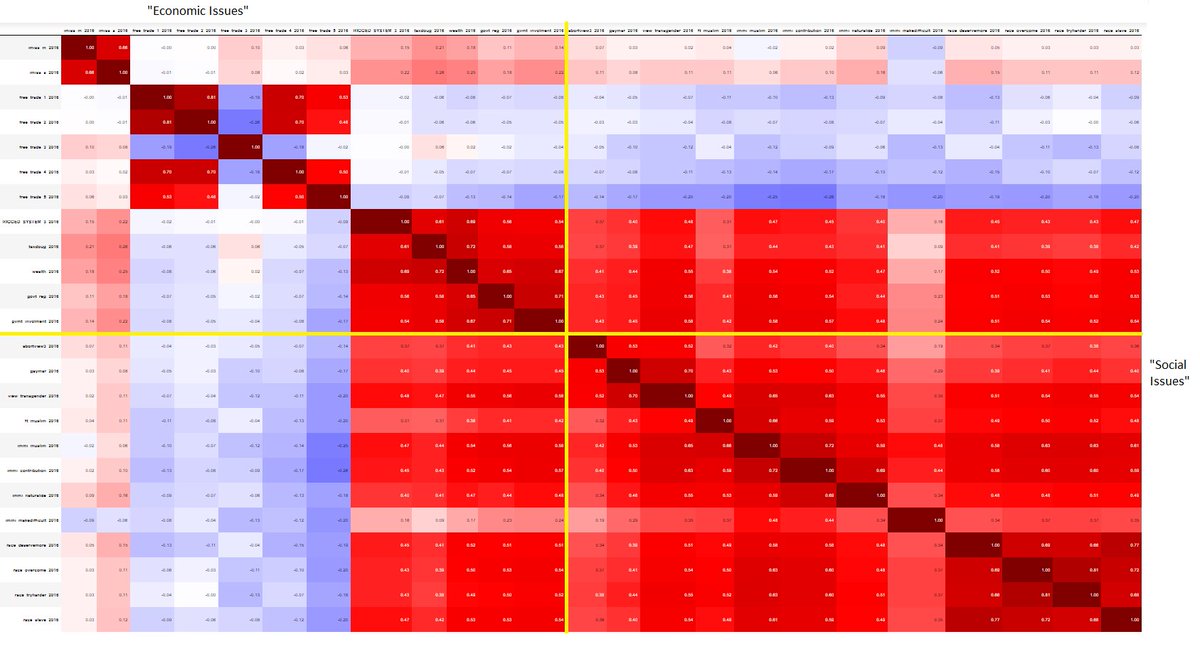
(I couldn& #39;t get this formatted to a point where I wanted it in the main article, but if you, like me, would ask "just show us the correlation matrix", here you go. Although remember that "correlation" is not quite the same as "goodness-of-fit-into-a-dimensionality-model".)
(Please don& #39;t ask me about "free trade question 3". It was about whether free trade agreements raise or lower prices. You& #39;d think "raise" would be "anti-trade" and "lower" would be "pro-trade" but most people answered "raise/lower prices" and "raise/lower wages" the same...)
...so it& #39;s like, you can score it the "logical way" or score it the "way people seem to be responding", and I eventually went with the former, although it was back and forth.
So anyway, you can see individual respondents are not always what the "popular interpretation" of the quadrants would suggest. Like this person in the "economic conservative/social liberal quadrant" is probably more like "a social conservative who likes Muslims and immigrants".
Ooh other people are going to play with the microdata :-)
And probably make better stuff than I ever could :-(
And probably make better stuff than I ever could :-(
I agree that counterfactuals are difficult and untangling how much "racial" and "immigration" questions "really measure" those issues as opposed to underlying attitudes is difficult... https://twitter.com/TNG512/status/1380189117972029440">https://twitter.com/TNG512/st...
Narrowly, I think that, if you have this dataset, and you attempt "predict Obama/Trump respondents, from the pool of Obama respondents, given the 2011 wave questions", then you& #39;re going to give the immigration and race questions a lot of weight, like, just their F1 scores or w/e.
Not the ONLY questions with predictive power, but IMO it& #39;s hard not to see that much.
ICYMI...where "it" is...all that...

 Read on Twitter