1. This week in Ag Data News, prices are high, but it seems like farmers aren& #39;t planning a big increase in planting. https://asmith.ucdavis.edu/news/planting ">https://asmith.ucdavis.edu/news/plan...
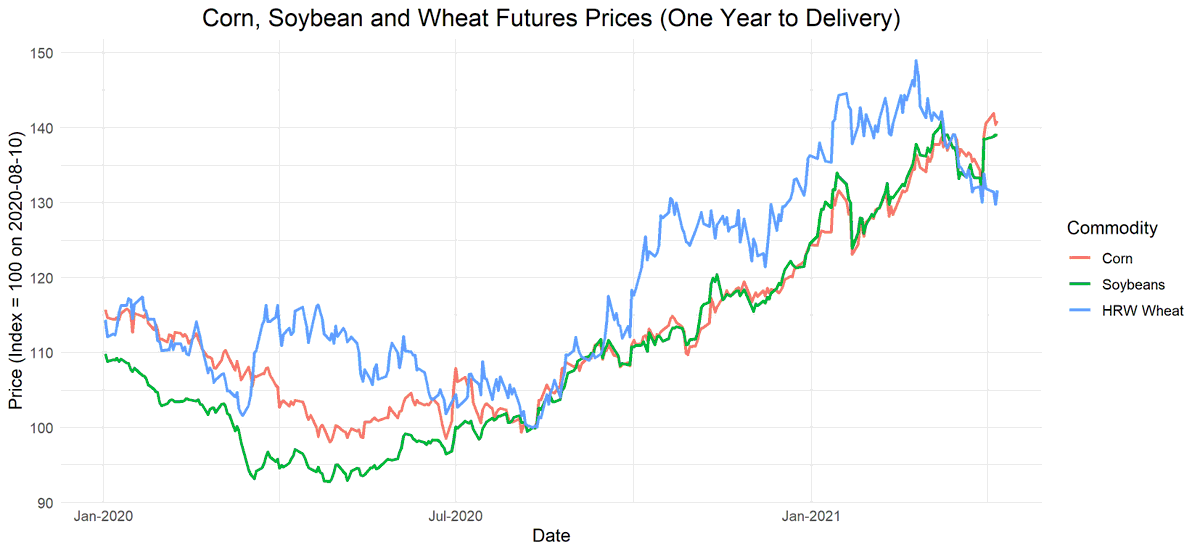
2. Futures prices of corn, soybeans, and wheat increased by about 35% from August 2020 to February 2021. This increase mostly reflects increasing demand, notably from China for corn and soybeans, as I discussed in a previous Ag Data News article. https://asmith.ucdavis.edu/news/good-times-down-farm">https://asmith.ucdavis.edu/news/good...
3. So, how much would we expect planted acreage to increase in response to these price increases? In economist-speak, what is the supply elasticity?
4. The right answer is "there& #39;s no such thing as THE supply elasticity". There are lots of different elasticities depending on changes in the prices of other crops and production costs, or the length of time we give farmers to respond.
5. A relevant elasticity can be found in this paper by Roberts and Schlenker. They estimate that US corn, soybean, wheat, and rice production increases by 0.3% for every 1% increase in a price index of those commodities (see Panel B of their Table 3). https://www.aeaweb.org/articles?id=10.1257/aer.103.6.2265">https://www.aeaweb.org/articles...
6. This is the relevant analysis for 2021 because all prices have increased, rather than only one price increasing. Using this elasticity, a 35% price https://abs.twimg.com/emoji/v2/... draggable="false" alt="⬆️" title="Pfeil nach oben" aria-label="Emoji: Pfeil nach oben"> portends a 10.5%
  https://abs.twimg.com/emoji/v2/... draggable="false" alt="⬆️" title="Pfeil nach oben" aria-label="Emoji: Pfeil nach oben">.
Students in my ARE 231 class have replicated this estimate using updated data.
https://files.asmith.ucdavis.edu/PaperAssignment-Global.pdf">https://files.asmith.ucdavis.edu/PaperAssi...
Students in my ARE 231 class have replicated this estimate using updated data.
https://files.asmith.ucdavis.edu/PaperAssignment-Global.pdf">https://files.asmith.ucdavis.edu/PaperAssi...
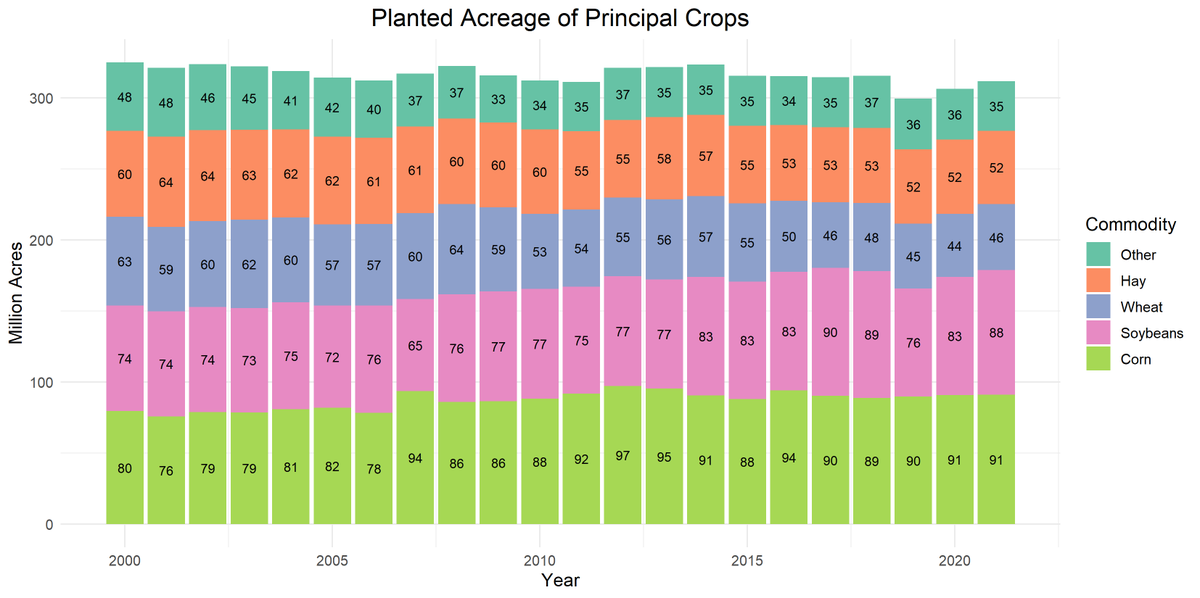
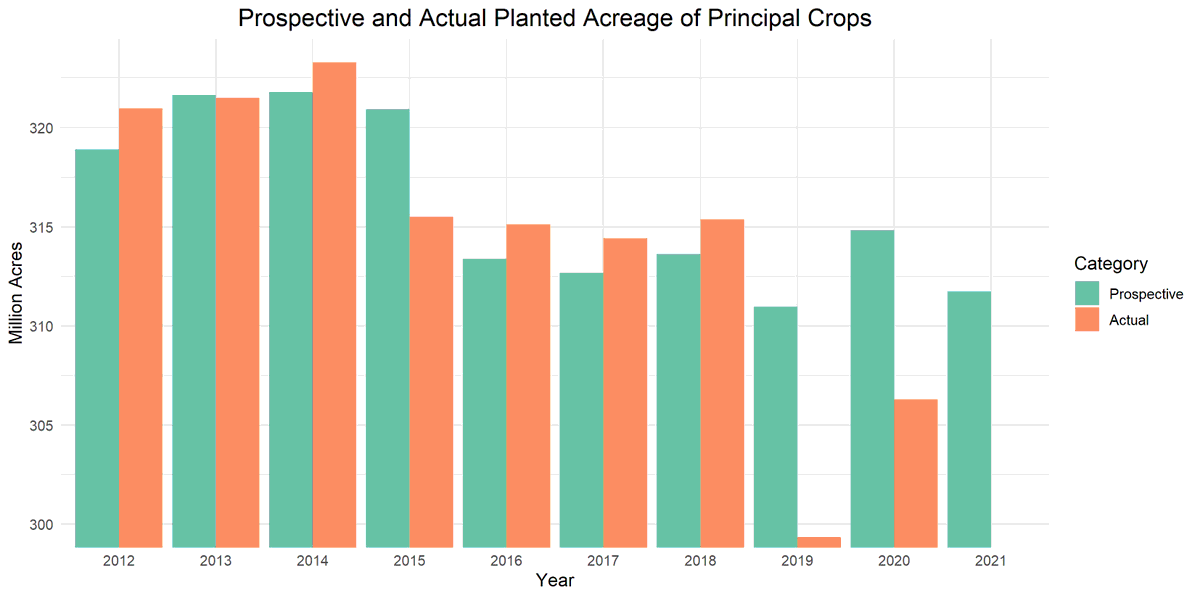
7. Farmers planted 218m acres of corn, wheat, and soybeans in 2020. A 10.5% increase would imply 23m more acres. Instead, USDA& #39;s projection, which is based on farmer surveys, predicts an increase of 7m acres: 5m in soybeans, 2m in wheat, and essentially no increase in corn.
8. Principal crops are basically things we don& #39;t grow in California (I kid). Specifically: corn, soybeans, hay, wheat, sorghum, oats, barley, rye, rice, peanuts, sunflower, cotton, dry edible beans, chickpeas, potatoes, sugarbeets, canola, proso millet, tobacco, and sugarcane.
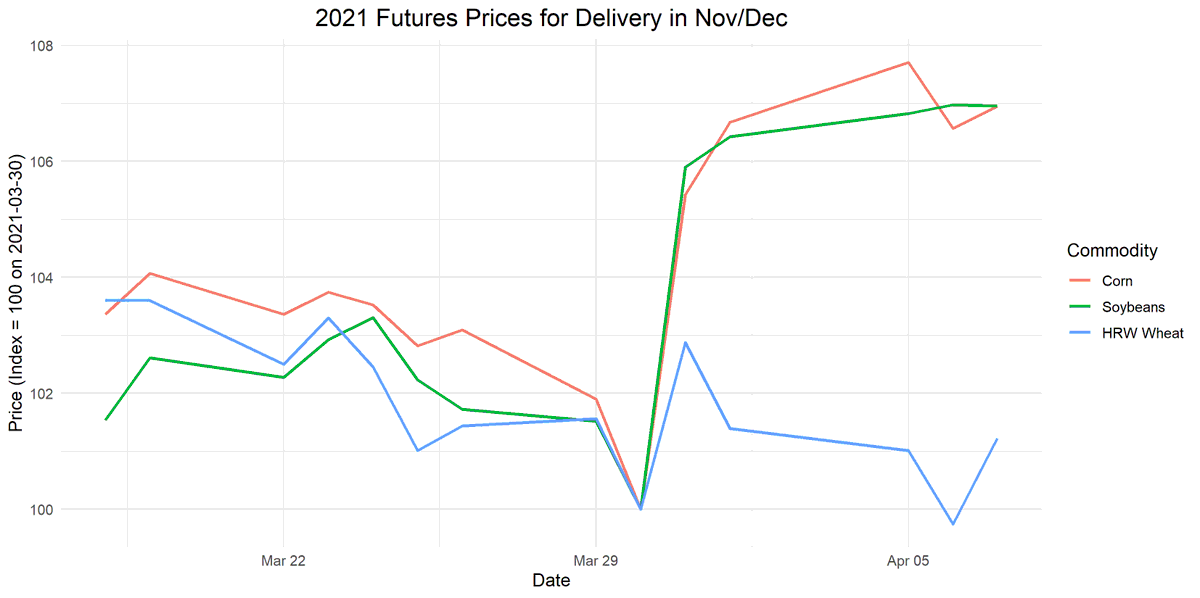
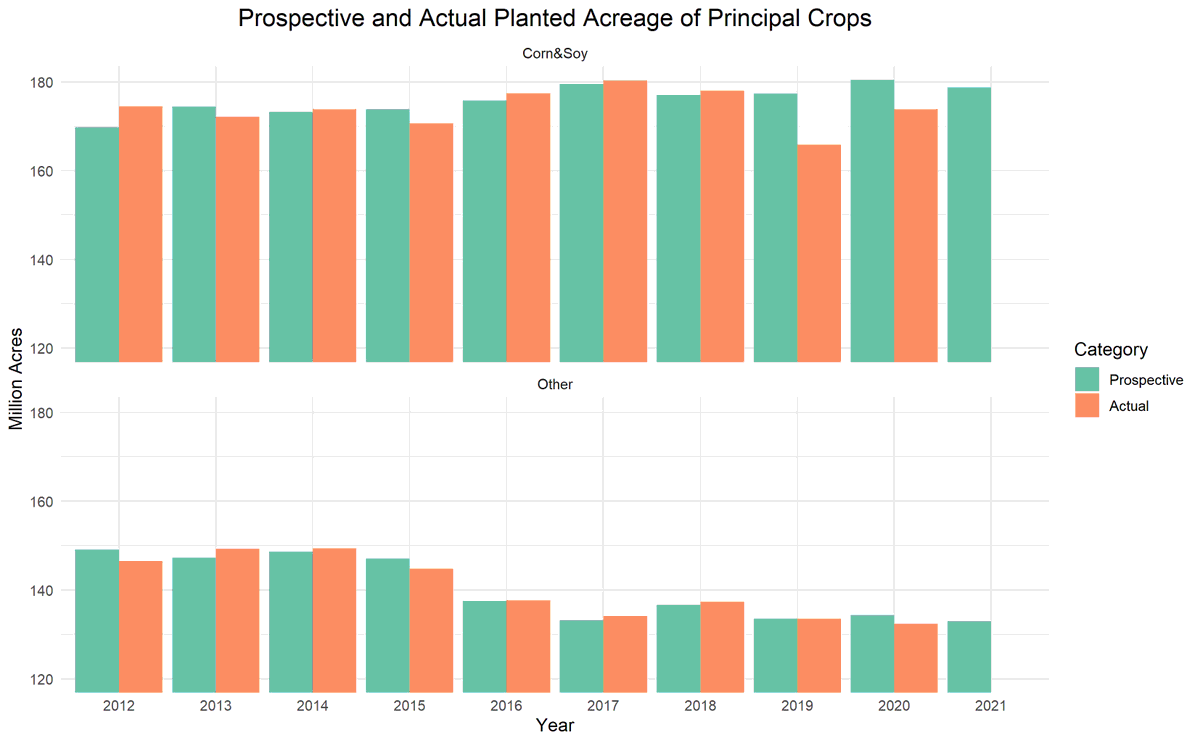
9. Futures markets were surprised by the prospective planting report. Corn and soybean prices jumped by 6% on the report day (March 31). These price jumps indicate that the supply response is insufficient to meet demand, but they are small in comparison to the lack of acreage.
10. Perhaps farmers are lying on the survey or the survey sample is not representative. However, USDA does not systematically under-estimate actual planted acreage. The over-estimated in 2019/20 due to high rainfall that prevented planned planting.
11. Corn and soybeans make up about 60% of principal crop acres and tend to have larger projection errors than the other principal crops. Most of the prevented planting acres in 2019 and 2020 were corn and soybeans.
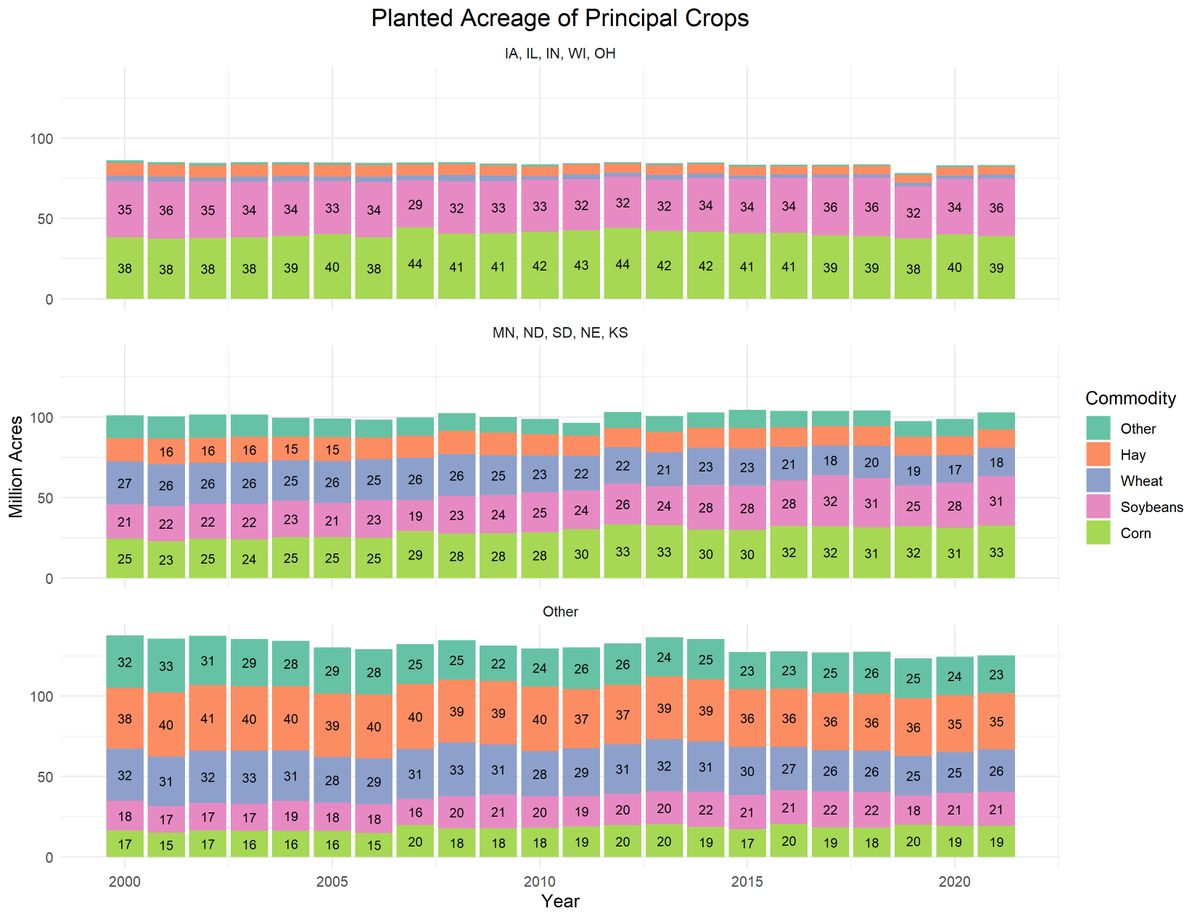
12. The projected acreage changes differ across states. In the cornbelt states, which I define here as IA, IL, IN, WI, MI, and OH, corn and soybeans dominate. There isn& #39;t much scope to increase corn and soybean acres in these states.
13. The Great Plains states (plus Minnesota) have more scope for corn, soybean, and wheat expansion and accordingly project an extra 6m bushels of these commodities in 2021, or about an 8% increase.
14. This outcome mimics the findings of Nick Pates and @nphendricks, who show using satellite data that farmers in this region respond much more to price changes than those in the central cornbelt. https://onlinelibrary.wiley.com/doi/full/10.1111/ajae.12208">https://onlinelibrary.wiley.com/doi/full/...
15. So, why aren& #39;t farmers planning to plant more principal crops this year, especially corn, soybeans and wheat?
16. A partial answer is that costs have increased. Fertilizer prices are up 20-30% this year and oil prices are up 50% since November. These factors account for a quarter of the value of the crop. This reduces the acreage response (see article for details.)
17. Past years show no indication of systematic errors in the prospective planting report, but maybe this is the year. I expect final acreage to come in above the number in this report, perhaps from areas outside the central cornbelt and great plains. https://asmith.ucdavis.edu/news/planting ">https://asmith.ucdavis.edu/news/plan...
18. I generated the graphs in this article using this R code. https://files.asmith.ucdavis.edu/planting.R ">https://files.asmith.ucdavis.edu/planting....

 Read on Twitter