Excited to share thesis: Socioeconomic inequalities in multimorbidity and joint associations with mortality in a general population. @theHUNTstudy
https://hdl.handle.net/11250/2735980 ">https://hdl.handle.net/11250/273...
#socialepi #sdoh #multimorbidity #frailty #publichealth @NTNU_ISM @ANUmedia https://abs.twimg.com/emoji/v2/... draggable="false" alt="🧵" title="Thread" aria-label="Emoji: Thread">(12+thanks)
https://hdl.handle.net/11250/2735980 ">https://hdl.handle.net/11250/273...
#socialepi #sdoh #multimorbidity #frailty #publichealth @NTNU_ISM @ANUmedia
Multimorbidity(MM), the co-occurrence of multiple, chronic conditions, where none is more central, is the norm worldwide. MM challenges the person and clinicians in a fragmented healthcare system, aided by single disease guidelines. #medtwitter https://soundcloud.com/bmjpodcasts/why-we-are-failing-patients-with-multimorbidity">https://soundcloud.com/bmjpodcas...
Complexity in MM vary and relate to conditions, individual & social context. I aimed to investigate clinically relevant measures of MM and how socioeconomic position (SEP), a known complicating context, related to these in prevalence distribution and joint impact on mortality.
I studied a Norwegian population cohort of 40000 people, 25 to 100 y.o., representative for western high-income countries. They were grouped in high/middle/low socioeconomic position based on occupation (European Socio-economic Classification, doi:10.1080/14616690701336518)
I studied 7 measures of MM created from 51 individual conditions (27 diagnoses, 21 symptoms, 3 risk factors), grouped in 14 organ systems. 2 measures included #frailty, created from 4 self-reported impairments (general, physical, mental and social).
I studied socioeconomic distribution of MM as: 3+ individual conditions; 3+ organ groups; 2+ ind. cond. & 1+ frailty; and 3+ ind. cond. & 2+ frailty.
I studied joint impact on mortality using: combined MM&SEP-measures, and continuous individual and organ group count.
I studied joint impact on mortality using: combined MM&SEP-measures, and continuous individual and organ group count.
I found that even in this general population, complex measures of multimorbidity were common, increases with age, but most are younger than 65 yr. There are socioeconomic inequalities in prevalence in 30 to 75+ y.o.. Graph in next tweet..
Unique to compare socioeconomic distribution of 4 MM measures in 1 sample. Estimated prevalence (y-axis, %) with 95% CIs (shaded) by age (x-axis) and socioeconomic position for women. Abbreviations, see tweet 6. Red/blue/grey indicate low/middle/high SEP. Men had similar trends.
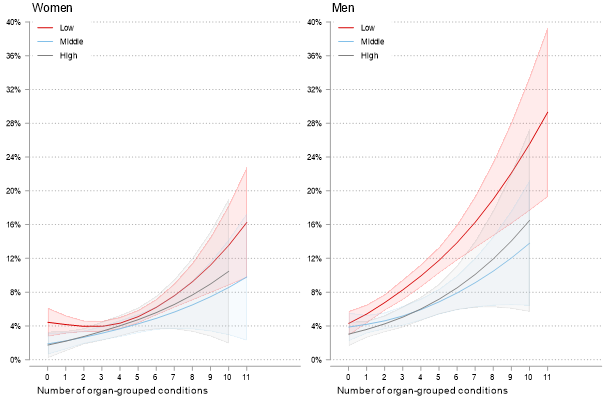
There are socioec. inequalities in mortality across all MM. Here, association between increasing no. organ groups, SEP & risk of death after 10 yr. @60 y.o. Y-axis, estimated mortality (%), further explanatory details in graph. Men in lower SEP stands out.
Negative, deadly spiral of socioec position & multimorbidity, implies continuous need for public policy & public health to prevent socioec. health inequalities.
@BentHHoyre @MinaGerhardesn @Nf_folkehelsen @ingvildkjerkol @NickWilki @BeritMortensen2 @KToppe @AshildBg @carlegrim
@BentHHoyre @MinaGerhardesn @Nf_folkehelsen @ingvildkjerkol @NickWilki @BeritMortensen2 @KToppe @AshildBg @carlegrim
Magnitude of multimorbidity in all ages, suggests a generalist, person-centered clinical approach, incl. SEP. Health care organizational structure, treatment guidelines & medical education should reflect this needed approach.
@HelseMidtNorge @NTNUhelse @NTNU_CAME @ANUMedSchool
@HelseMidtNorge @NTNUhelse @NTNU_CAME @ANUMedSchool
In Norway, assigned family doctors uniquely offer continuous, generalist & person-centered care, known to reduce illness, mortality & be cost effective (B. Starfield). This arrangement should be kept high in priority.
@legeforeningen @fastlegen_no @Tronderopproret
@legeforeningen @fastlegen_no @Tronderopproret
Thread for articles on socioeconomic inequalities in prevalence of MM https://twitter.com/KHVinjerui/status/1272822249108779015?s=20">https://twitter.com/KHVinjeru...
Thread for article joint impact of socioeconomic position and multimorbidity on mortality https://twitter.com/KHVinjerui/status/1299101718739812353?s=20">https://twitter.com/KHVinjeru...
Massive thanks to supervisors and co-authors:
@Erik_R_Sund @jhbjorngaard @steinak @Dougalswords @BjerkesetOttar Pauline Boeckxstaens
@Erik_R_Sund @jhbjorngaard @steinak @Dougalswords @BjerkesetOttar Pauline Boeckxstaens
Greatly inspired by: @JMultimorbidity @knicholson_87 @linn_getz @MaggaOlafia
@stewmercer @sally_wyke @dremmawallace
@PHanlon17 @DLVetrano @ale_marengoni
@BhauteshJani @josemvalderas @LeoSinger_Lpool
Marjan van den Akker
@stewmercer @sally_wyke @dremmawallace
@PHanlon17 @DLVetrano @ale_marengoni
@BhauteshJani @josemvalderas @LeoSinger_Lpool
Marjan van den Akker

 Read on Twitter


