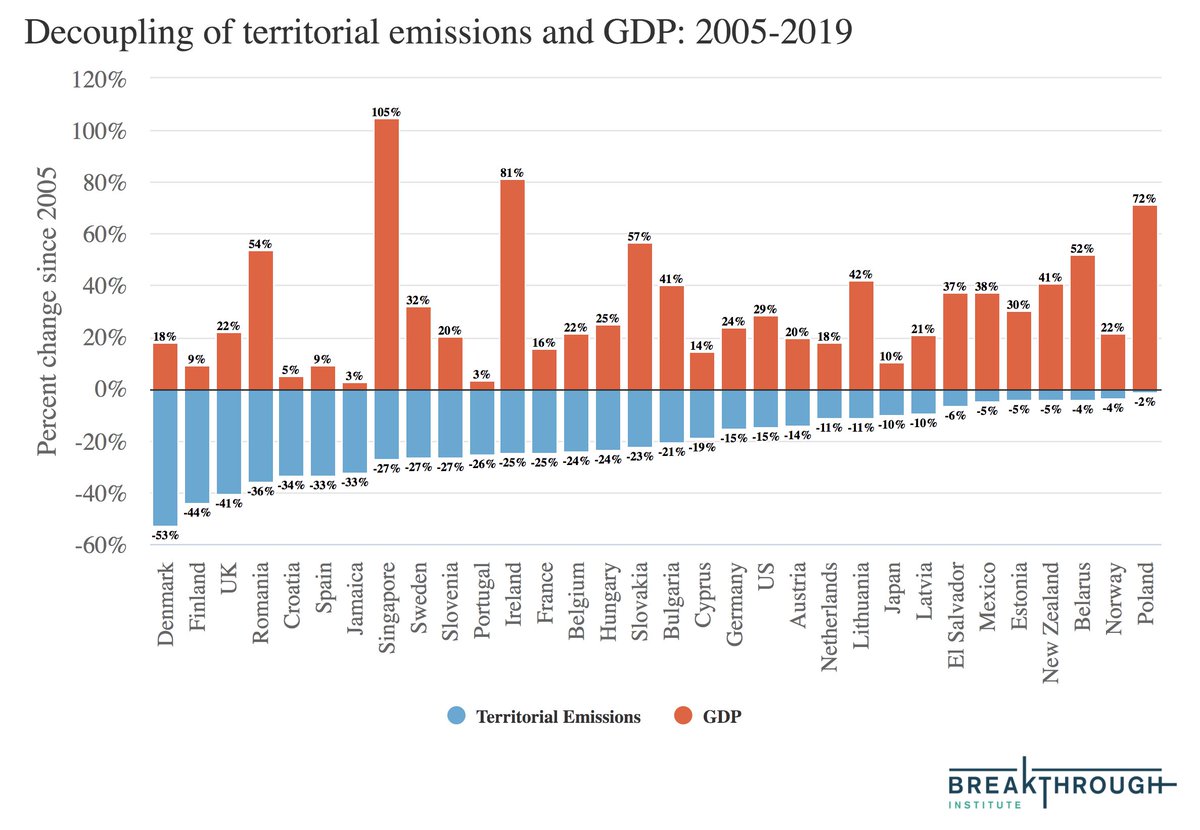
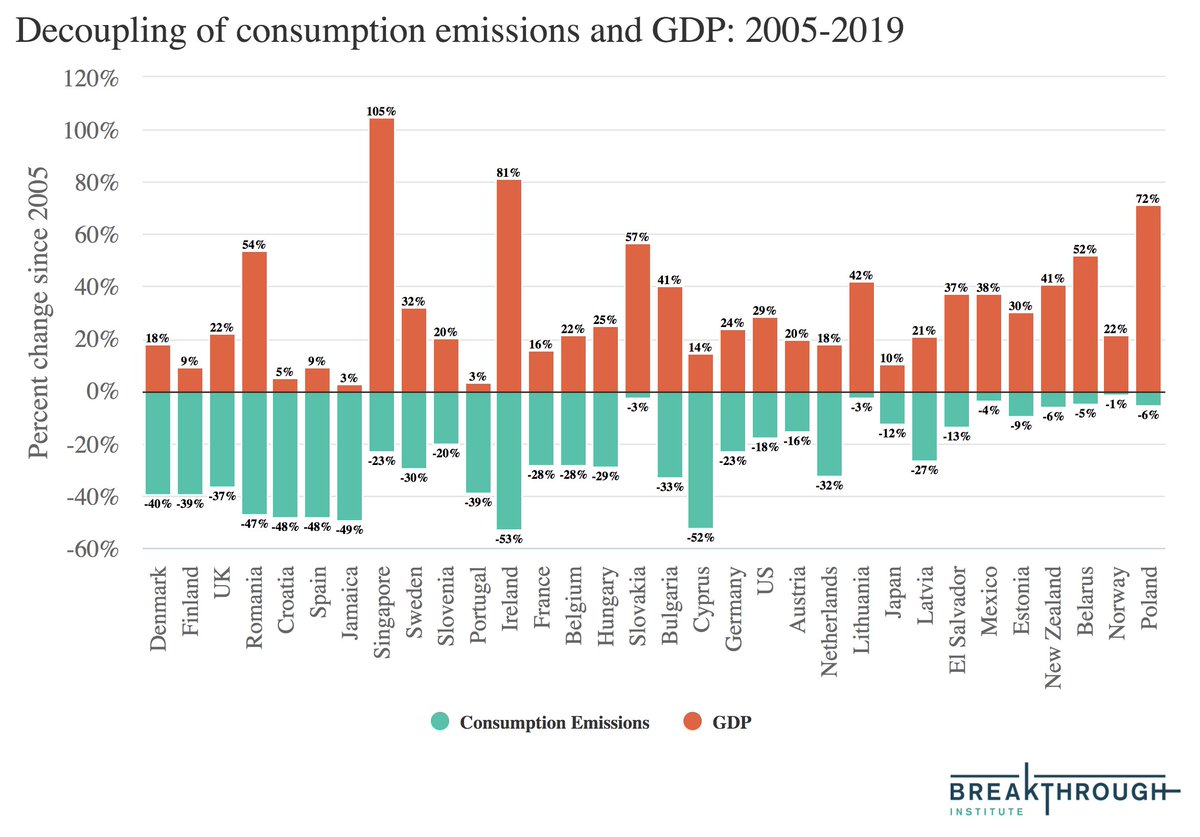
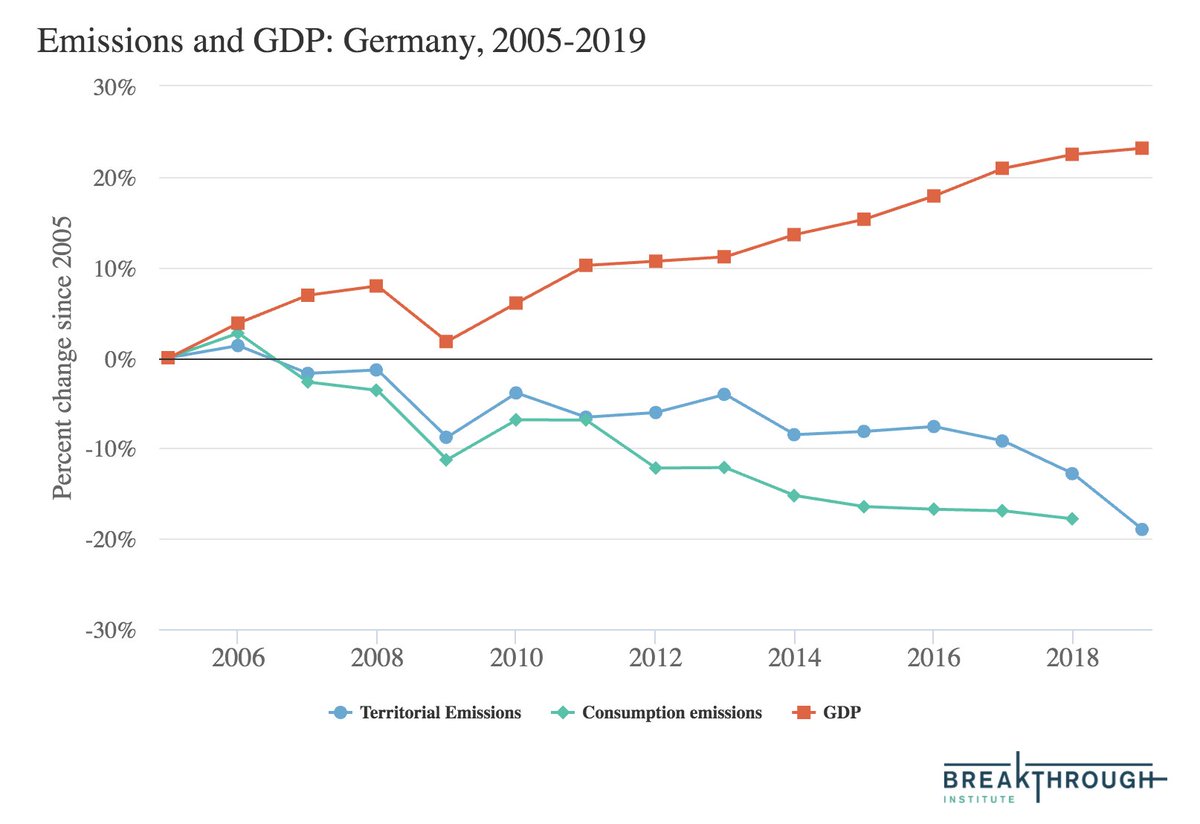
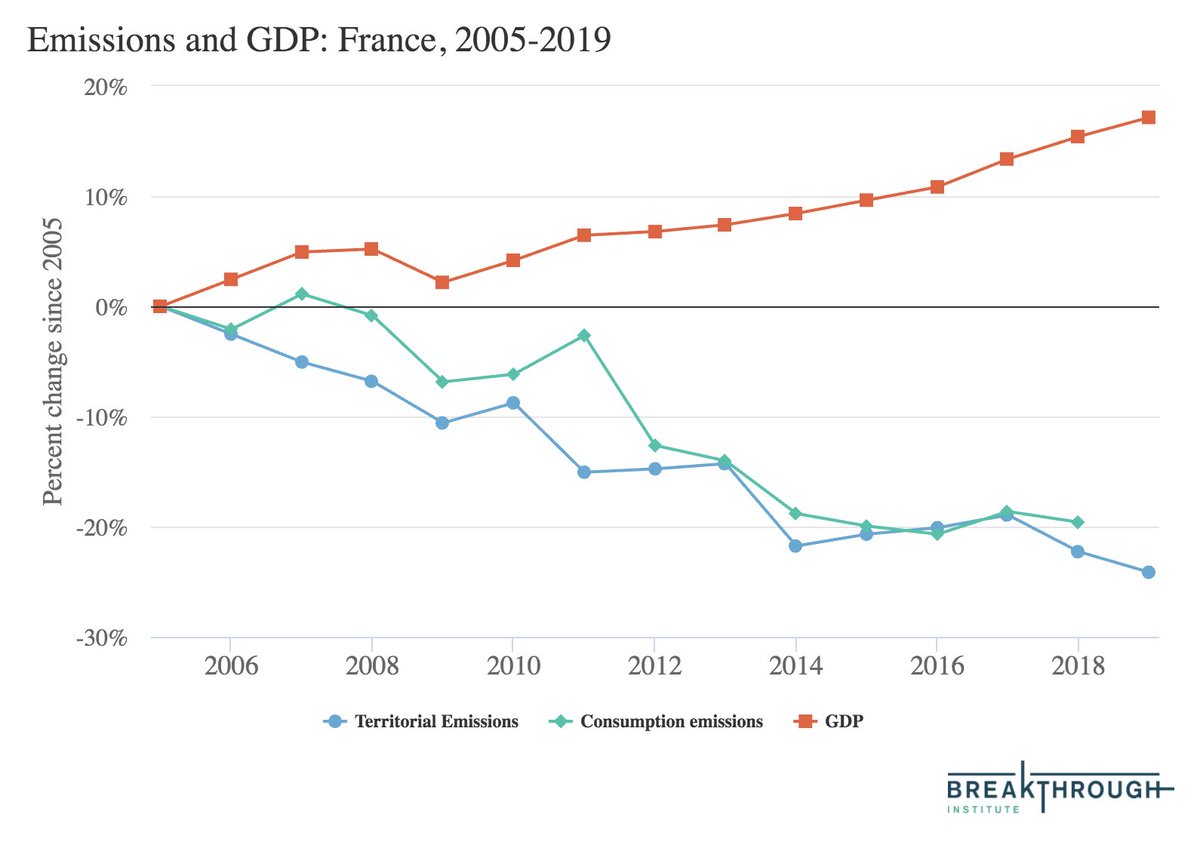
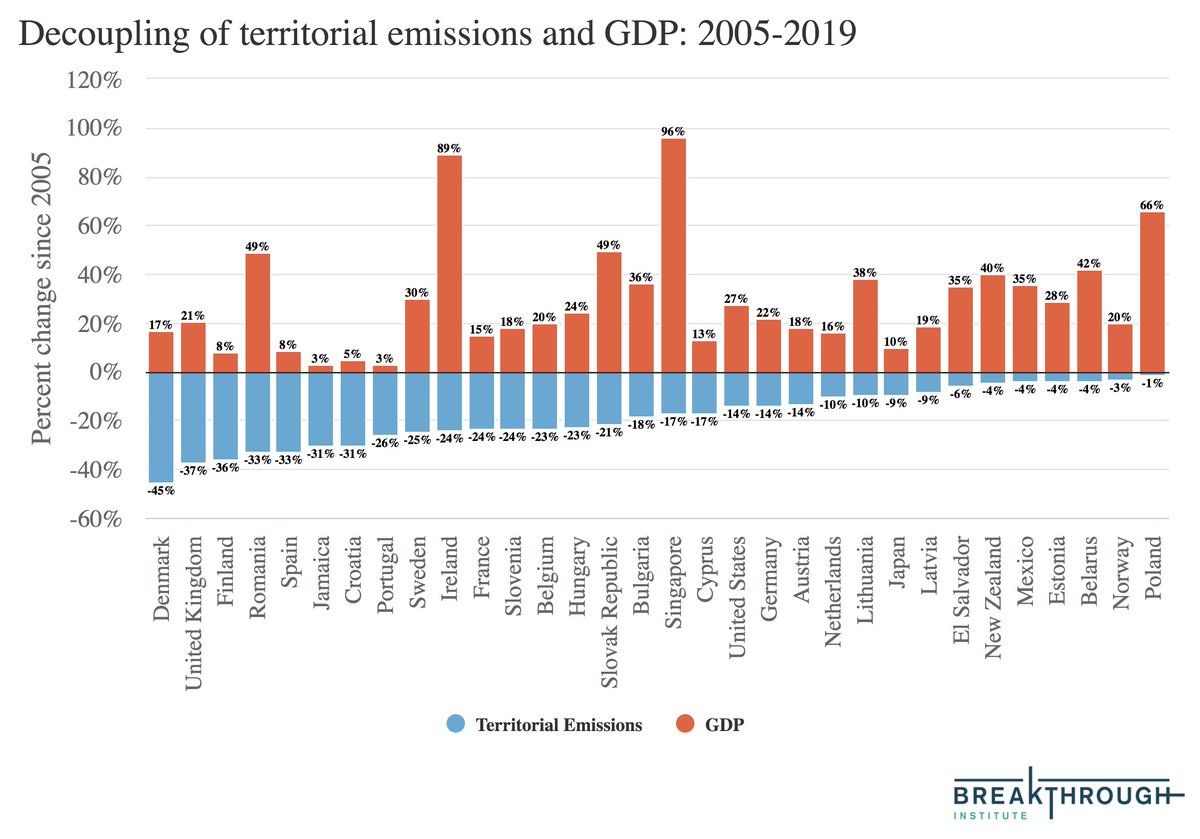
In a new analysis, we find there are now 32 countries that have absolutely decoupled economic growth from CO2 since 2005. In these places both territorial emissions and consumption emissions (which include CO2 imported in goods) are falling. https://thebreakthrough.org/issues/energy/absolute-decoupling-of-economic-growth-and-emissions-in-32-countries
A">https://thebreakthrough.org/issues/en... thread: 1/21
A">https://thebreakthrough.org/issues/en... thread: 1/21
Absolute decoupling has long been controversial, with some arguing that economic growth is fundamentally incompatible with emissions reductions. However, around 15 years ago things began to change. 2/
Rather than a 21st century dominated by coal that energy modelers foresaw, global coal use peaked in 2013 and is now in structural decline. We have succeeded in making clean energy cheap, with solar power and battery storage costs falling 10-fold since 2009. 3/
The world produced more electricity from clean energy – solar, wind, hydro, and nuclear – than from coal over the past two years. And, according to major oil companies, peak oil is upon us – not because we have run out of cheap oil to produce, but because demand is falling. 4/
There is increasing evidence that the world is on track to absolutely decouple CO2 emissions and economic growth – with global CO2 emissions potentially having peaked in 2019 and unlikely to increase substantially in the coming decade. https://thebreakthrough.org/issues/energy/peak-co2-emissions-2019">https://thebreakthrough.org/issues/en... 5/
While peak emissions is just the first and easiest step towards reaching net-zero emissions needed to stop the world from warming, it demonstrates that linkages b/w emissions and economic activity are not an immutable law, but rather a result of our means of energy production. 6/
To qualify as having experienced absolute decoupling, we require countries included in this analysis to pass four separate filters: 1) a population of at least one million, 2) declining territorial emissions over the 2005-2019 period (based on a linear regression)... 7/
3) declining consumption emissions, and 4) increasing real GDP (PPP). We chose not to include 2020 in this analysis because its not particularly representative of longer-term trends, and consumption and territorial emissions estimates are not yet available for many countries. 8/
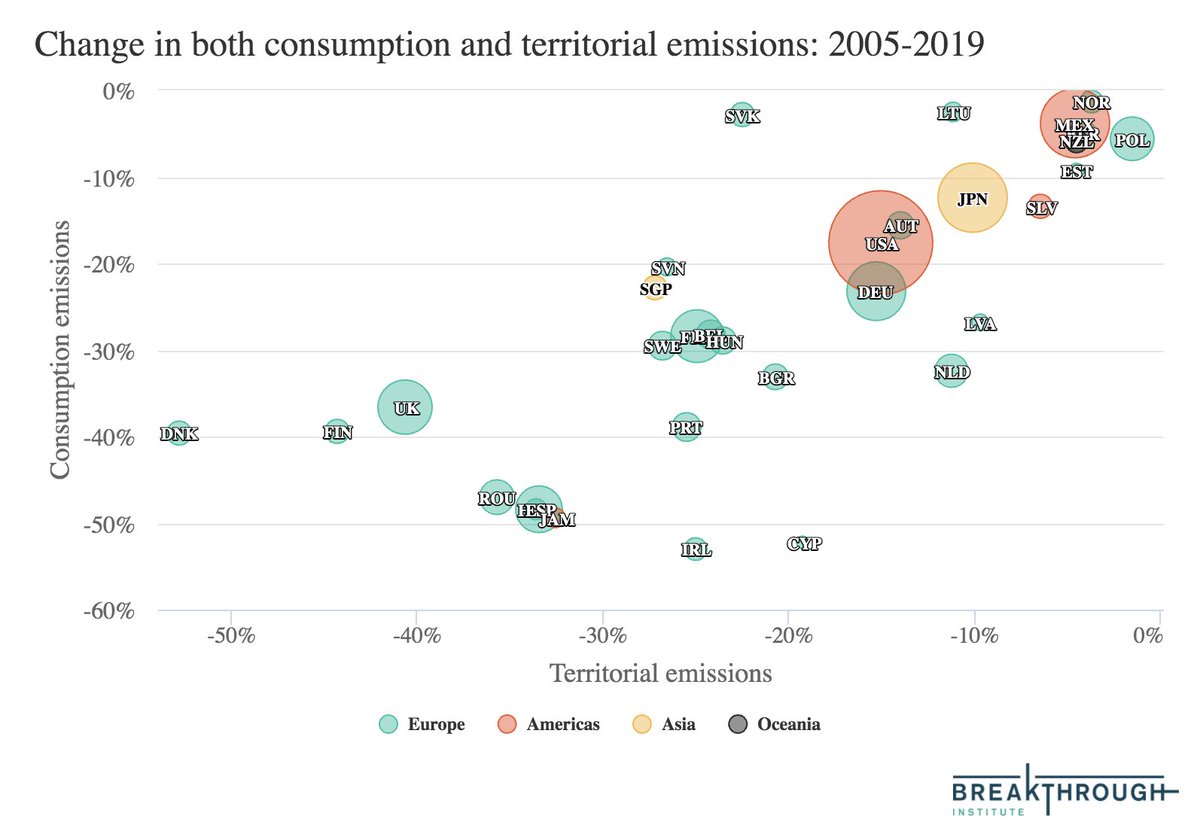
Since 2005, 32 countries have absolutely decoupled emissions from economic growth, both for terrestrial emissions (those within national borders) and consumption emissions (emissions embodied in the goods consumed in a country). 9/
Theres variation in territorial vs consumption emissions reductions. Some countries – such as the UK, Denmark, Finland, and Singapore – have seen territorial emissions fall faster, while the US, Japan, Germany, and Spain have seen consumption emissions fall faster. 10/
Now for some specific examples! Here are changes in US GDP, territorial emissions, and consumption emissions since 2005. For details on the specific drivers of these changes, see: https://www.carbonbrief.org/analysis-why-us-carbon-emissions-have-fallen-14-since-2005">https://www.carbonbrief.org/analysis-... 11/
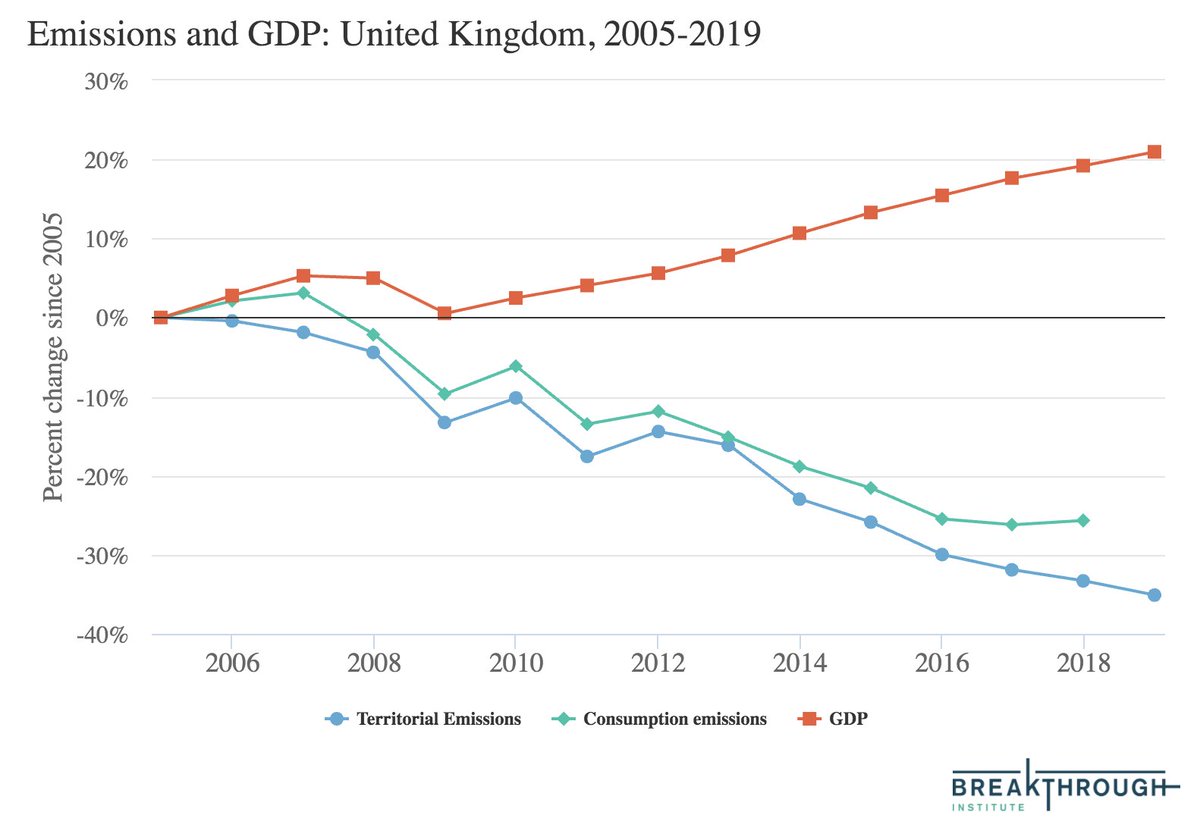
Here are UK GDP and emissions. For details on drivers of emissions reductions there, see: https://www.carbonbrief.org/analysis-why-the-uks-co2-emissions-have-fallen-38-since-1990">https://www.carbonbrief.org/analysis-... 12/
And Japan, which saw a drop during the financial crisis, a rise after Fukushima, and a drop again in recent years: 15/
A common criticism of past assessments of decoupling is ignoring offshoring of emissions from rich countries to poor/middle income countries like China. There is some truth to this, as emissions reductions between 1990 and 2005 or so were often counterbalanced by offshoring. 16/
However, this began to change around 2005; the rapidly growing domestic Chinese economy and demand for imports switched things around, and the net export of CO2 from rich countries to poorer ones has been flat or declining since 2007: https://agupubs.onlinelibrary.wiley.com/doi/full/10.1002/2017EF000625">https://agupubs.onlinelibrary.wiley.com/doi/full/... 17/
Absolute decoupling is possible. There is no physical law requiring economic growth – and broader increases in human wellbeing – to necessarily be linked to CO2 emissions. 18/
All of the services that we rely on today that emit fossil fuels – electricity, transportation, heating, food – can in principle be replaced by near-zero carbon alternatives, though these are more mature in some sectors than others. 19/
This is not to say that infinite economic growth is desirable (or even possible), particularly given that the global population is expected to start to shrink by the end of the 21st century (and well before that in most currently wealthy countries). 20/
There& #39;ll be tradeoffs between economic growth and mitigation – particularly if the world is to meet its ambitious targets. But its possible to envision a world thats prosperous, equal, and net-zero emissions; indeed, the IPCC& #39;s scenarios do just that. https://www.carbonbrief.org/explainer-how-shared-socioeconomic-pathways-explore-future-climate-change">https://www.carbonbrief.org/explainer... 21/
Note that there may be some slight inconsistencies between the bar charts and the line charts; we chose to use the 2005-2019 trend to estimate changes since 2005 rather than just the ratio of 2019 to 2005 values, in order to minimize the effect of year-to-year variability.
Sigh, looks like there was a bug in my code. The list of countries that have absolutely decoupled was accurate, but the numbers in the bar charts were a tad off. Here are the correct numbers (web article to be updated shortly):
Here are corrected consumption emissions changes. The other charts (e.g. the line graphs for each country) were unaffected.
What happened is that I was using a linear regression to calculate the change in each variable between 2005 and 2019, but differencing the actual 2005 value from the predicted change. This can lead to problems if the 2005 value is not particularly representative of the early data
To correct for this I& #39;m still using a regression to calculate the change over time, but differencing the predicted 2019 value from the regression from the predicted 2005 value (vs coef * 14 - 2005 value / 2005 value initially). The change is minor for most countries.

 Read on Twitter