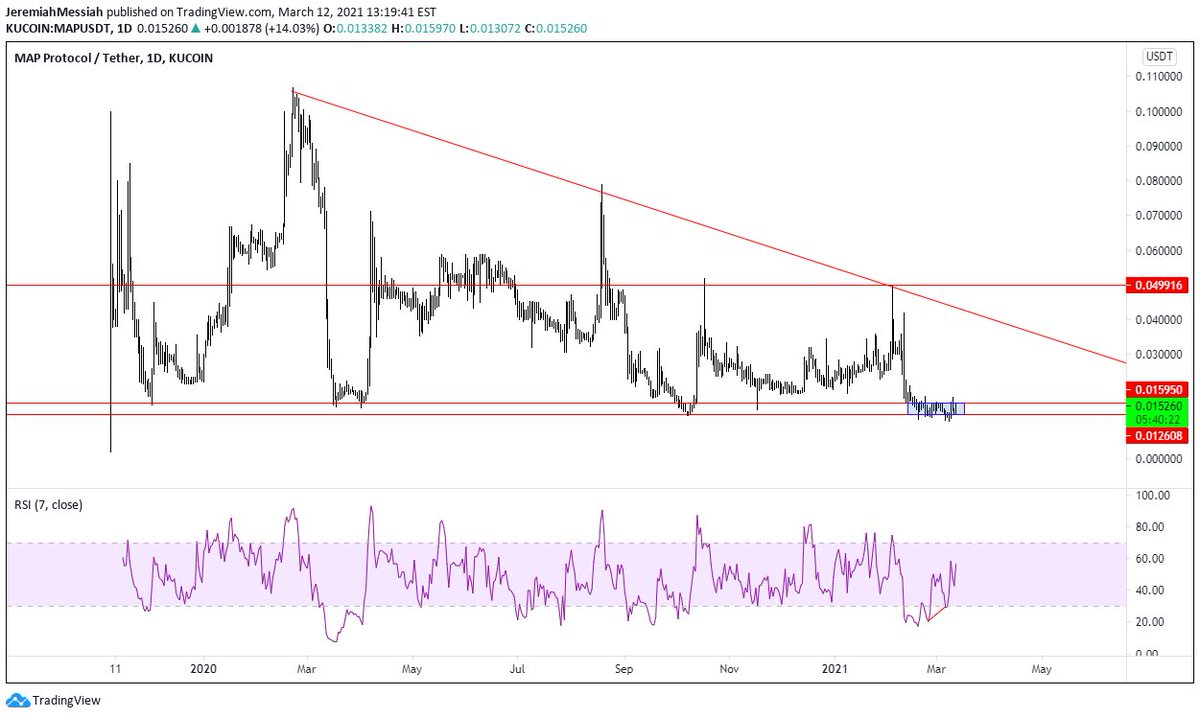
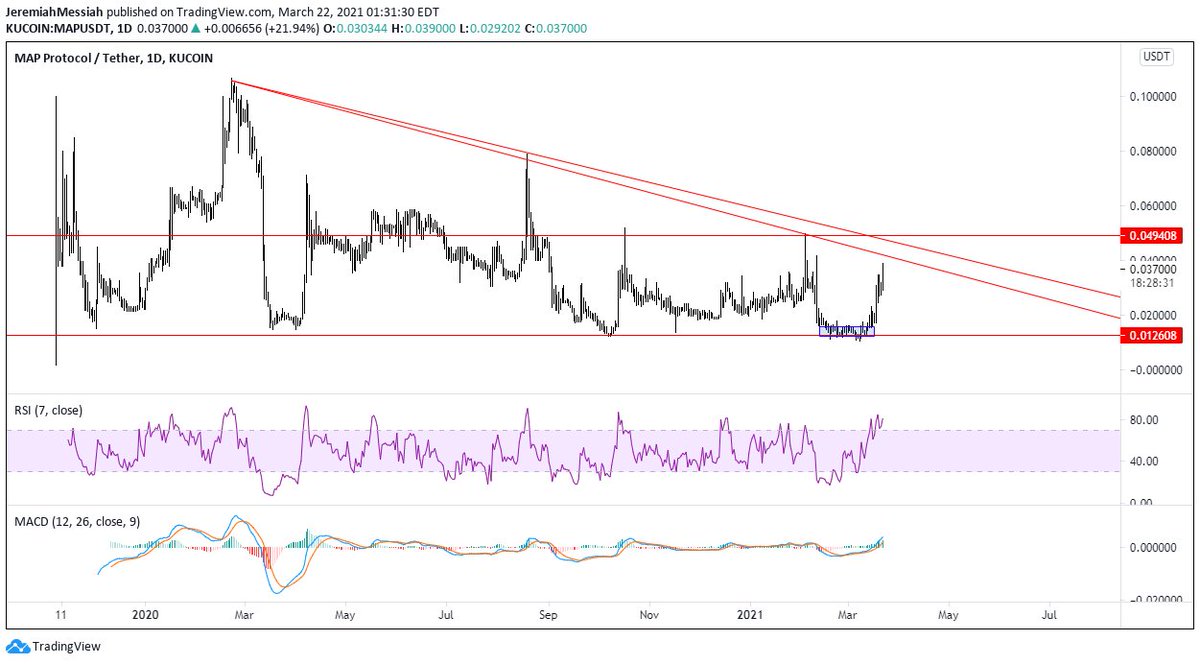
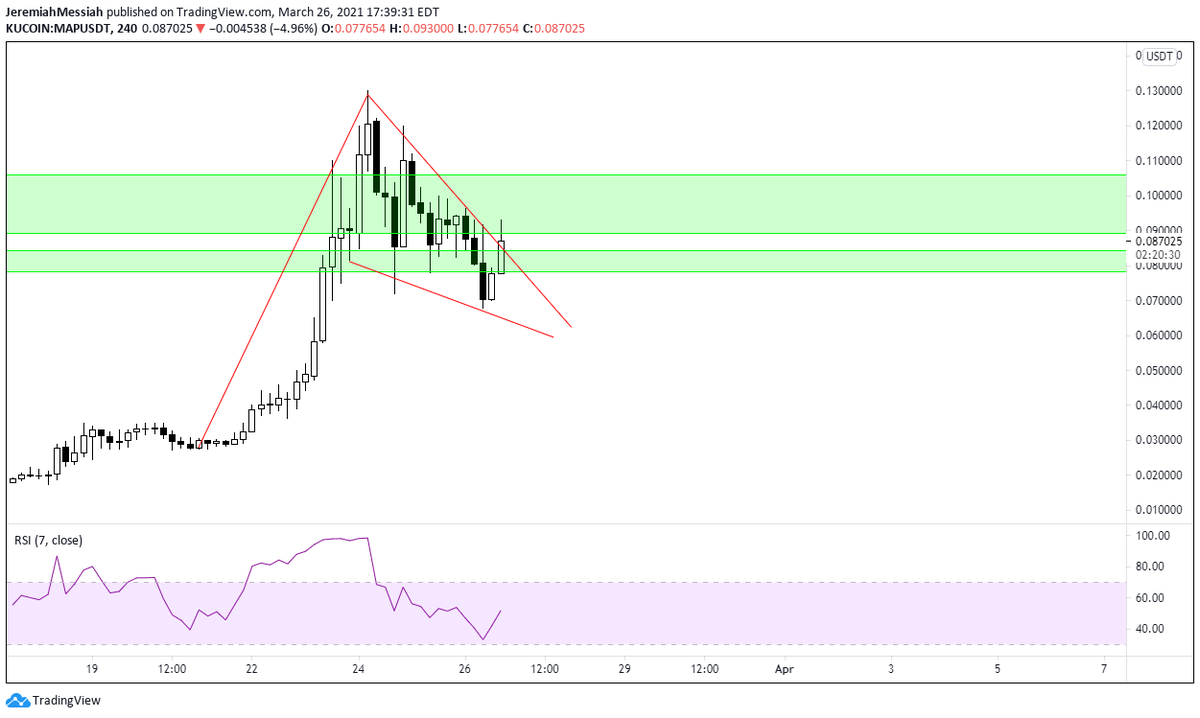
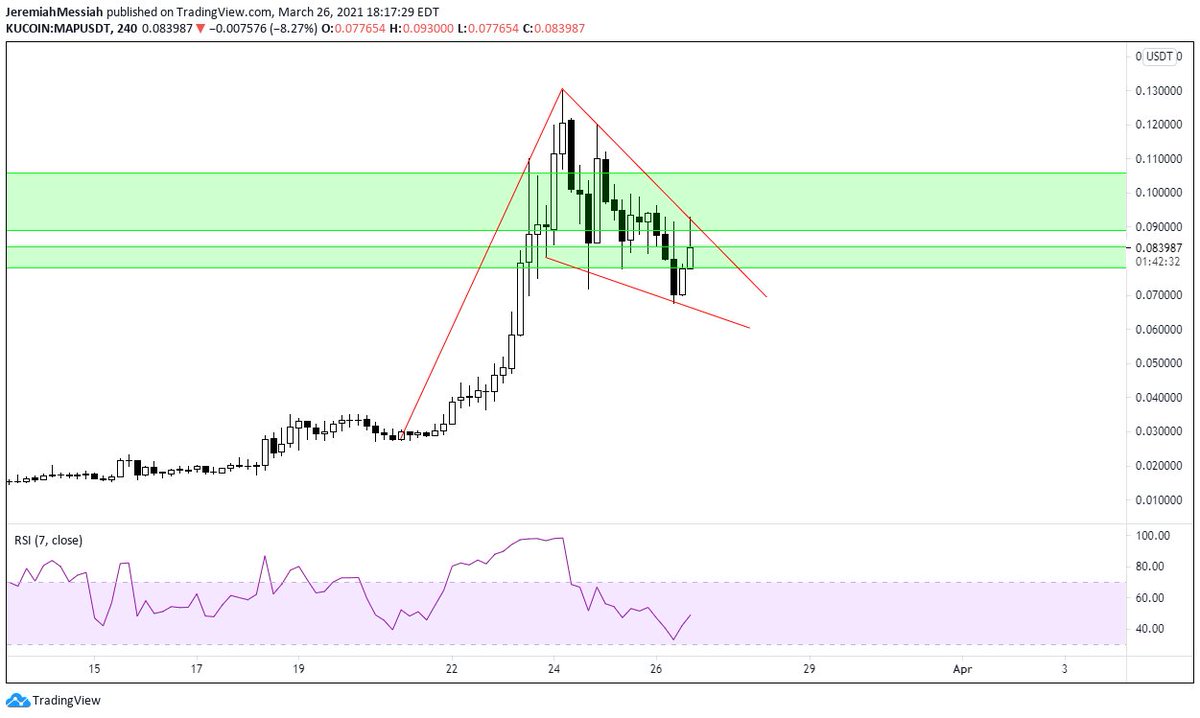
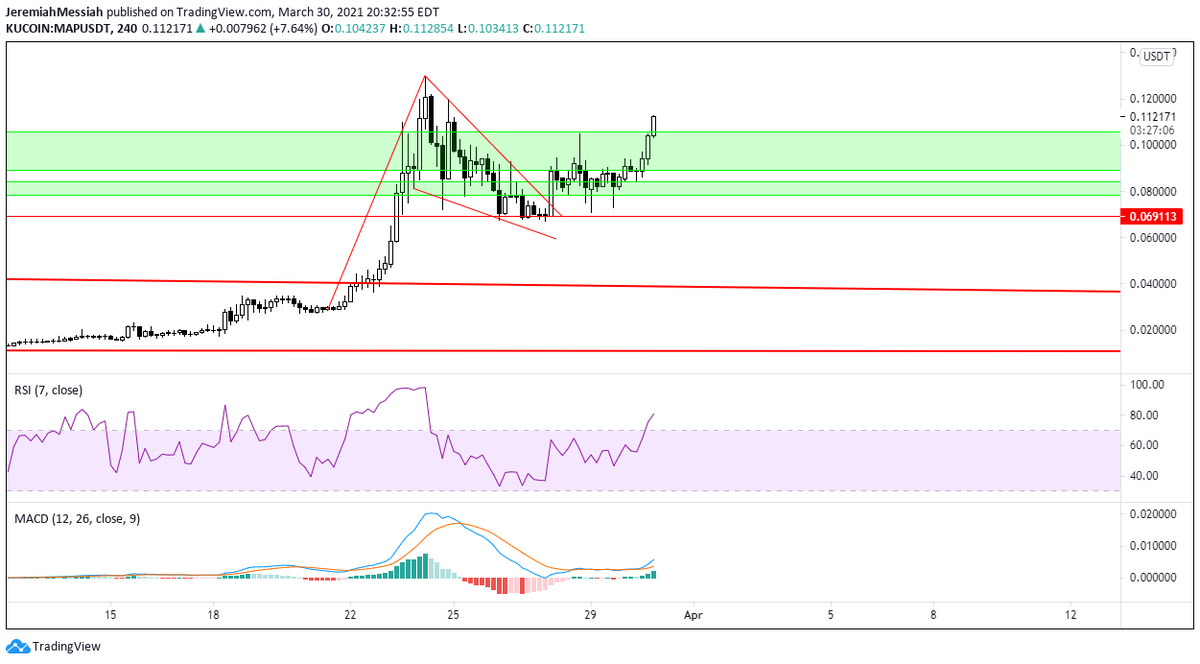
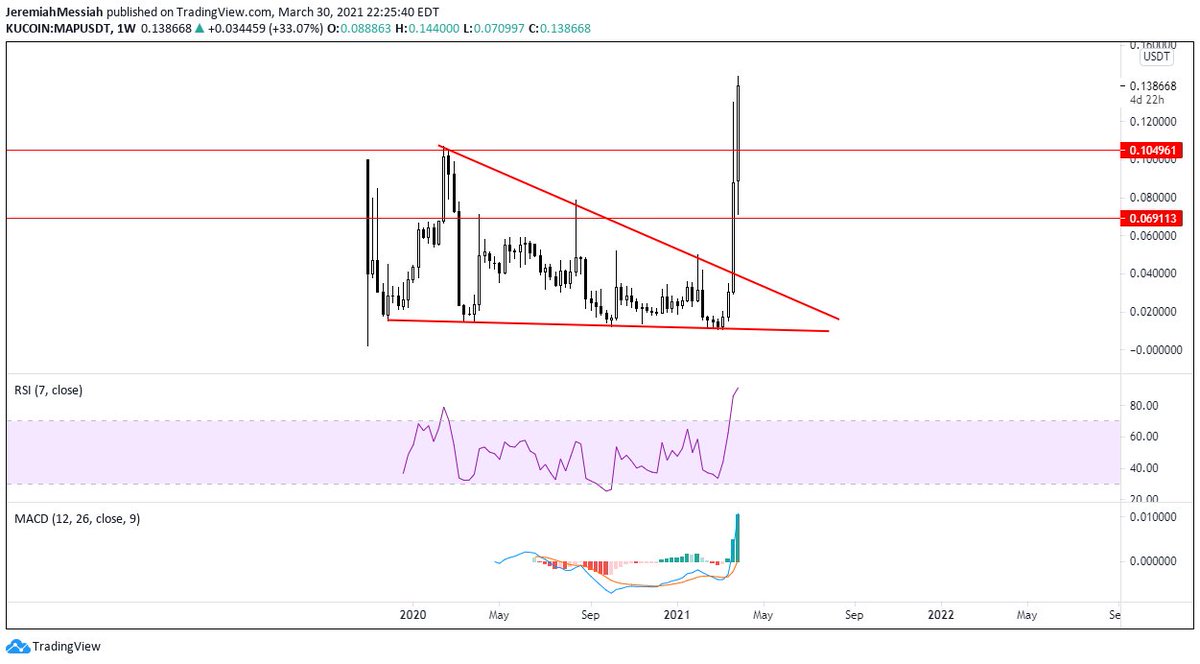
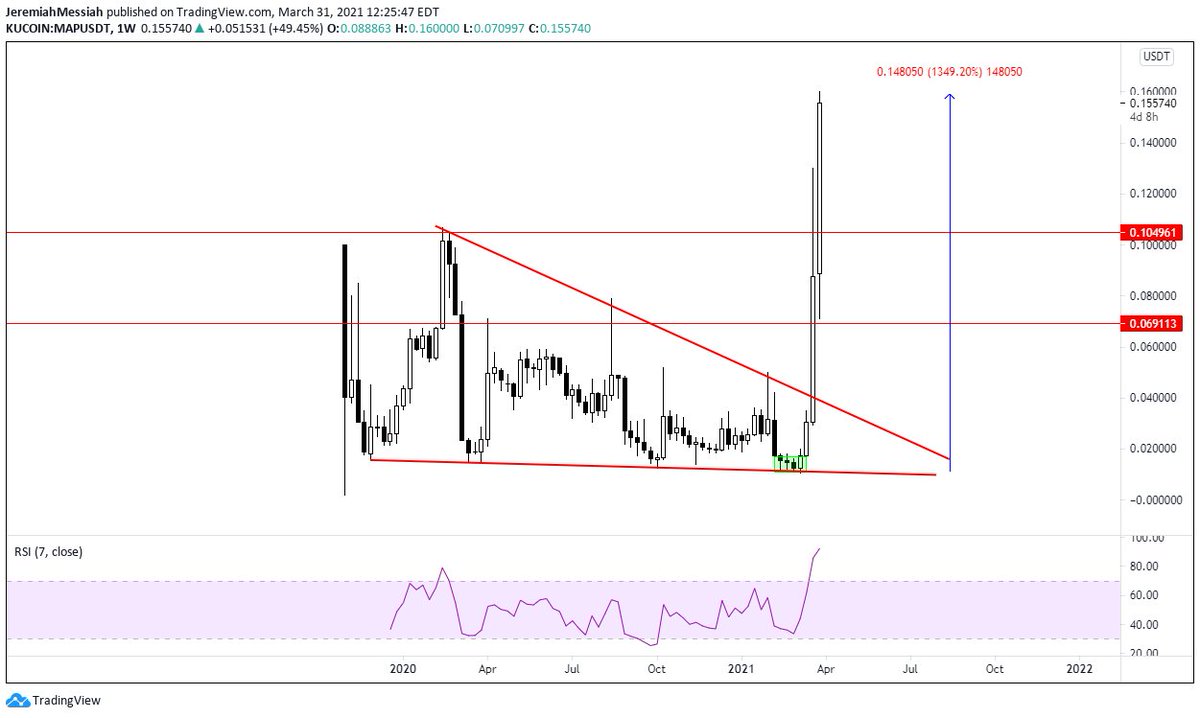
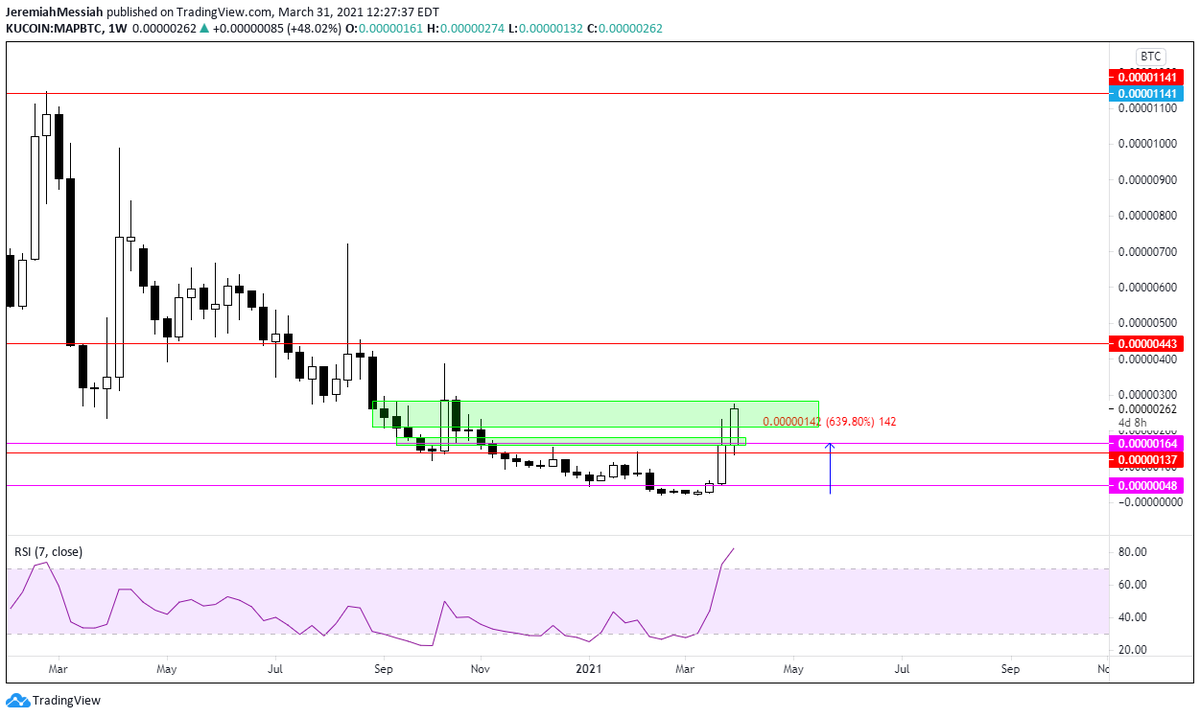
$MAP See consolidation buy consolidation. I& #39;m in with dust.
-Sub 5m cap
-Built on polkadot
-Partnered with amazon
-Sub 5m cap
-Built on polkadot
-Partnered with amazon
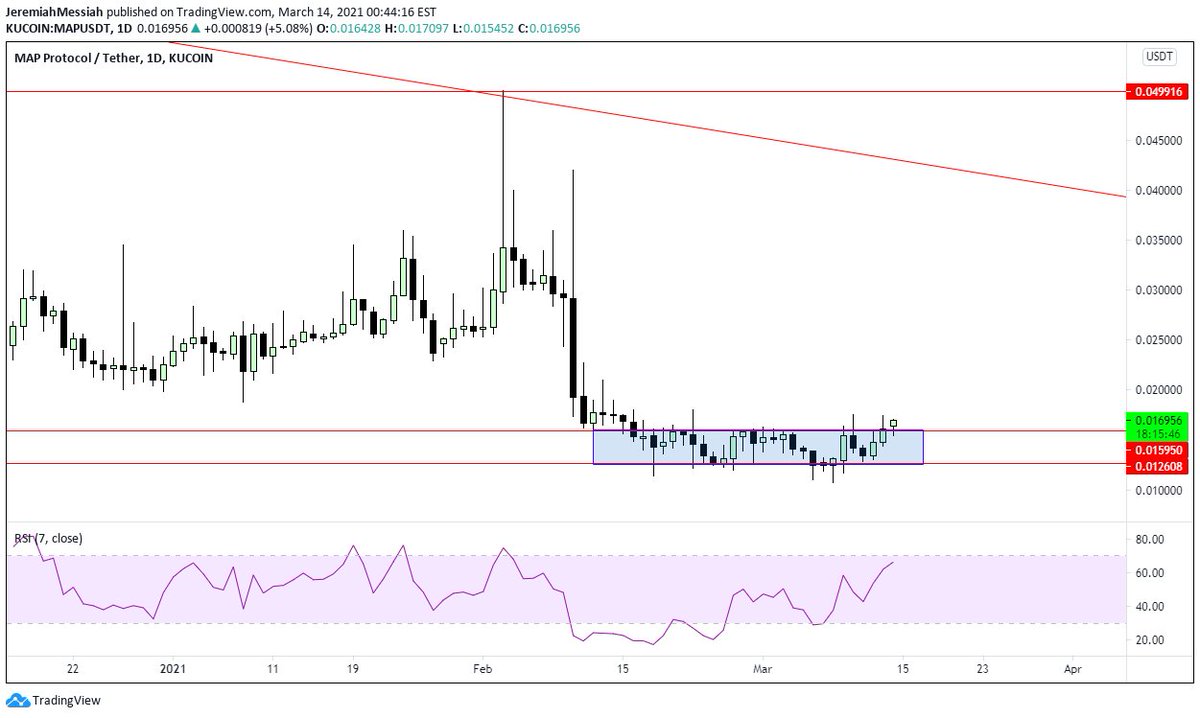
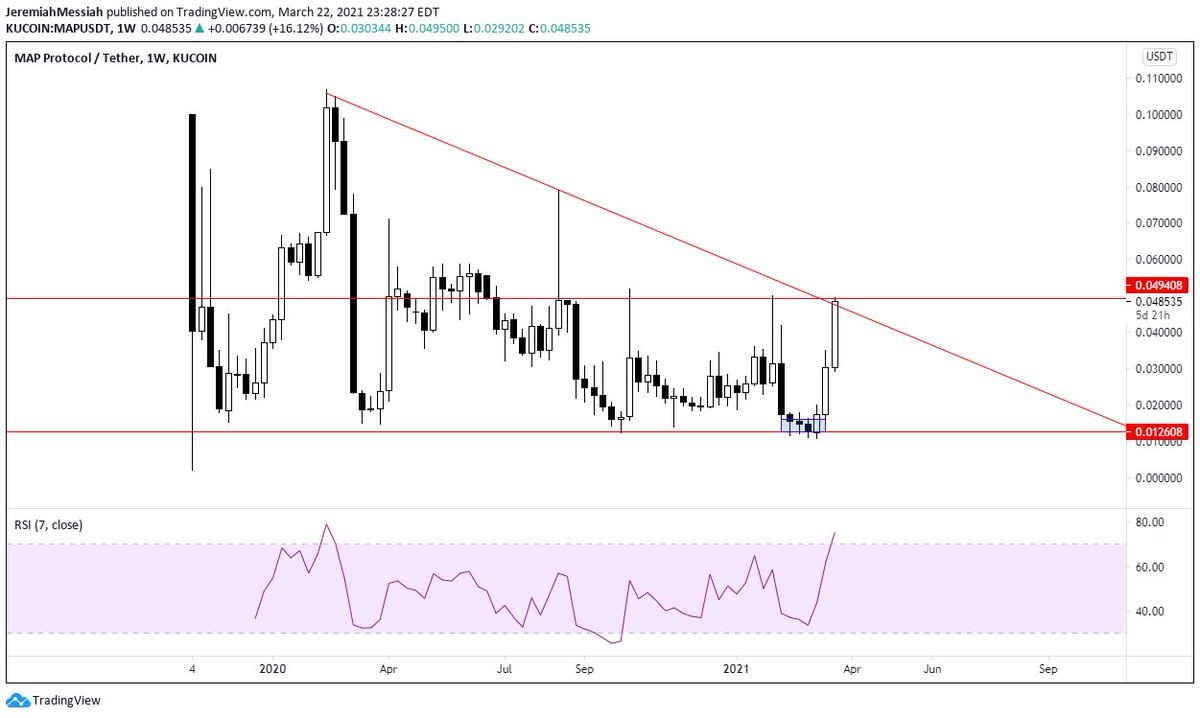
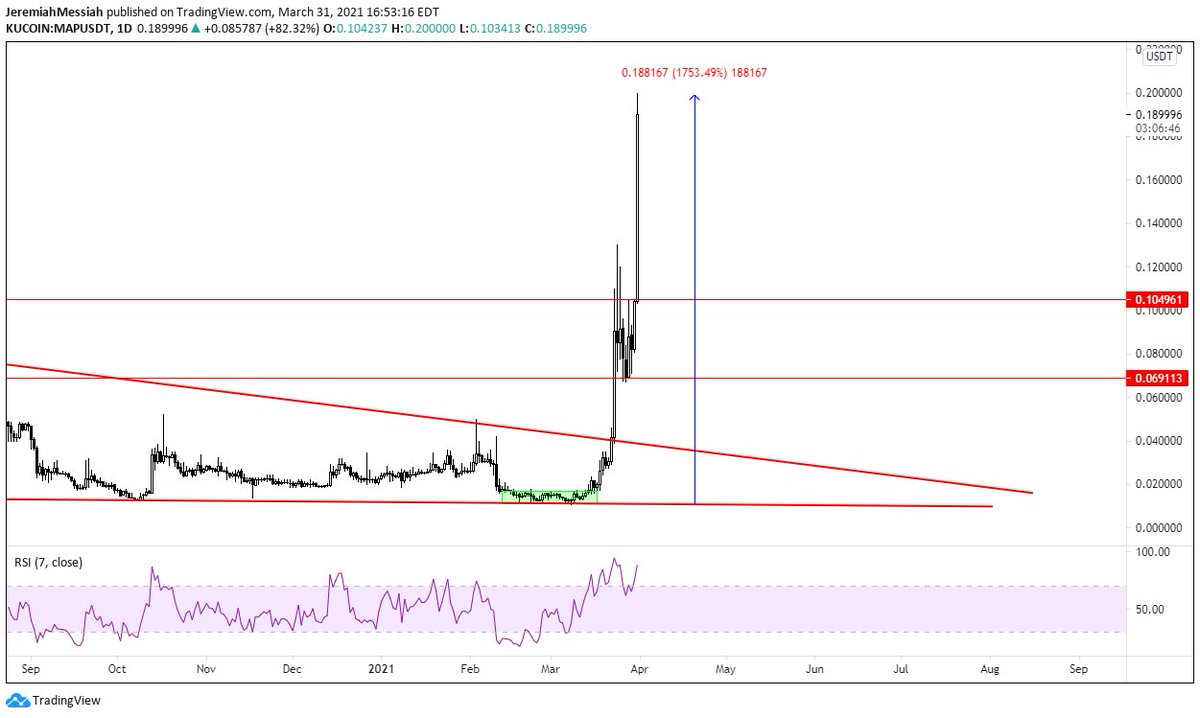
$MAP Break from consolidation, these can always be fakeouts and nothing is ever certain. However, I& #39;d love to see this pump & break through descending triangle. This is a 400 day long descending triangle. The longer the consolidation, the stronger the breakout
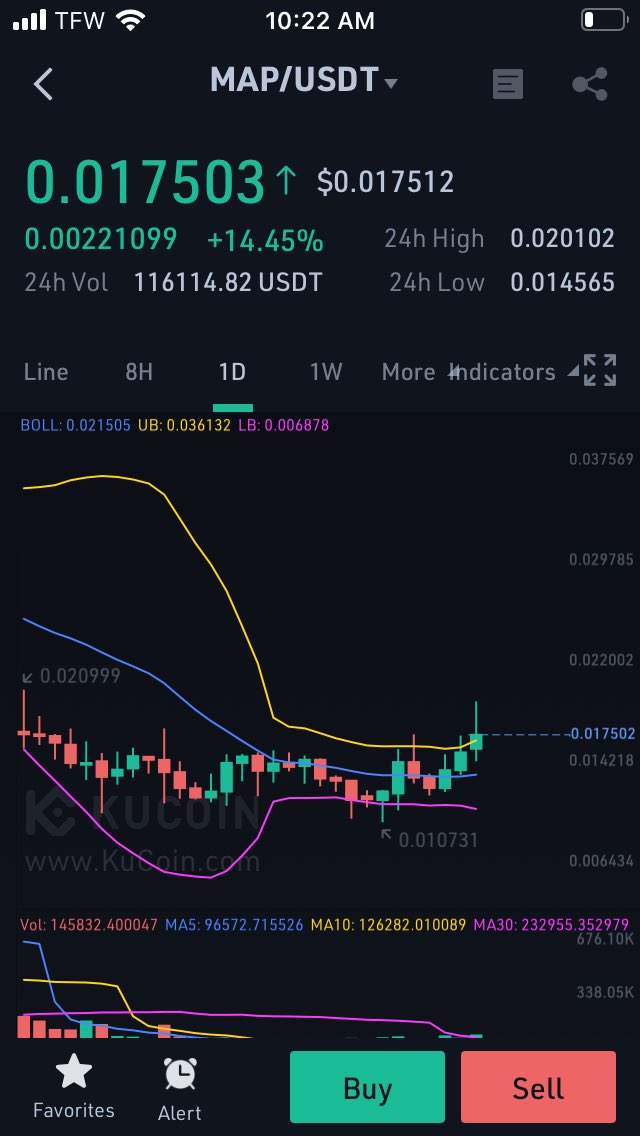
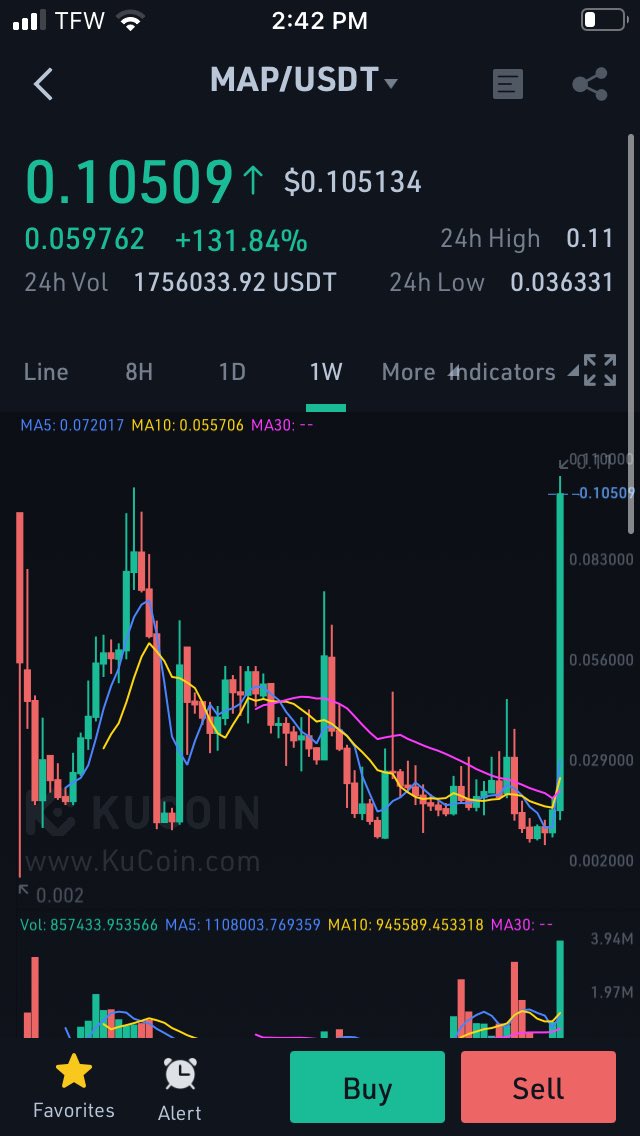
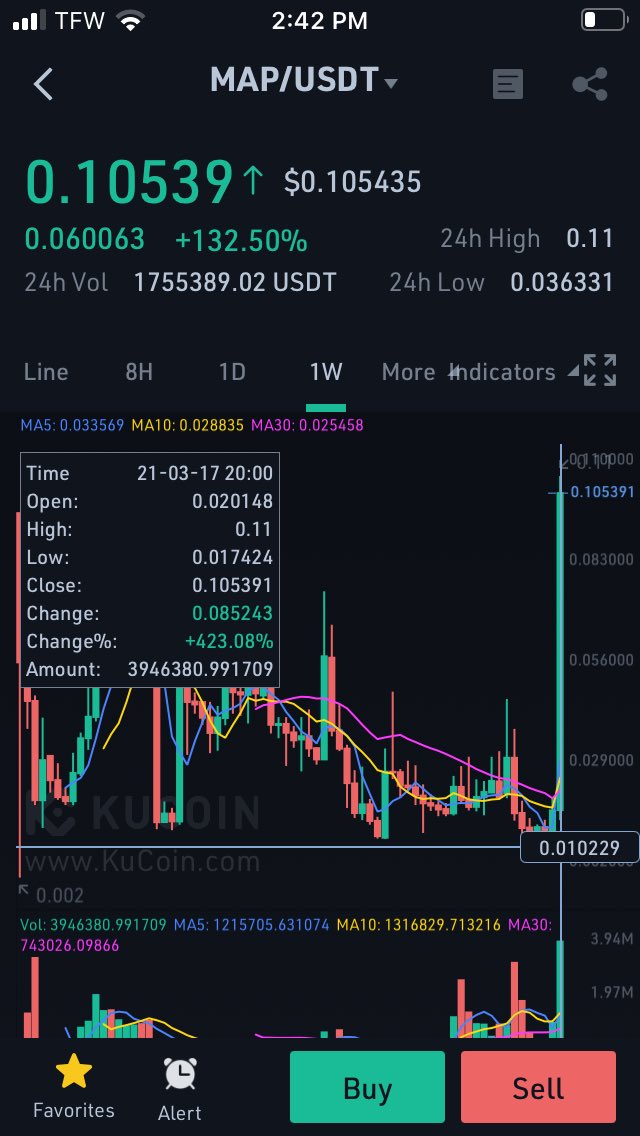
Excuse the phone chart. Periods of low volatility are ALWAYS followed by periods of high volatility. Which way is this volatility going to go? No idea when but it’s coming. A couple green candlesticks in the right direction....
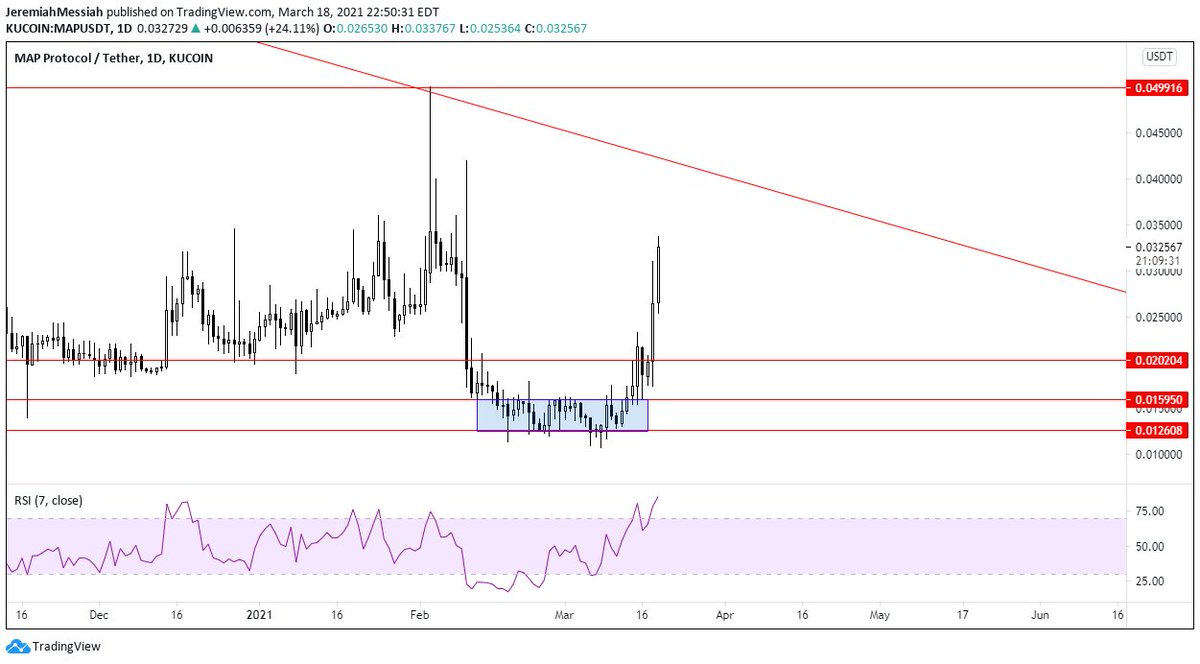
$MAP Taking off. Target = top of triangle and attempting to buy back in on the dip.
I think $MAP might actually just ape through the triangle so removing my sell orders. Will probably regret it but oh well. Keep an eye on both trendlines there will surely be resistance found at both of them. Lets hope for a break.
$MAP Wouldn& #39;t be surprised to see a decent pullback here but also wouldn& #39;t be surprised to see $MAP just break through triangle.
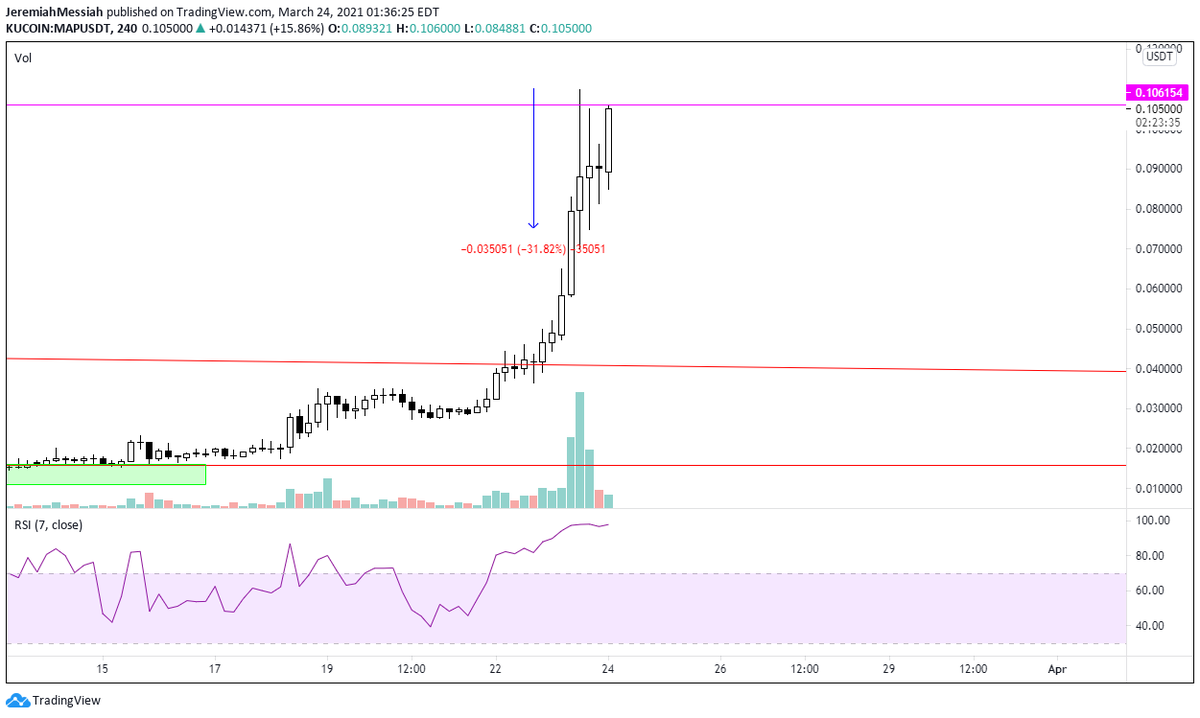
Selling half here at aths. +400% this week. Glad I removed those sell orders. Sorry for phone chart scroll up to view thread. $MAP
The quote I& #39;ve given you guys a million times. Consolidation under resistance in an uptrend is bullish. I think $MAP is actually looking to keep going quicker than expected. That 31% dip got bought up immediately. Not buying back in yet. Waiting for clarity.
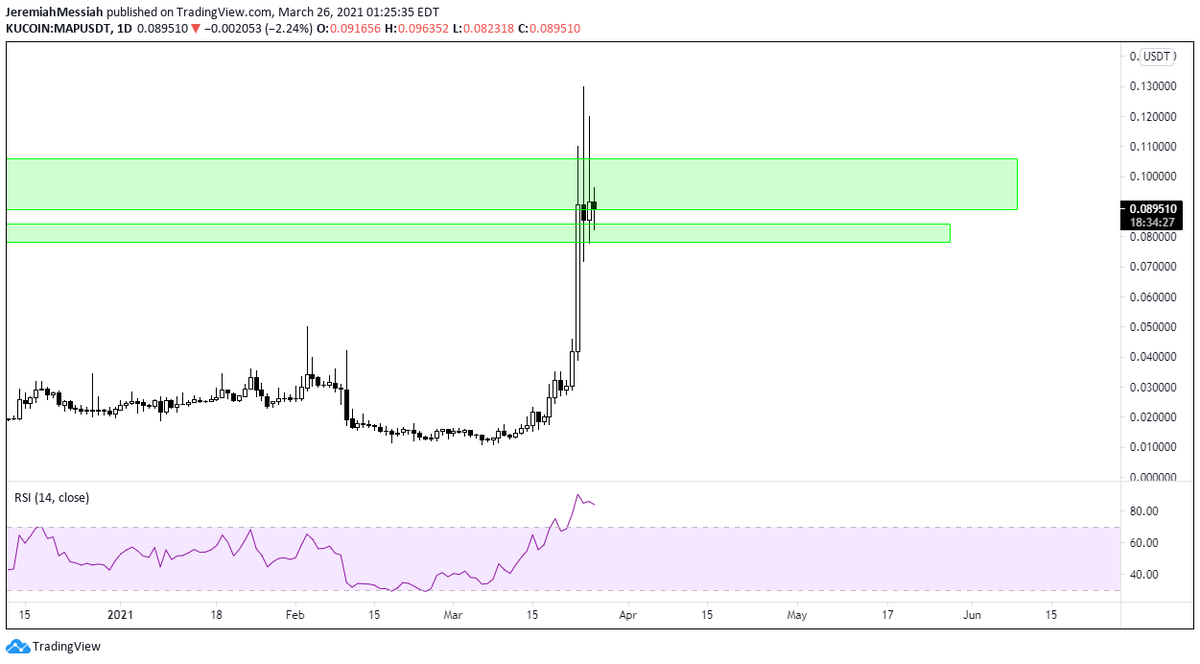
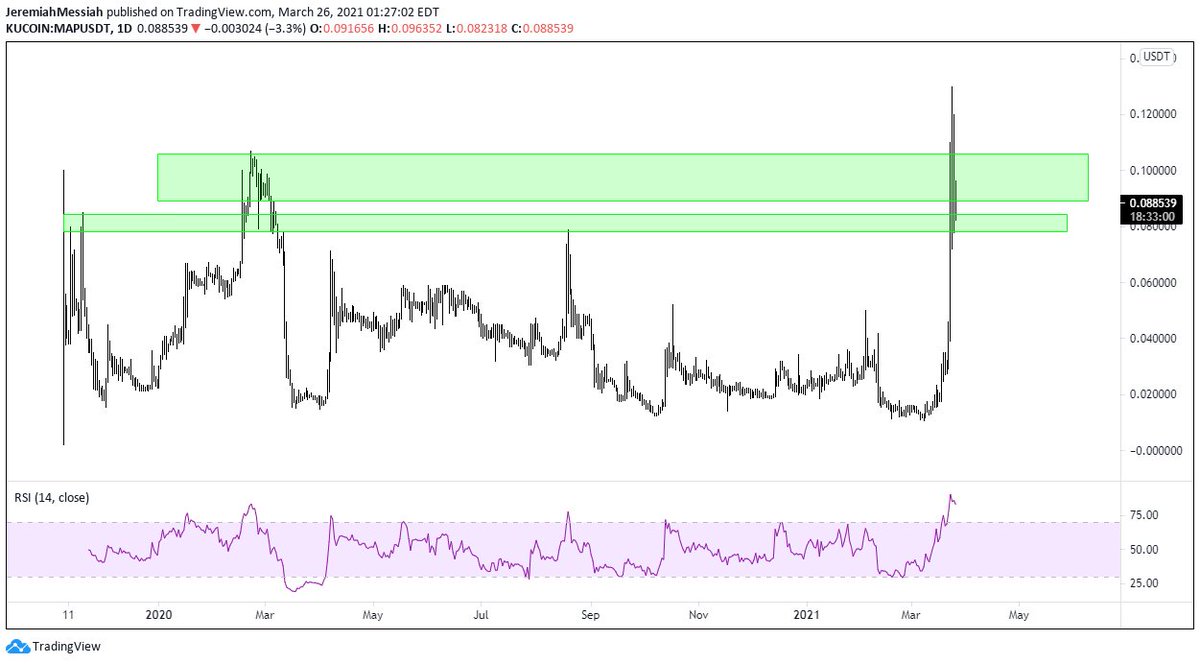
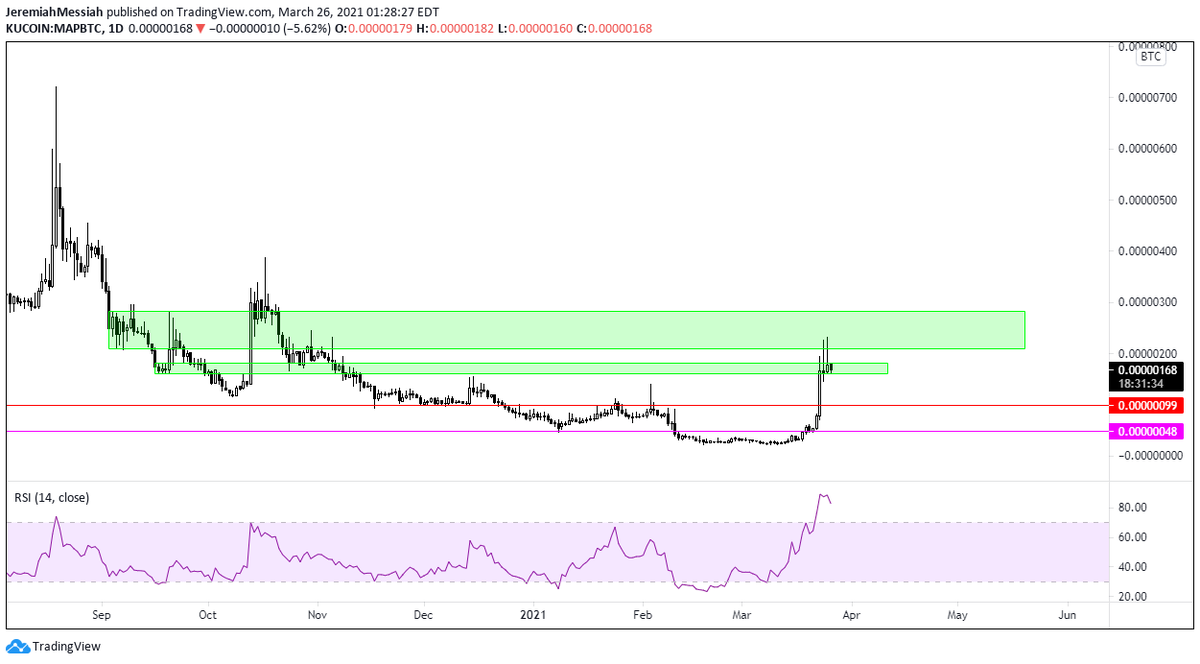
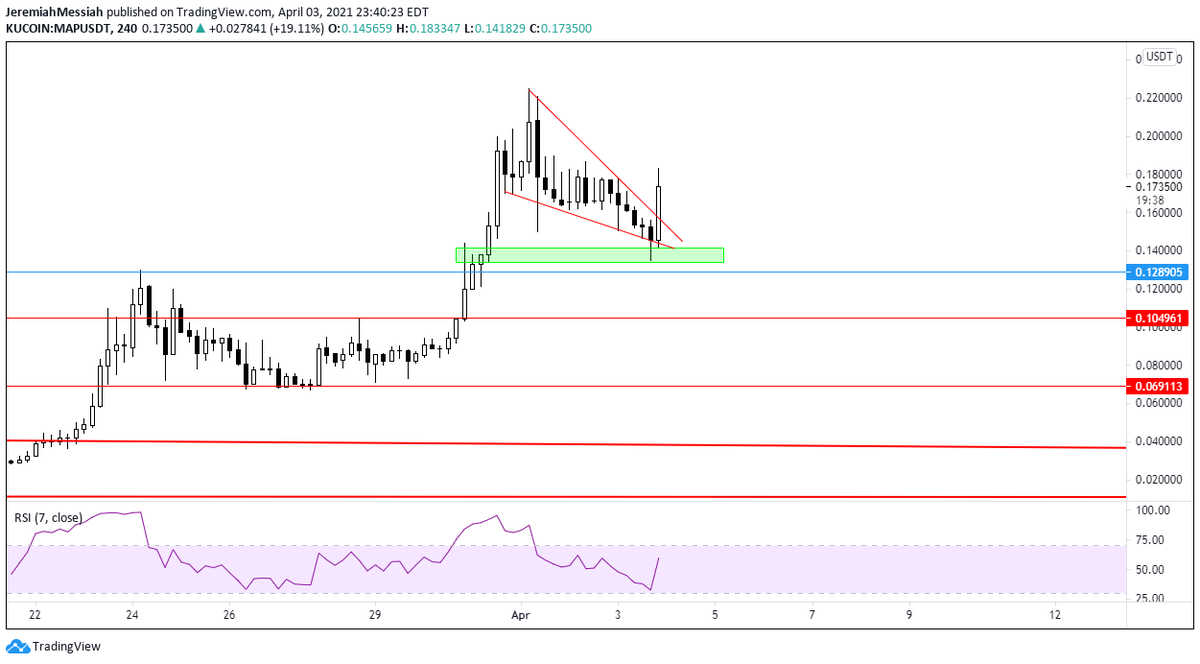
Buying map back here. Finding support at previous consolidation, however finding resistance at previous consolidation. This looks like its gearing for another leg. If it dumps it dumps, buying back in at 20%~ discount from where I sold. $BTC/USDT chart look the same. $MAP
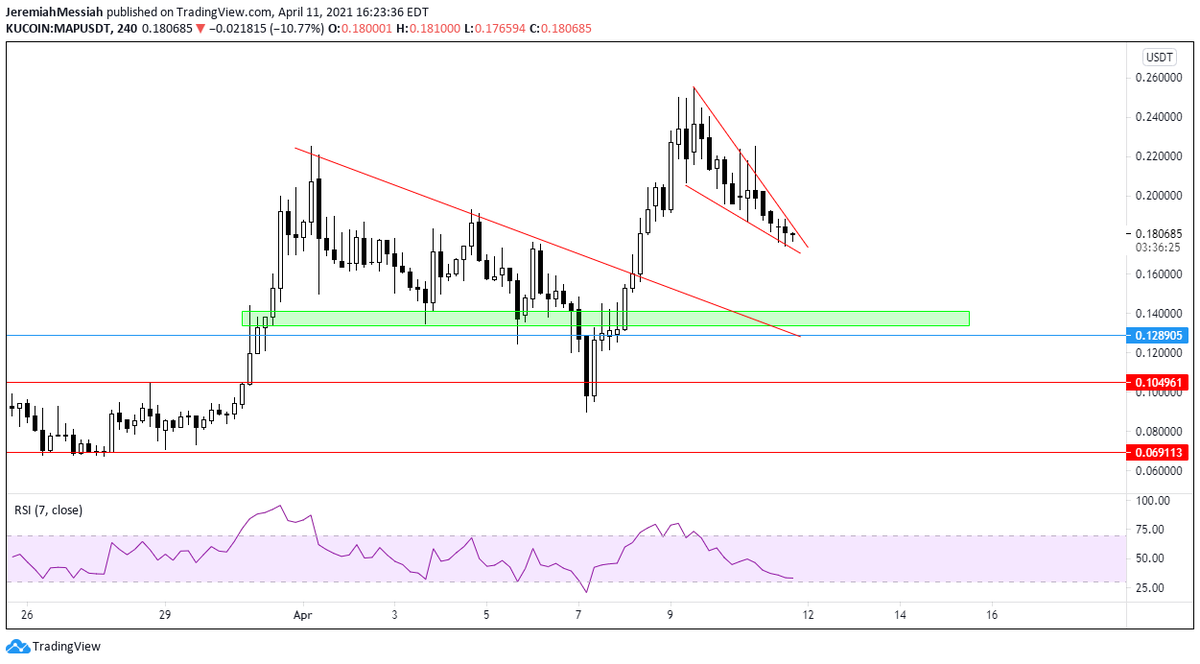
Just added more $MAP here. Took a slice off of a different position. This wedge looking like it wants to pop.
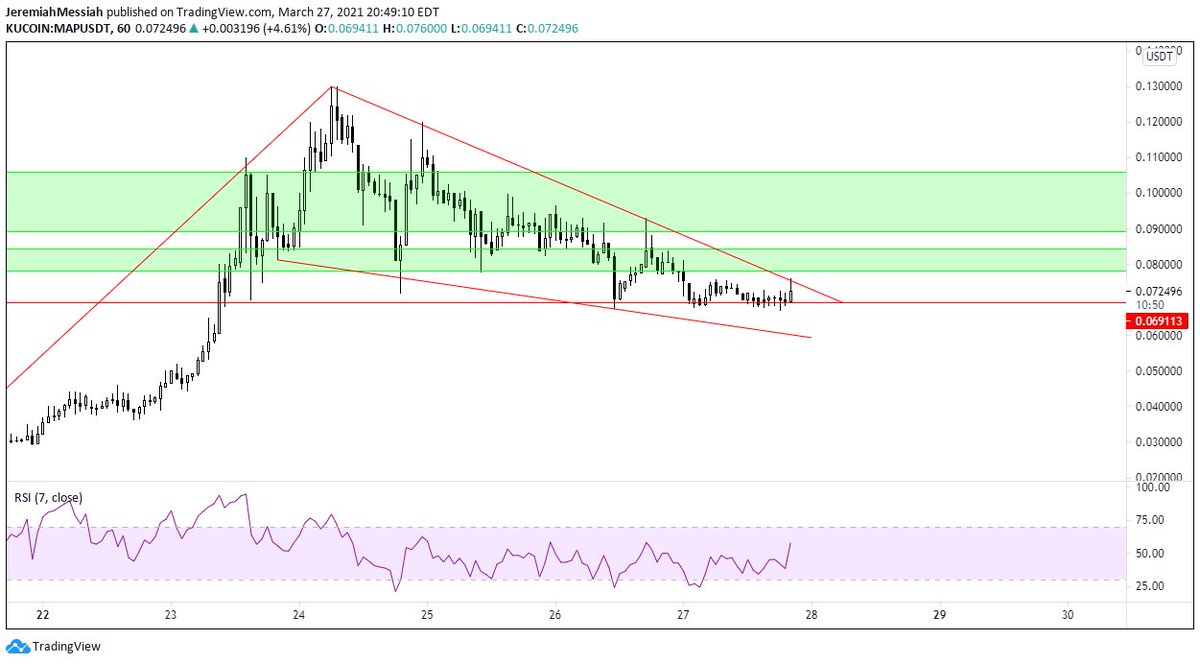
$MAP Adjusted wedge. If it dumps to bottom of wedge simple, buy more.
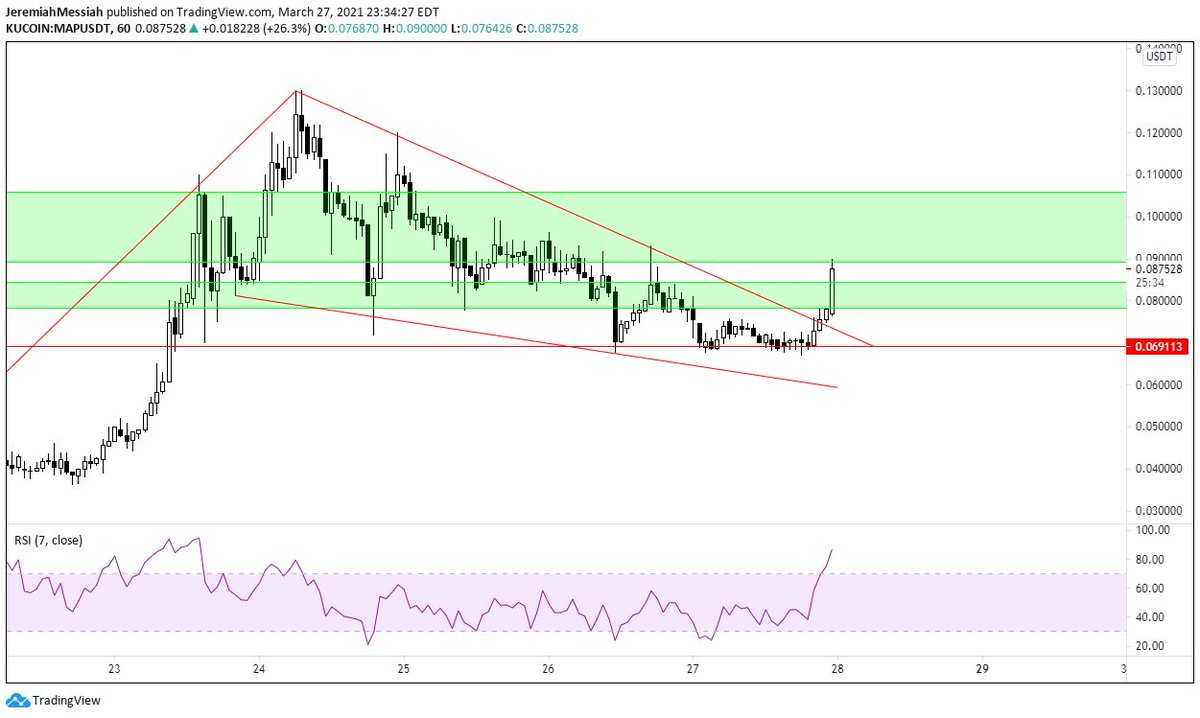
$MAP 1H Moment of truth incoming.
$MAP Off we go.
$MAP Map kicking dick and taking names. Glad I TPed where I did and glad I scaled back in where I did.
$MAP doing $MAP stuff. It& #39;s likely this falling wedge won& #39;t even be noticeable on the chart before all is said and done. Still getting 0 engagements on this call, fomo will kick in at some point. Going to start charting this against the $BTC pair. Price discovery = pain.
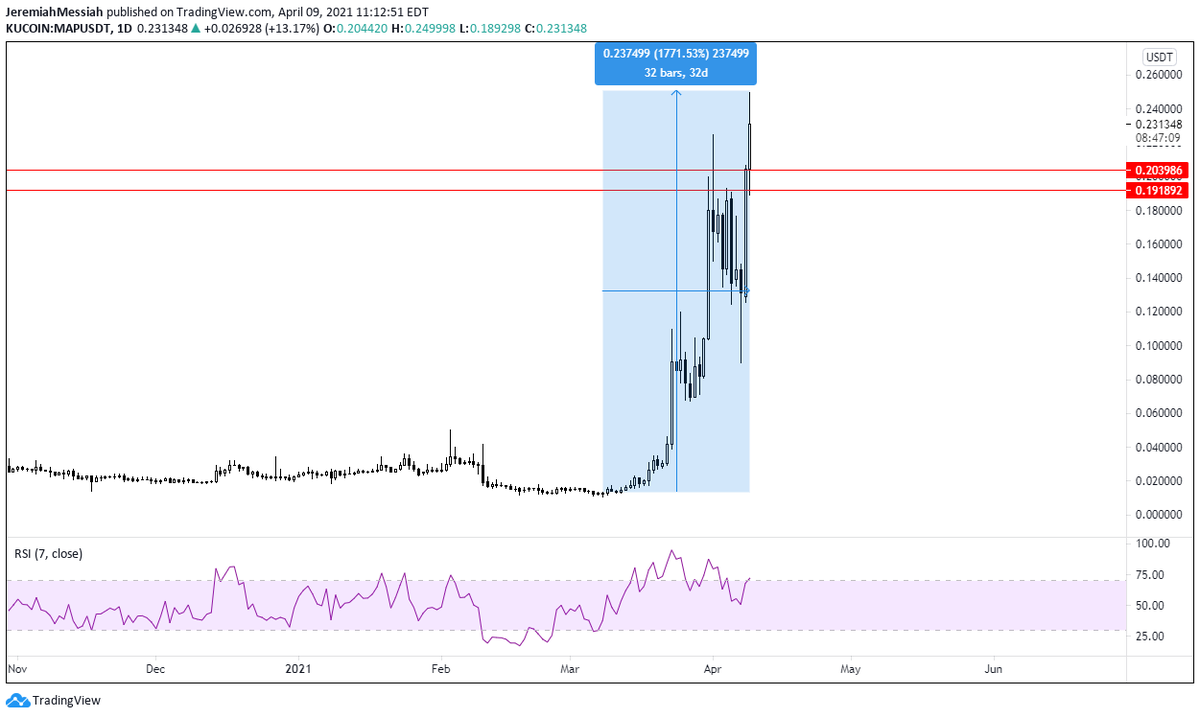
Lol dear god still going. I really hope some of you bought $MAP when I posted it. I wouldn& #39;t recommend aping. Wait for pullback and then buy this time. I posted bottom and then I posted again where to buy if you missed bottom. $MAP is going off the map.
$MAP Update. This doesn& #39;t mean it will necessarily keep mooning. Dips back into demand zone are always possible even upon breakouts.
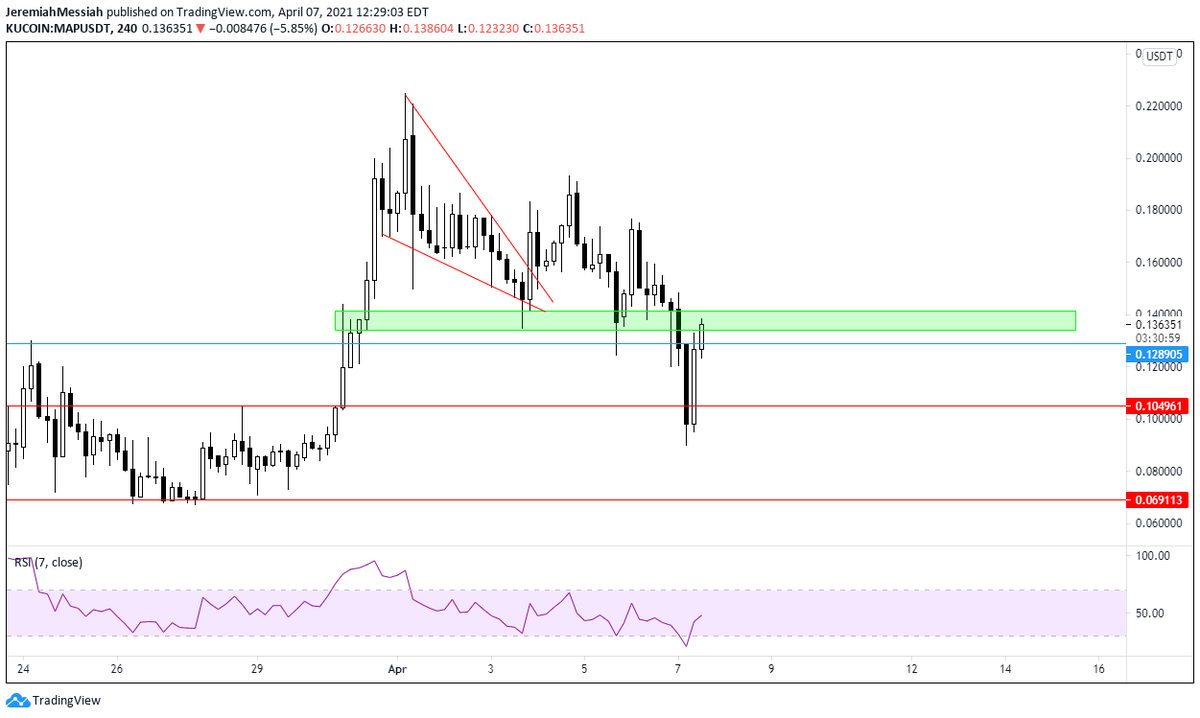
$MAP Update. Could be looking to bearish retest here. Retest of demand zone upon breakout as mentioned above looked good until $BTC decided to clap cheeks. Will be eyeing this closely.
$MAP officially my biggest bag.
Another self explanatory chart. $MAP
What did I JUST say about $MAP a couple hours ago?
$MAP Still holding this stubborn pos too.
(1) On 4H, could be break from wedge, could be descending channel. Price should be responsive to both.
(2) Dailies seeing dip into, and rejection from previous consolidation levels. Possible megaphone forming.
(3) Break on dollar pair.
(1) On 4H, could be break from wedge, could be descending channel. Price should be responsive to both.
(2) Dailies seeing dip into, and rejection from previous consolidation levels. Possible megaphone forming.
(3) Break on dollar pair.
Was going great until bitcoin decided to shit the bed again. This better not be a diamond top. $MAP
$MAP Still holding. No fucks given.
If this trendline breaks on $MAP THEN I& #39;m out. I hate to sell at 10x instead of 16x but profits are profits. Most likely I will be selling the local bottom but oh well. I& #39;ll have ammo to bid. Traders aren& #39;t investors and there& #39;s always other fish.
Sells hit.

 Read on Twitter