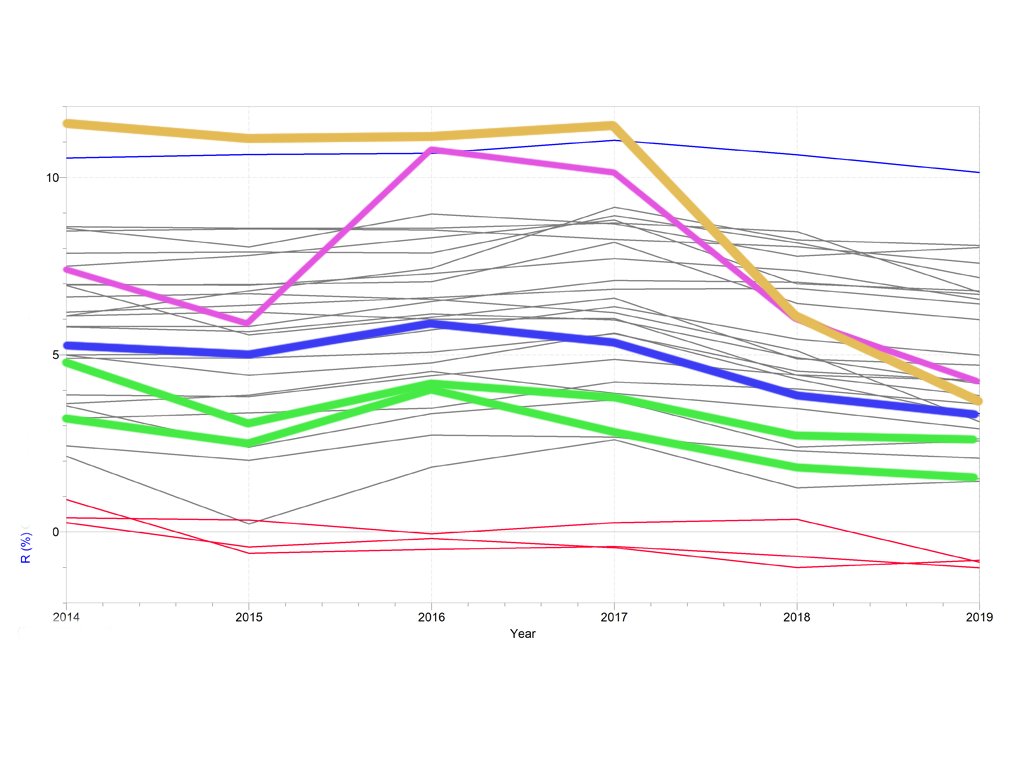
I& #39;ve made my own graph of Natural Growth Rate over time, because ignoring the death rate and only including birth rate would be very strange. I& #39;ve also started my graph at 0, just in case stretching it makes it look more crazy. (1) https://twitter.com/jnzst/status/1364530097701576706">https://twitter.com/jnzst/sta...
That gold coloured line is XJ. Still shows a huge decline in growth rate to a figure just above the national average (in blue). The green lines are the huge Urban centres of Beijing and Shanghai, both below the national average. (2)
That violet line, showing the same sized drop over the last few years, is Shandong, a 99% Han ethnic province. The thinner red ones at the bottom are the Eastern provinces of Liaoning, Jilin and Heilongjiang, showing negative growth for years. The thin blue at the top? Tibet.
If we look at figures for the drop in NGR from 2016, we see that XJ (67%) is similar to both Shanghai (63%) and Shandong (61%). Jilin& #39;s NGR has dropped by 1300% since the last time it was positive (2014).
You can still ask why XJ, representing 1.7% of the population of China, has had a big drop in growth rate. I would be asking why the growth rate was such an outlier in the first place. Tibet is obvious as it is the most rural area still. How much of XJ population has become urban
Does the principle of & #39;reverting to the norm& #39; apply? How much of the reproductive age population has moved away from rural areas where the family planning policies are more relaxed?
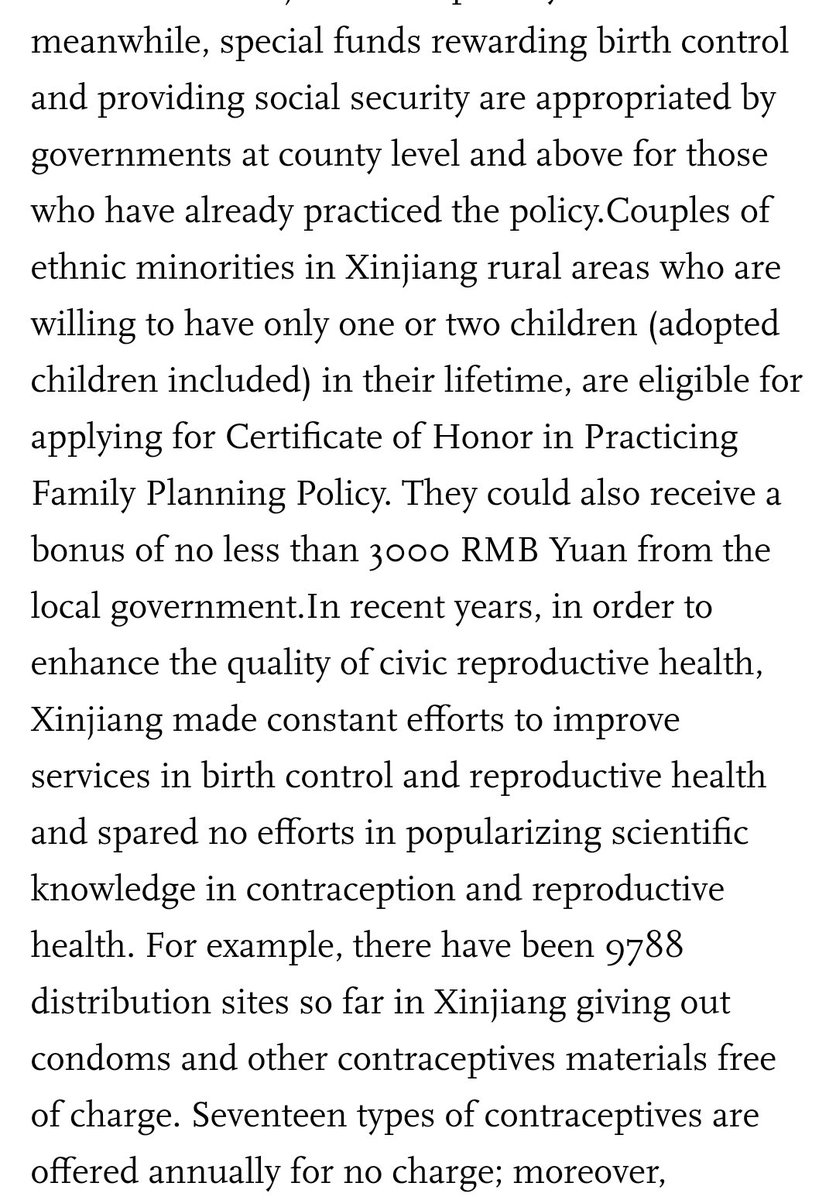
So what has happened in XJ since 2017? Better education, stricter enforcement of family planning laws, incentives given for smaller families and free contraceptives.
Before 2017 the growth rate was far bigger than could possibly be allowed under the nationwide family planning laws. It& #39;s as simple as that. Now, the population of XJ has equal treatment under the law, and the NGR is coming closer to the national average.

 Read on Twitter


