$BTC, $ETH and $ALTS keep going up, but where does it stop?
Today I want to teach you how I derive my price targets and take profit levels using Fibonacci.
This method is not 100% accurate but very insightful nonetheless.
Today I want to teach you how I derive my price targets and take profit levels using Fibonacci.
This method is not 100% accurate but very insightful nonetheless.
Fibonacci numbers are based on the golden ratio. I don& #39;t understand it all too well, but that doesn& #39;t matter.
All I need to know is how it works and what it does.
Usual disclaimer, this thread is my personal opinion on the matter, not financial advice.
All I need to know is how it works and what it does.
Usual disclaimer, this thread is my personal opinion on the matter, not financial advice.
So what is Fibonacci?
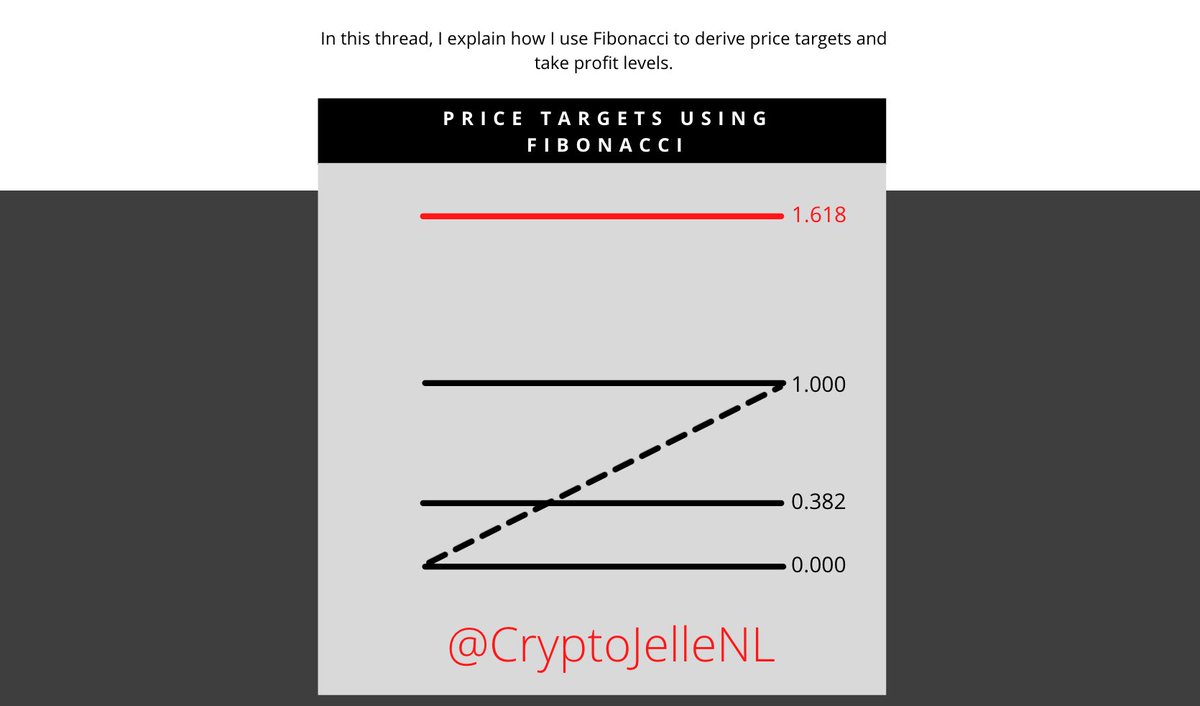
Fibonacci deals in how much of a move has been retraced, or how much further price has moved. The official percentages in Fibonacci are 23.6%, 38.2%, 61.8% and 78.6%. The 50% level is often added to mark the middle of a range.
Fibonacci deals in how much of a move has been retraced, or how much further price has moved. The official percentages in Fibonacci are 23.6%, 38.2%, 61.8% and 78.6%. The 50% level is often added to mark the middle of a range.
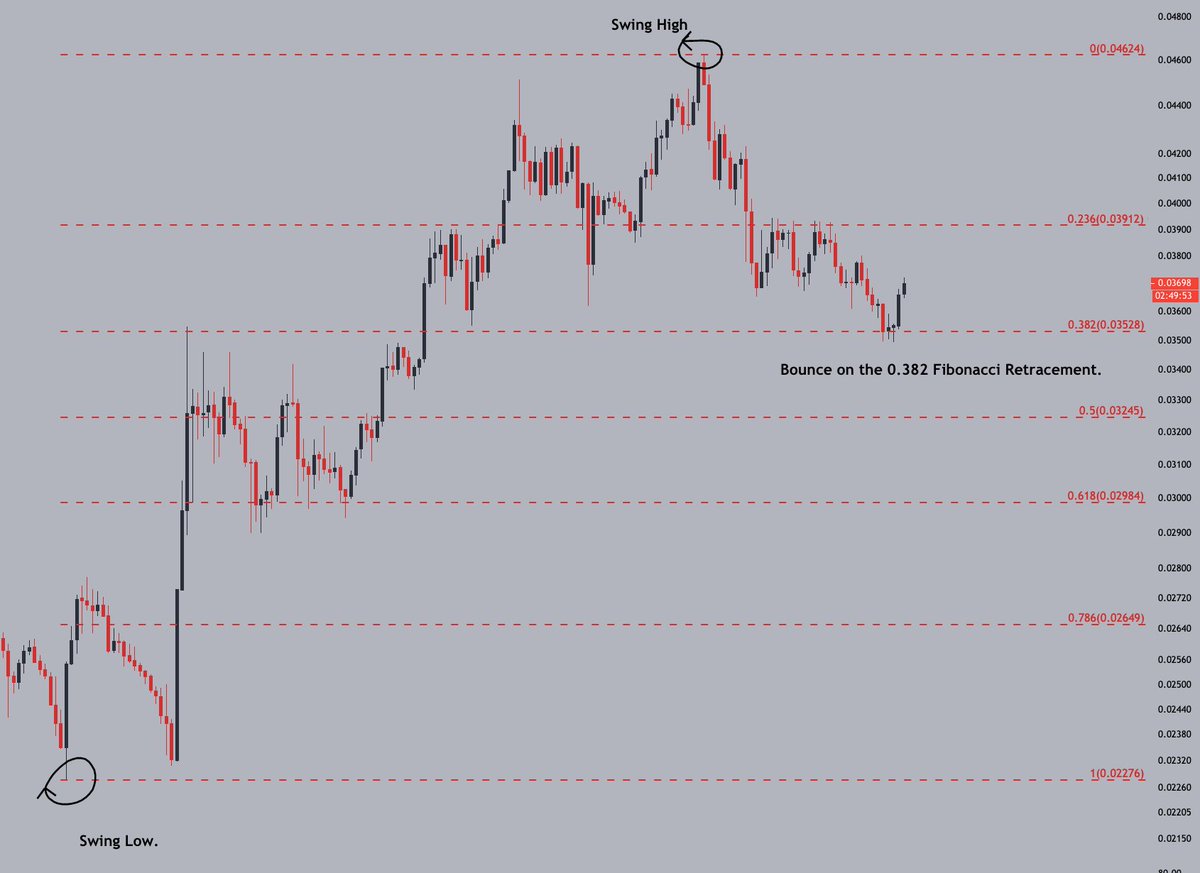
These percentages can be used to draw psychological support levels. In the example below, you see the Fibonacci levels on ETHBTC.
You place the Fibonacci tool by first clicking the swing low, followed by the swing high. In doing so, one does always work their way to the right.
You place the Fibonacci tool by first clicking the swing low, followed by the swing high. In doing so, one does always work their way to the right.
As the above example shows, the 0.382 fib retracement acted as support on the impulse down.
I like to use fibs combined with support and resistance levels (explained in the linked thread), trendlines or other technical analysis tools. https://twitter.com/CryptoJelleNL/status/1357696153102540801?s=20">https://twitter.com/CryptoJel...
I like to use fibs combined with support and resistance levels (explained in the linked thread), trendlines or other technical analysis tools. https://twitter.com/CryptoJelleNL/status/1357696153102540801?s=20">https://twitter.com/CryptoJel...
Ideally, the fib level coincides with one of the other technical analysis tools. This is called confluence.
For example, a trendline, S&R and fib level meet at a certain point.
This means there& #39;s high confluence support at that point, and price is more likely to bounce there.
For example, a trendline, S&R and fib level meet at a certain point.
This means there& #39;s high confluence support at that point, and price is more likely to bounce there.
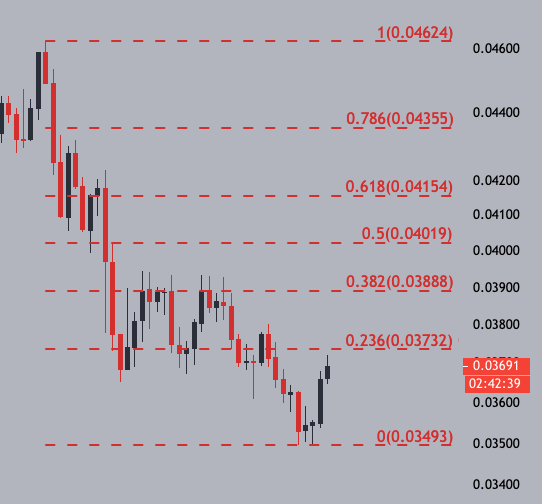
This also works for deriving resistance levels. This concept works very similarly, only that you work your way down from the swing high to swing low.
The 0.236 level is the first level of resistance. This level means that 23.6% of the impulse down would be retraced, once hit.
The 0.236 level is the first level of resistance. This level means that 23.6% of the impulse down would be retraced, once hit.
This is all very interesting, but we don& #39;t see a lot of ranging in the current conditions. You& #39;re here for price targets, not ranges.
Luckily, there& #39;s something called the Fibonacci extension, which deals in expansion from a range.
Luckily, there& #39;s something called the Fibonacci extension, which deals in expansion from a range.
You get to these levels by drawing the Fibonacci resistance levels, from swing high to swing low.
In the tools settings, you select your levels.
I like to use the 1.618, 2.618 and 4.618 extension, but the .272 versions of these also work well for me.
This is pure preference.
In the tools settings, you select your levels.
I like to use the 1.618, 2.618 and 4.618 extension, but the .272 versions of these also work well for me.
This is pure preference.
Here& #39;s $ETHUSD as an example. The 1.618 Fibonacci extension lies at 2247 USD. A reasonable first target for $ETH can therefore be placed at $2250.
With this method, you derive targets while in price discovery.
With this method, you derive targets while in price discovery.
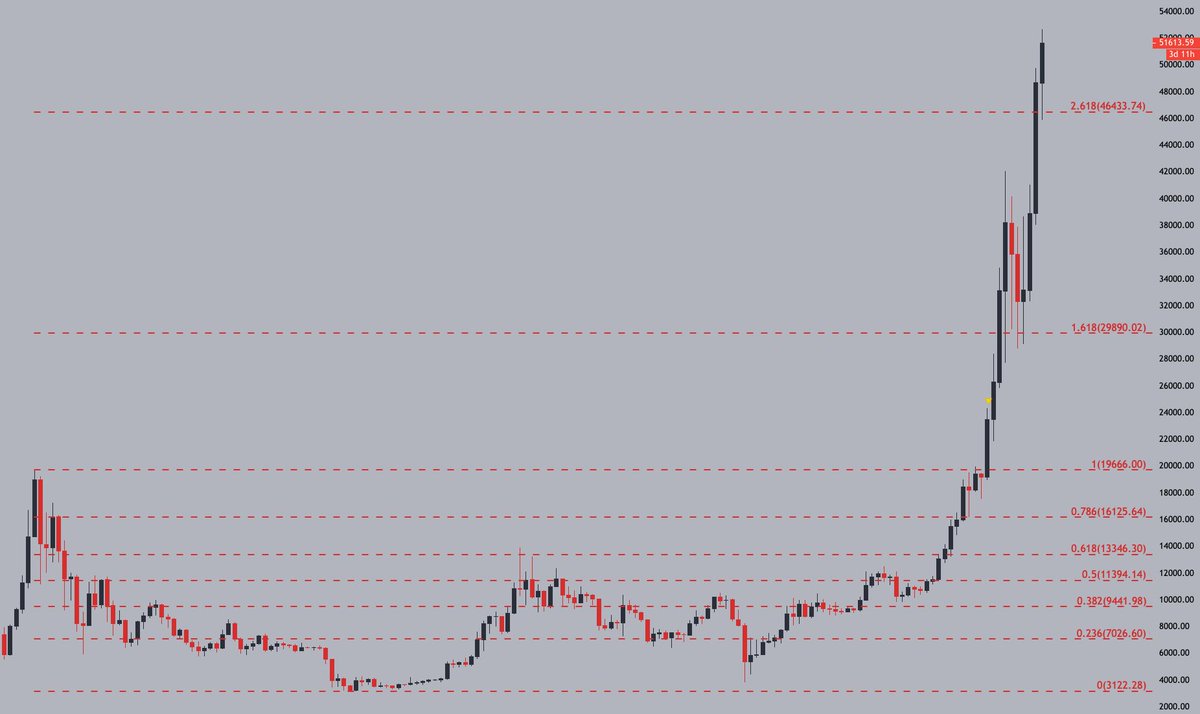
However, this doesn& #39;t work 100% of the time. Here& #39;s $BTC, that completely ignored both levels on the way up, provided clean retests of the levels and continued upwards.
How do you deal with this?
How do you deal with this?
This is where my thread on taking profits comes in. Never sell your full stack at T1, but sell parts of your exposure and let the rest run.
I have linked the thread on taking profits below, in case you want to read more. https://twitter.com/CryptoJelleNL/status/1359190185389522952?s=20">https://twitter.com/CryptoJel...
I have linked the thread on taking profits below, in case you want to read more. https://twitter.com/CryptoJelleNL/status/1359190185389522952?s=20">https://twitter.com/CryptoJel...
So - this is how I use Fibonacci to derive price targets. I scale out in increments and let the rest run to the next target.
If you have any questions, do not hesitate to ask. If you need an exchange, join me on FTX. I got you a 5% discount on fees :) #a=cryptojellenl">https://ftx.com/ #a=cryptojellenl">https://ftx.com/...
If you have any questions, do not hesitate to ask. If you need an exchange, join me on FTX. I got you a 5% discount on fees :) #a=cryptojellenl">https://ftx.com/ #a=cryptojellenl">https://ftx.com/...

 Read on Twitter


