What is Relative Strength (RS) and how to identify it (Thread)
Focusing on stocks exhibiting strong Relative Strength is one of the keys to achieving superior returns. This is one of the core ideas of #CANSLIM
In one sentence showing RS means outperforming other stocks both during market uptrends and downtrends.
In one sentence showing RS means outperforming other stocks both during market uptrends and downtrends.
In this thread we will cover examples, how to spot it, and how to use it to make sure you are in the top stocks.
If you want to outperform the indexes, logic says you have to be invested in stocks doing the same.
If you want to outperform the indexes, logic says you have to be invested in stocks doing the same.
First Some Basic Terminology:
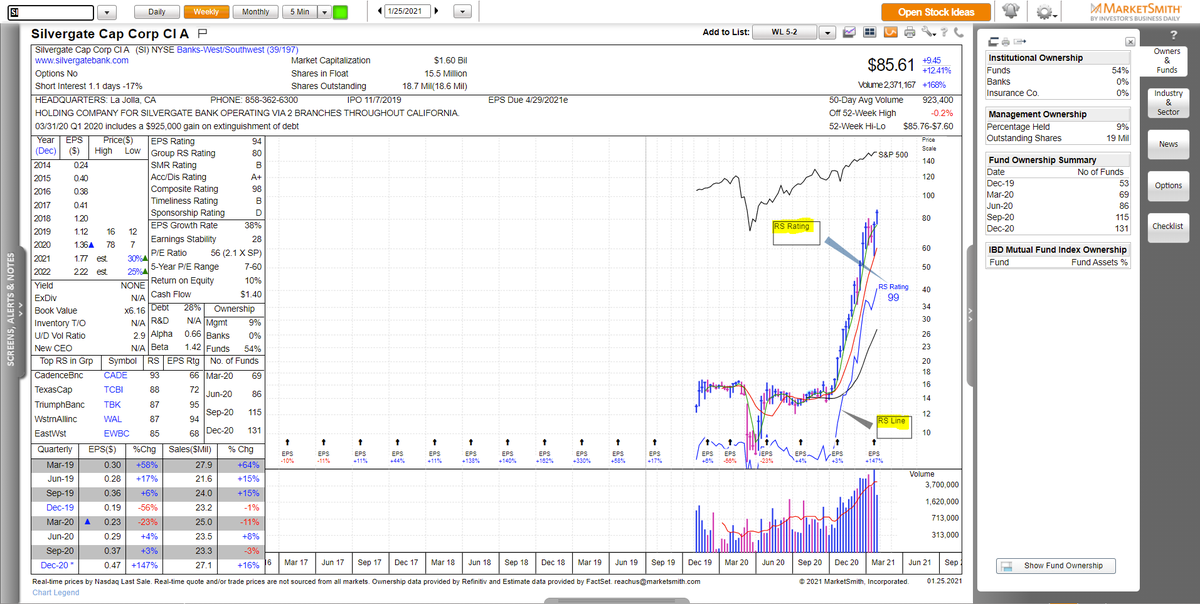
RS Rating: @IBDinvestors Proprietary measure of RS scored 1-99. Stocks with an RS rating of 80 have outperformed 80% of stocks over the past year.
RS Line: The Line plotted by dividing each day’s stock price/ price of the SPX.
RS Rating: @IBDinvestors Proprietary measure of RS scored 1-99. Stocks with an RS rating of 80 have outperformed 80% of stocks over the past year.
RS Line: The Line plotted by dividing each day’s stock price/ price of the SPX.
The value of the RS line itself does not mean anything, but the trend of this line is very important.
-Note RSI (Relative strength index) is something completely unrelated to the concept of this thread.
-Note RSI (Relative strength index) is something completely unrelated to the concept of this thread.
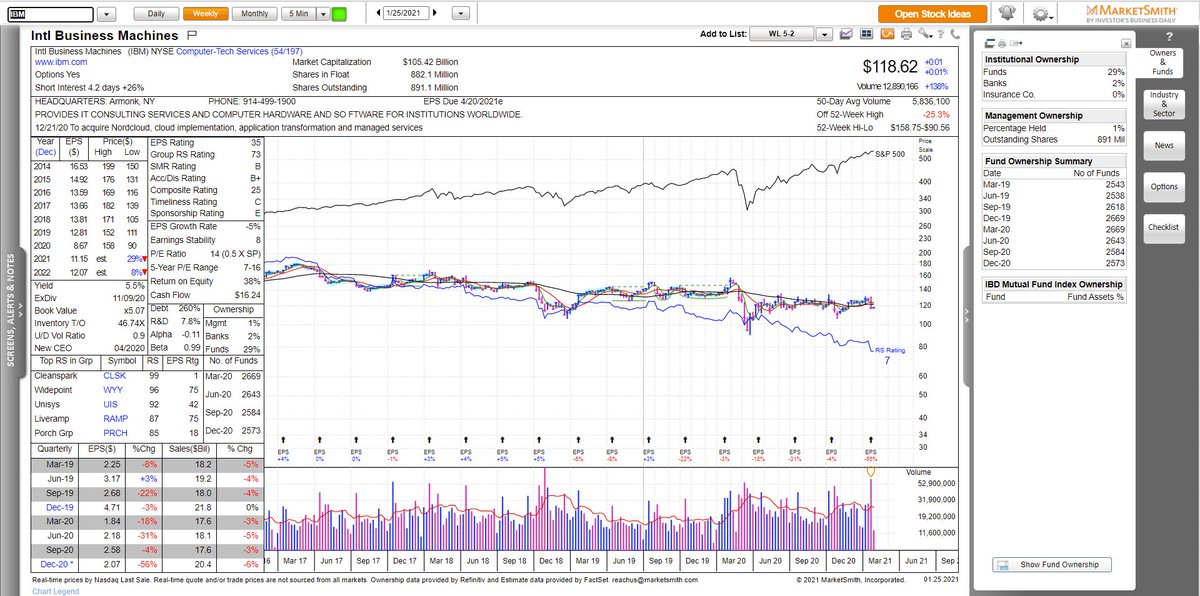
RS is the result of supply and demand. Stocks with poor RS are in a distributive phase by major players and institutions. During corrections, such stocks will be sold first instead of accumulated. $IBM is an example of poor RS.
RS rating: 7, decreasing RS line
RS rating: 7, decreasing RS line
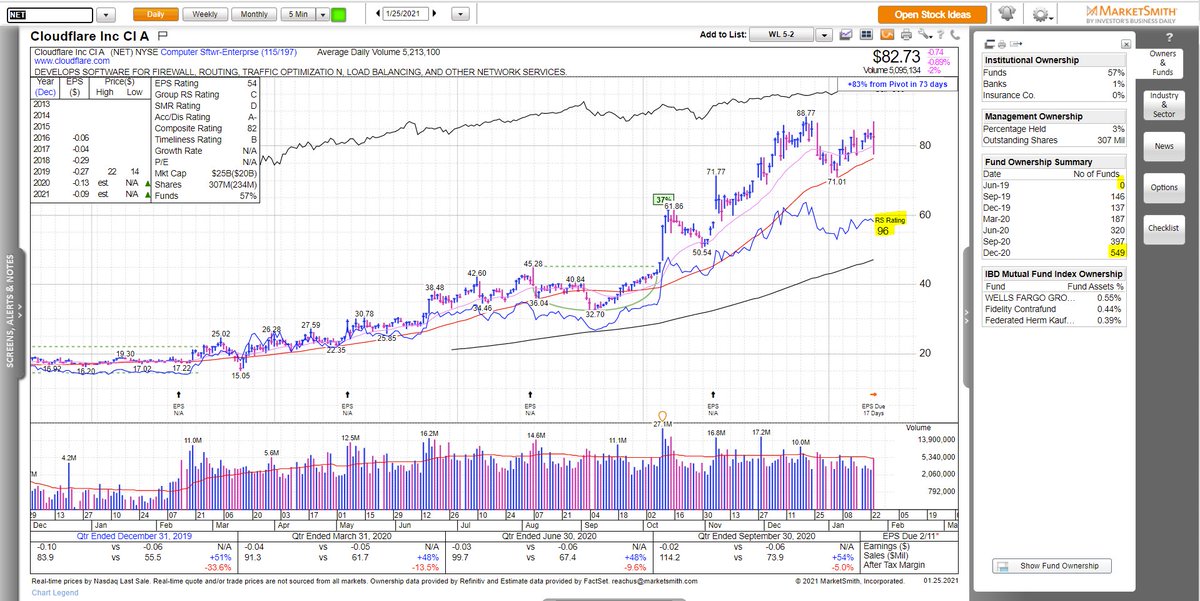
Strong RS on the other hand is shown by stocks that are under accumulation. Funds are tripping over each other to build positions. This results in the stock price being “supported” even during market turbulence.
NET is an example
RS rating of 98, https://abs.twimg.com/emoji/v2/... draggable="false" alt="⬆️" title="Upwards arrow" aria-label="Emoji: Upwards arrow"> RS line and # of funds.
NET is an example
RS rating of 98,
So how can you identify Relative strength?
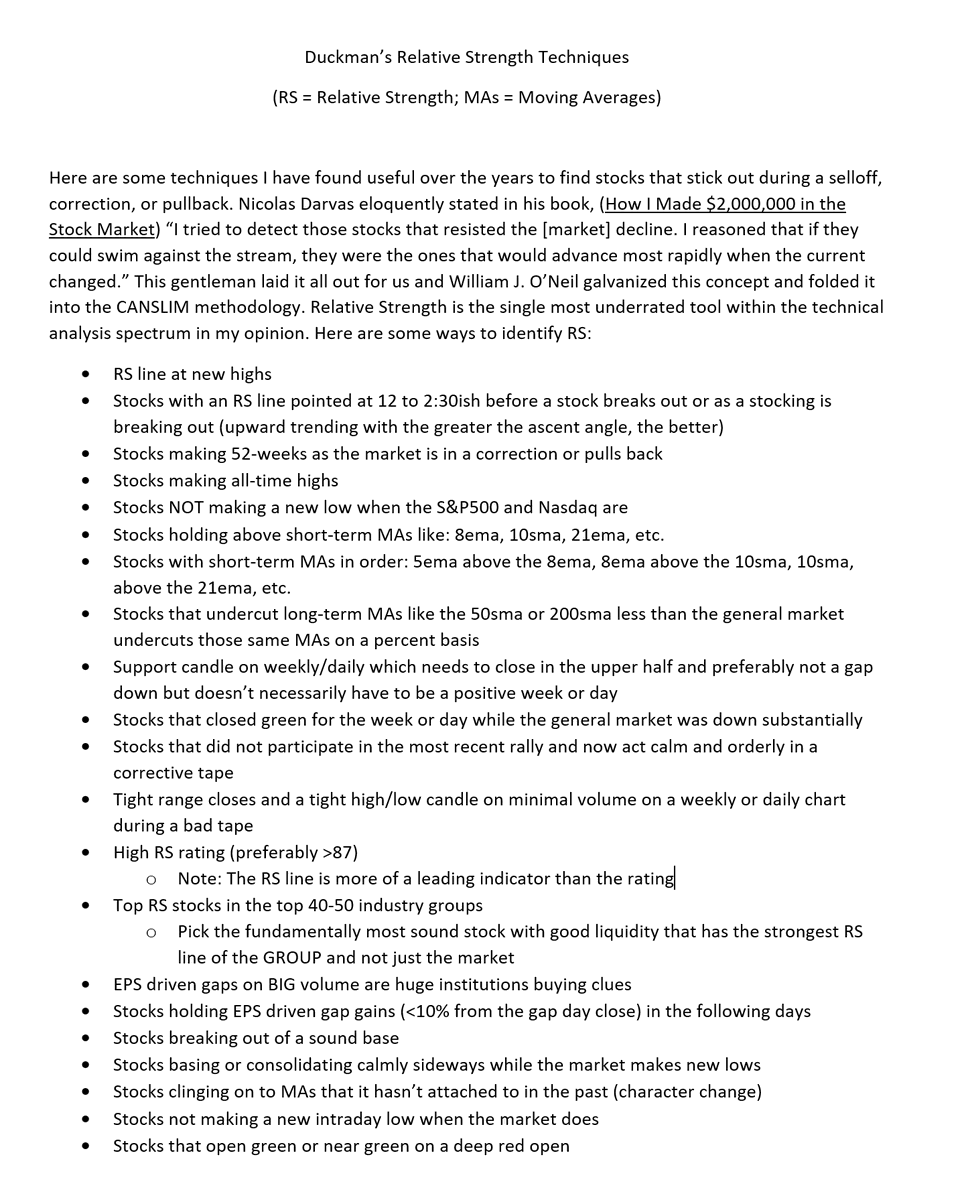
There are many different ways summarized extremely well by @duckman1717 in the document below and I will expand on a couple of these concepts.
There are many different ways summarized extremely well by @duckman1717 in the document below and I will expand on a couple of these concepts.
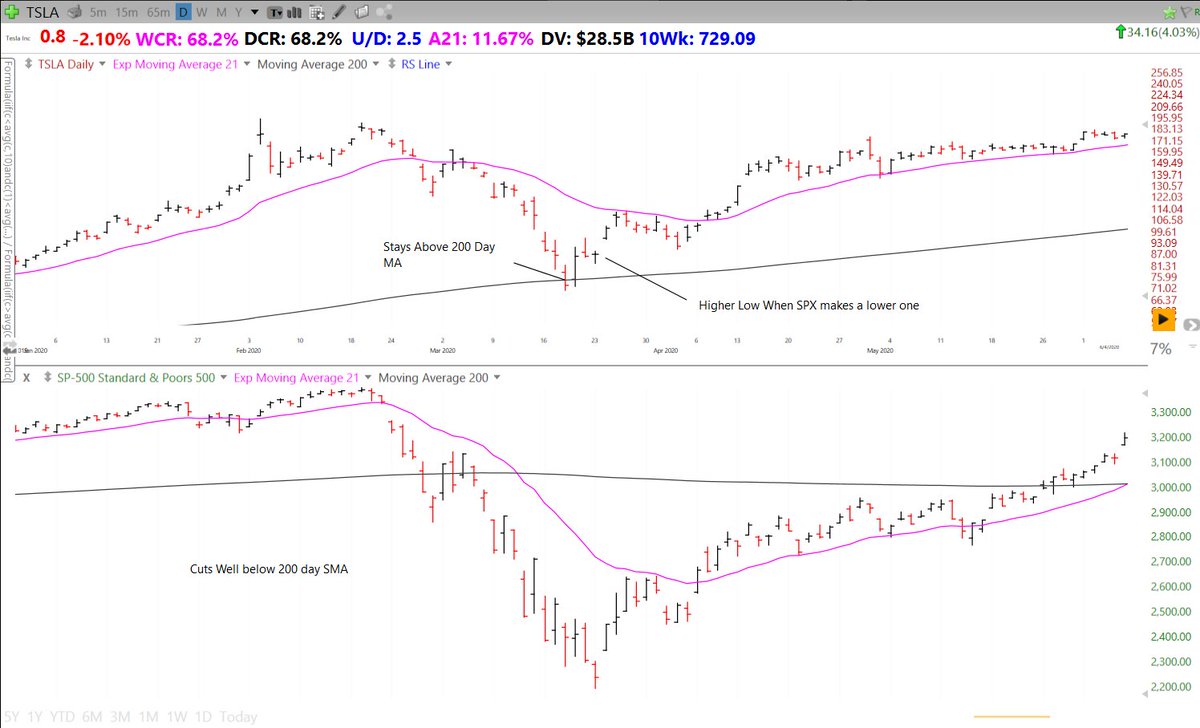
First Case Study: $TSLA
Makes a higher Low when the SPX makes a lower one
Stays above 200day SMA while SPX undercuts by 28%
The Leaders often bottom before the indexes
$TSLA increased 800% from this point in 9 months
Makes a higher Low when the SPX makes a lower one
Stays above 200day SMA while SPX undercuts by 28%
The Leaders often bottom before the indexes
$TSLA increased 800% from this point in 9 months
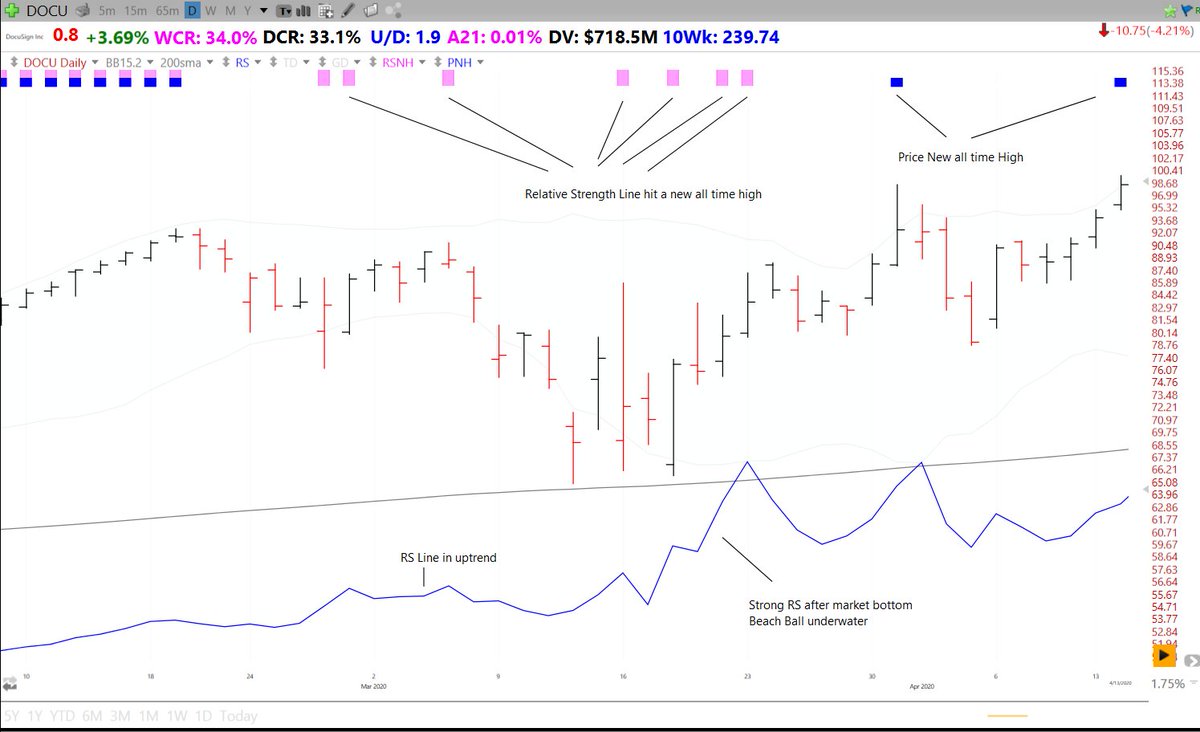
2nd Case Study: $DOCU
Higher Low again
RS Line hitting new all time highs during correction
Strong bounce once market pressure lifts
Broke out to new all time highs shortly after correction
$DOCU increased 120% in 3 months
Higher Low again
RS Line hitting new all time highs during correction
Strong bounce once market pressure lifts
Broke out to new all time highs shortly after correction
$DOCU increased 120% in 3 months
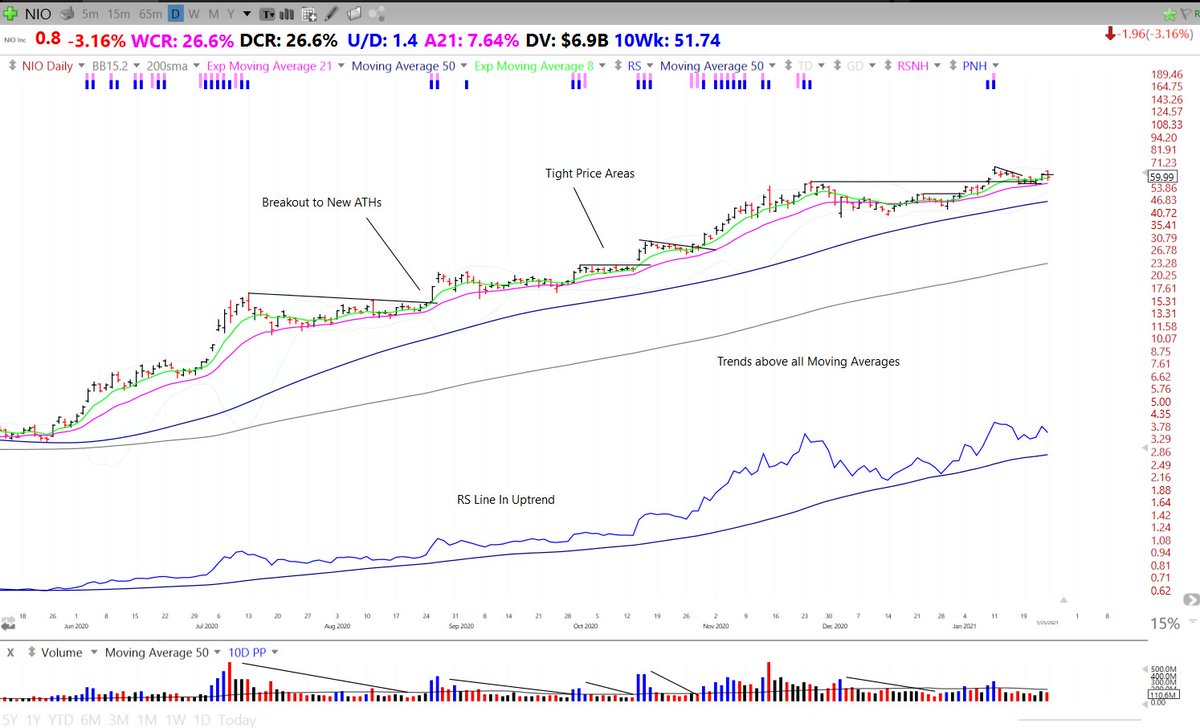
3rd Case Study $NIO
Trends above all Key Moving Averages
RS Line in Uptrend
Forms Tight Price areas then breaks out.
Pullbacks are on lower volume than advances
Increased 1000% in 6 months while trending with the 21ema
Trends above all Key Moving Averages
RS Line in Uptrend
Forms Tight Price areas then breaks out.
Pullbacks are on lower volume than advances
Increased 1000% in 6 months while trending with the 21ema
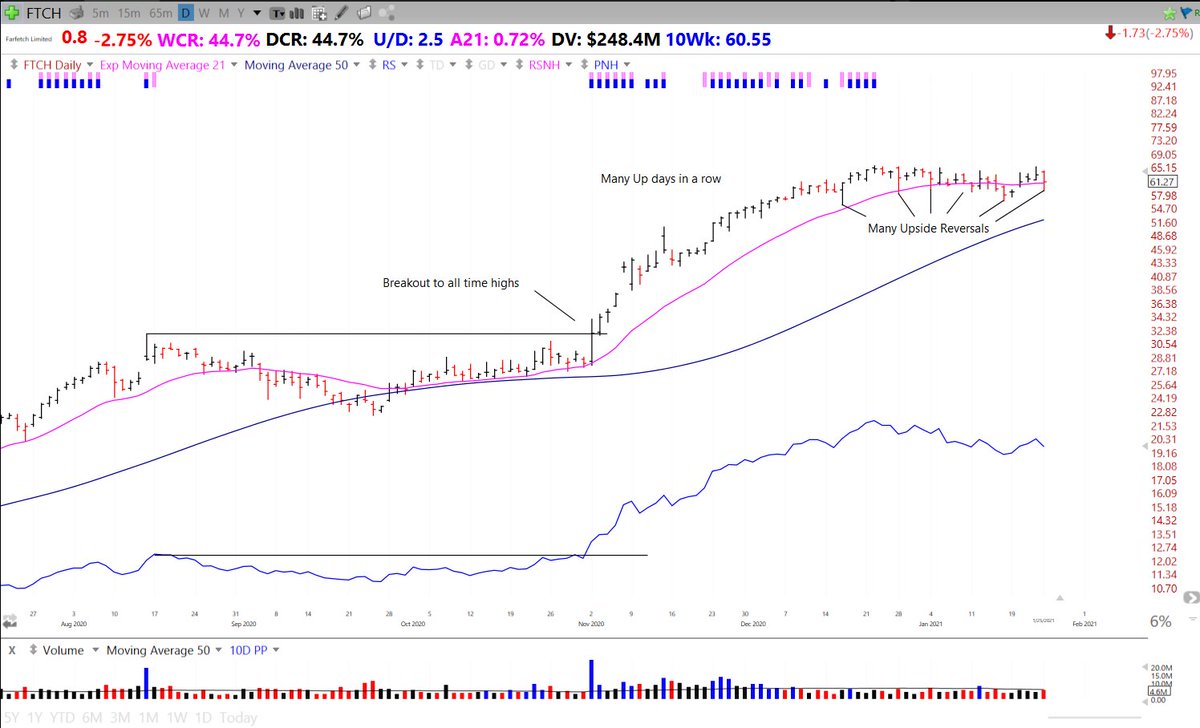
4th Case Study $FTCH
Breakout on large volume to all time highs
Many up days in a row
Upside reversals near the bottom of price consolidations
Tight price action during correction and right before BO
Increased 100% in 1.5 months from the breakout
Breakout on large volume to all time highs
Many up days in a row
Upside reversals near the bottom of price consolidations
Tight price action during correction and right before BO
Increased 100% in 1.5 months from the breakout
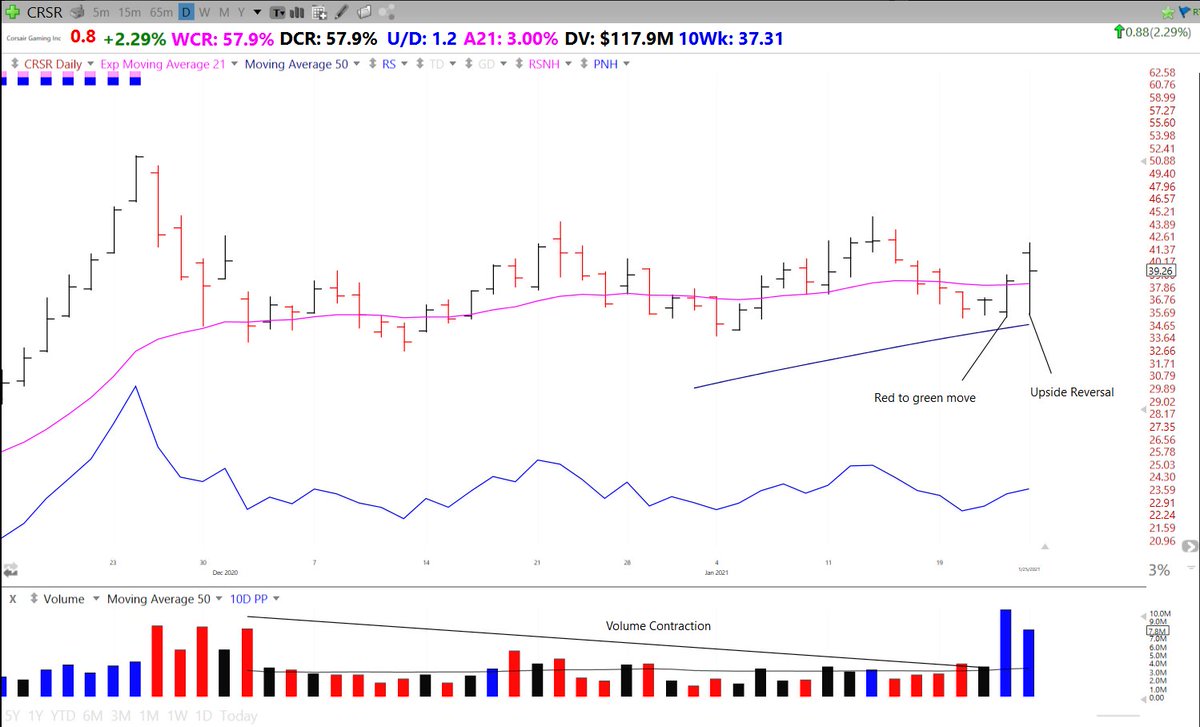
5th Case Study: $CRSR
Red to green move on a gap down day
Upside reversal
Prior Uptrend and Volume Contraction within base
Red to green move on a gap down day
Upside reversal
Prior Uptrend and Volume Contraction within base
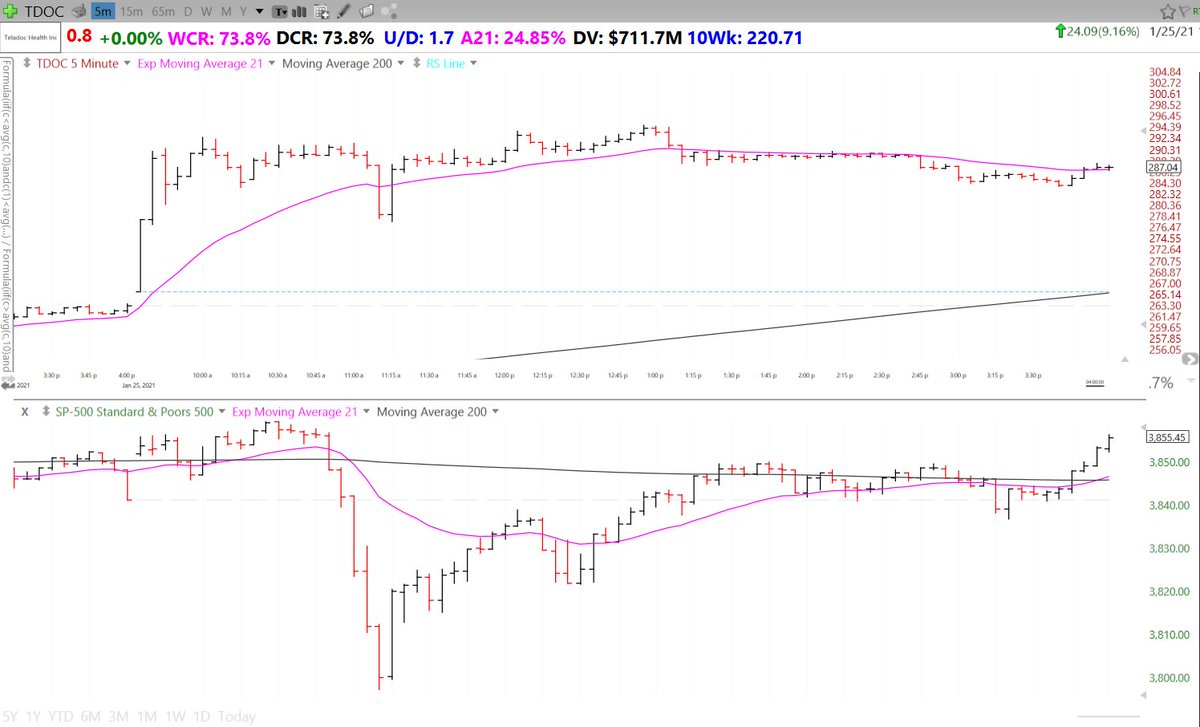
These same concepts hold true on shorter timeframes. $TDOC today showed RS for much of the day as it ignored the market intraday pullback for the most part
5 minute chart with SPX comparison
5 minute chart with SPX comparison
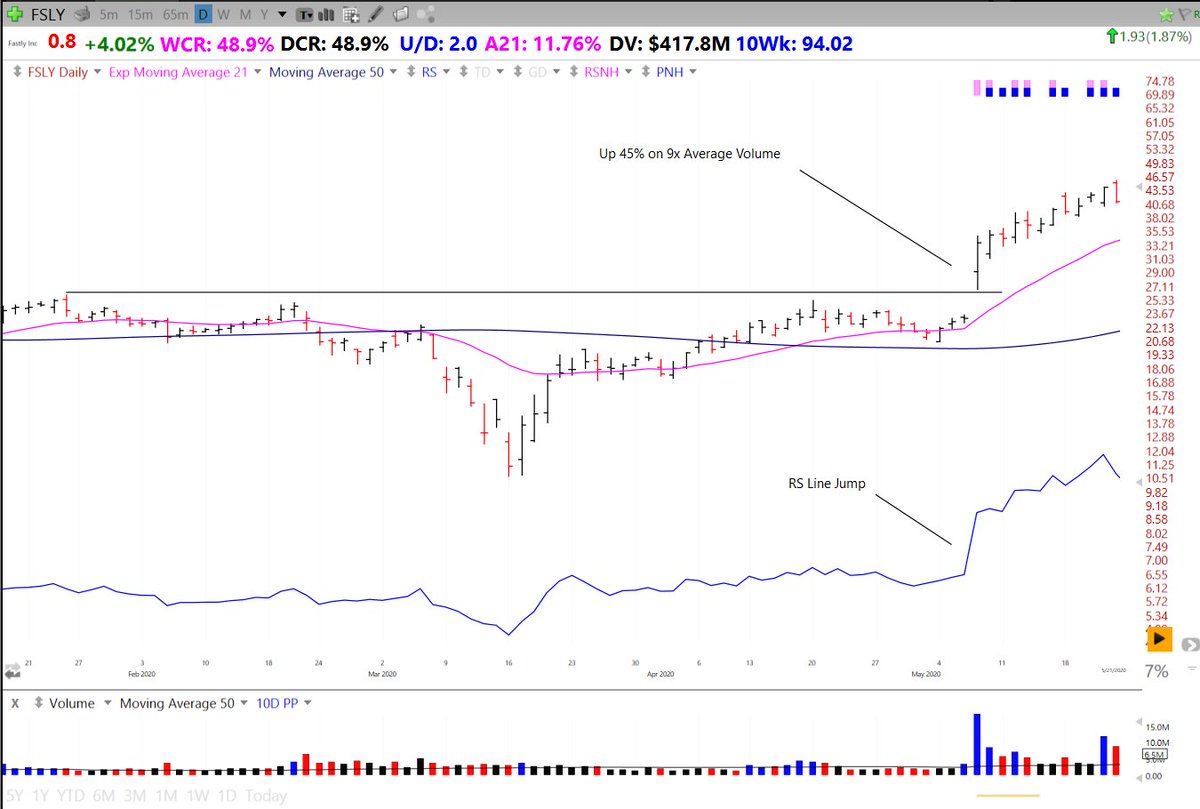
Also take note of #RS changes in character, these can make the start of a strong uptrend/downtrend
For instance:
- Earnings gap ups from Bases on large volume
- Newfound respect for a key moving average
Avoid
- Gap downs on large volume
- Breaking previously respected KMAs
For instance:
- Earnings gap ups from Bases on large volume
- Newfound respect for a key moving average
Avoid
- Gap downs on large volume
- Breaking previously respected KMAs
General #RelativeStrength Signs. These are indications that institutions are supporting a stock
- Red to green moves
- Green on Red days
- High DCR +WCR compared to $SPX
- Closing well off lows
- Tight price action compared to $SPX
- RS line https://abs.twimg.com/emoji/v2/... draggable="false" alt="⬆️" title="Upwards arrow" aria-label="Emoji: Upwards arrow">
- Pullbacks are on low vol
- Red to green moves
- Green on Red days
- High DCR +WCR compared to $SPX
- Closing well off lows
- Tight price action compared to $SPX
- RS line
- Pullbacks are on low vol
So now how should you use RS?
- Pick stocks with increasing RS Lines + other Signs of RS
- On red days track what is showing RS
- During corrections cut weak stocks first
- During Bear Markets track RS signs- Future Leaders
- Pick stocks with increasing RS Lines + other Signs of RS
- On red days track what is showing RS
- During corrections cut weak stocks first
- During Bear Markets track RS signs- Future Leaders
I hope you found this thread helpful and if so feel free to check out my other ones and retweet: https://twitter.com/RichardMoglen/status/1353829147257294848?s=20">https://twitter.com/RichardMo...
https://twitter.com/RichardMoglen/status/1299726484593147906?s=20">https://twitter.com/RichardMo...
https://twitter.com/RichardMoglen/status/1324813953474678787?s=20">https://twitter.com/RichardMo...
https://twitter.com/RichardMoglen/status/1334966057795276800?s=20">https://twitter.com/RichardMo...

 Read on Twitter
 RS line and # of funds." title="Strong RS on the other hand is shown by stocks that are under accumulation. Funds are tripping over each other to build positions. This results in the stock price being “supported” even during market turbulence. NET is an example RS rating of 98, https://abs.twimg.com/emoji/v2/... draggable="false" alt="⬆️" title="Upwards arrow" aria-label="Emoji: Upwards arrow"> RS line and # of funds." class="img-responsive" style="max-width:100%;"/>
