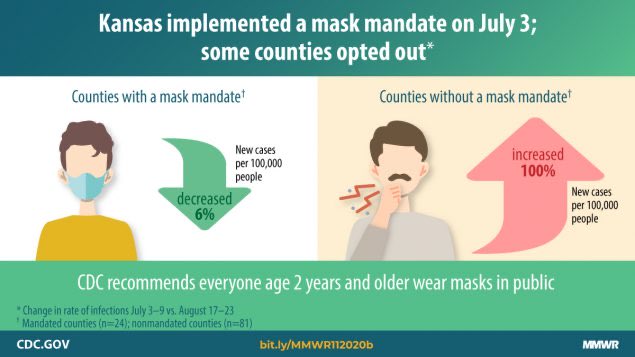
So here’s a thread on the sleight of hand that the CDC pulled with their Kansas masks “study”
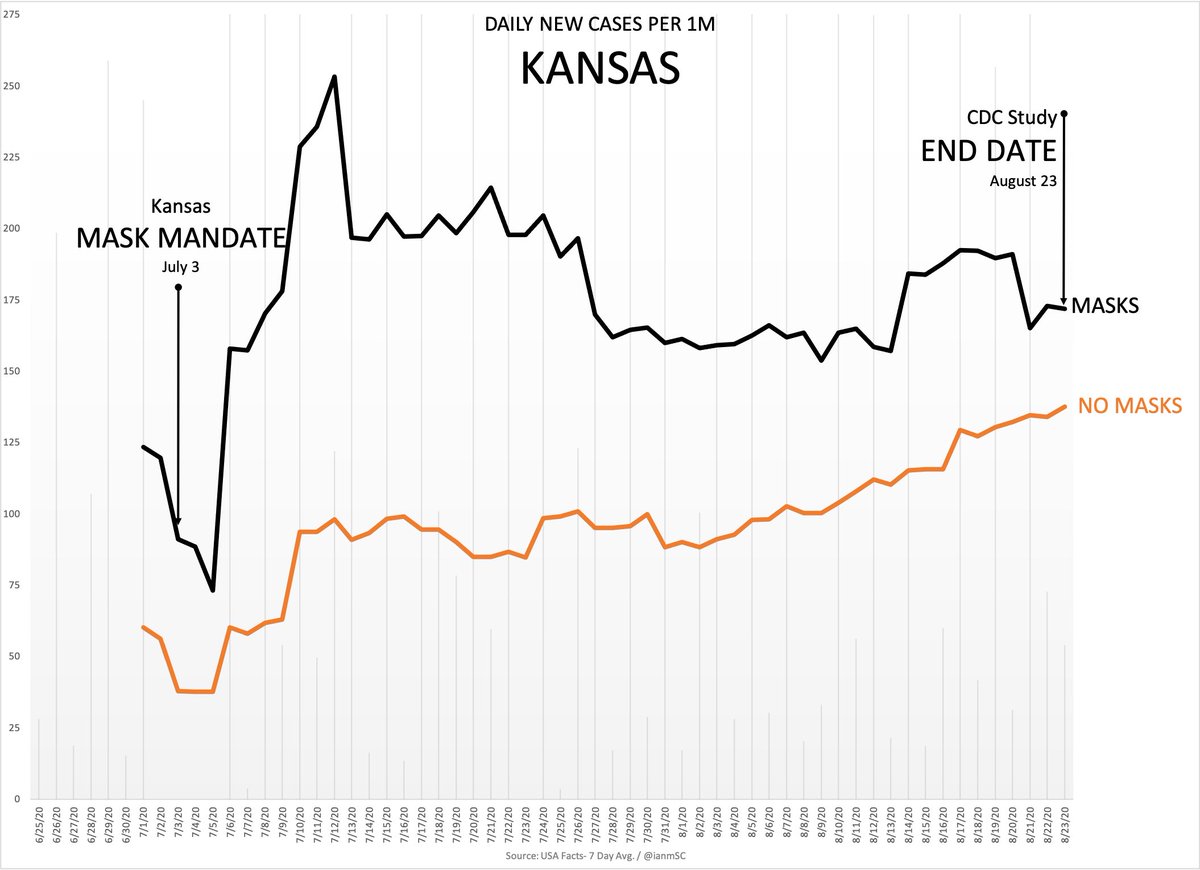
Mask mandate counties are in black, no masks in orange.
Cases in the mask counties were always higher than in the non mask counties.
Mask mandate counties are in black, no masks in orange.
Cases in the mask counties were always higher than in the non mask counties.
So here’s what they did. Instead of comparing the case rate growth from 7/3 when the mandate started, they chose to start on 7/9, AFTER the masked counties had seen a huge increase.
The 7-day average on 7/3 was 91 per 1M. On 7/9 it was 178 per 1M. They chose to start from 178.
The 7-day average on 7/3 was 91 per 1M. On 7/9 it was 178 per 1M. They chose to start from 178.
What that allowed them to do was claim a 6% decrease since the mask mandate, because they got to ignore the 96% growth in the first week afterwards, giving themselves a higher baseline to start from
If you take the starting date of 7/3 and the ending date of 8/23, the case rate growth in the masked counties was 89%. If you start on 7/9, it’s a 6% decrease.
See how much fun it is when you choose the beginning and end dates?
See how much fun it is when you choose the beginning and end dates?
So we can do that too, if you choose a start date of 7/3 and an end date of 7/12, cases in masked counties went up 178%, vs. only 158% growth in non-masked counties.
It’s another piece of atrociously bad “science” by an organization that has specialized in that all year

 Read on Twitter


