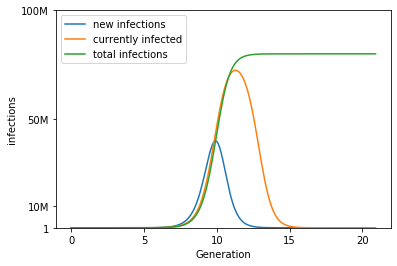
Right now, people are talking a lot about the "sigmoid" which supposedly shows that we are almost done and there is nothing happening anymore. Most notably @SHomburg in Germany. So, lets model it, right?
As a proper scientist, we have to describe our model and discuss its limitations, so before we talk about what we see, we have to talk about what we model.
Lets start by assuming that we have an infinite population of people on earth and everyone is meeting people kind of randomly. Especially we assume that people don& #39;t live on islands or live a solitary life
Under this assumption, we can say that each human infects on average 2 other people within 4 days until he quarantines. This factor is what we call R0. And the time-span this happens in is what we call a Generation.
Under these very simplified assumptions, we can say that if at generation G0 we have 1k infected, in the next generation G1, 4 days later, we have R0*1k=2k people infected. At G2, we have R0*2k=4k people infected and so on.
At generation n, we have 1k*R0^n people infected- exponential growth. Of course, if we do the math and take a population of 80 million people, we will realize that at some point we have more infected than people living - *gasp* our model is wrong. There can& #39;t be unlimited growth.
So how do we fix it? Well, we just take into account that if someone is infected, he/she can& #39;t be infected again. So if a contact happens that would normally induce an infection, it will fizzle out if that person has already been infected.
how do we model that? Well if R0 is 2 and 50% had the virus already, we can just argue that on average 1 of the 2 infections does fizzle out. So we multiply R0 with the fraction of uninfected people. This number is what we call R1:
R1 = R0*(1-infected/TotalPop)
R1 = R0*(1-infected/TotalPop)
TotalPop I set to 80 million, because i am German.
And Tada, we obtain a sigmoid, because, when enough people are infected, growth will slow down
And Tada, we obtain a sigmoid, because, when enough people are infected, growth will slow down
The last graph is simply just counting the new infections over 3 days.
The model is not perfect. For example we don& #39;t model that people get healthy again, which slightly reduces the slope of exponential growth.
The model is not perfect. For example we don& #39;t model that people get healthy again, which slightly reduces the slope of exponential growth.
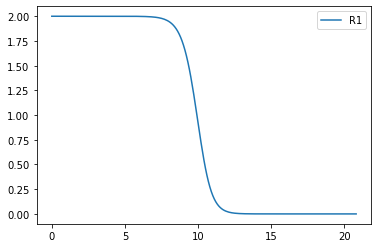
This can be corrected by a different choice of R0, we chose 2, in reality it is closer to 3. I have also plotted R1 over time:
So, we see initially nothing happens to R1, it remains close to R1, until a significant portion of people are infected. R1 is reaching 1 as 50% are infected, this is the point where growth will come to a natural halt
each generation will produce less infected than the generation before since most of the infection contacts fizzle out and some infected won& #39;t infect anyone else.
but realize that this point happens only after 50% of the population HAVE ALREADY BEEN INFECTED. That is 40 million people in our example.
This is far, FAR, FAR away from the current infection numbers. Thus all effects we see are only and solely BECAUSE WE STAY AT HOME
This is far, FAR, FAR away from the current infection numbers. Thus all effects we see are only and solely BECAUSE WE STAY AT HOME
i took the time and fix the model to base infection rate on currently sick people. Now, this does not really change the shapes, but a little bit of the height. I assume people are sick for 3 Generations, so 12 days.
so, what are the limitations?
well, mostly that we don& #39;t model connectivity of people. E.g. we dont model difference between city/countryside and don& #39;t take the distributions into account. This affects R0 as that is different depending on how many people are met on average
well, mostly that we don& #39;t model connectivity of people. E.g. we dont model difference between city/countryside and don& #39;t take the distributions into account. This affects R0 as that is different depending on how many people are met on average
The no-island assumption is okay, because in reality people are connected quite densely. e.g. a mother with child (in school age) is connected via its child to 30 other kids, which each are connected to 1.7 parents, which each are connected to 10 coworkers, their childs and so on
within 10-15 hops you are probably connected to almost everyone in your country. And this does not take random meeting of people in public transport into account.
further, the very naive model i described has discrete time-points one for each generation. Of course, this should be more fine-grained, e.g. splitting each generation in 10 steps to model a more continuous time-scheme. This is already fixed in the graphs i have shown.
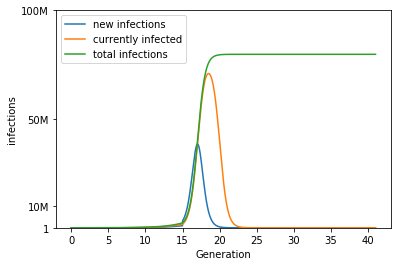
Of course, we also don& #39;t model interventions. Lets assume we lock down at generation 5 and reopen at 15.

 Read on Twitter


