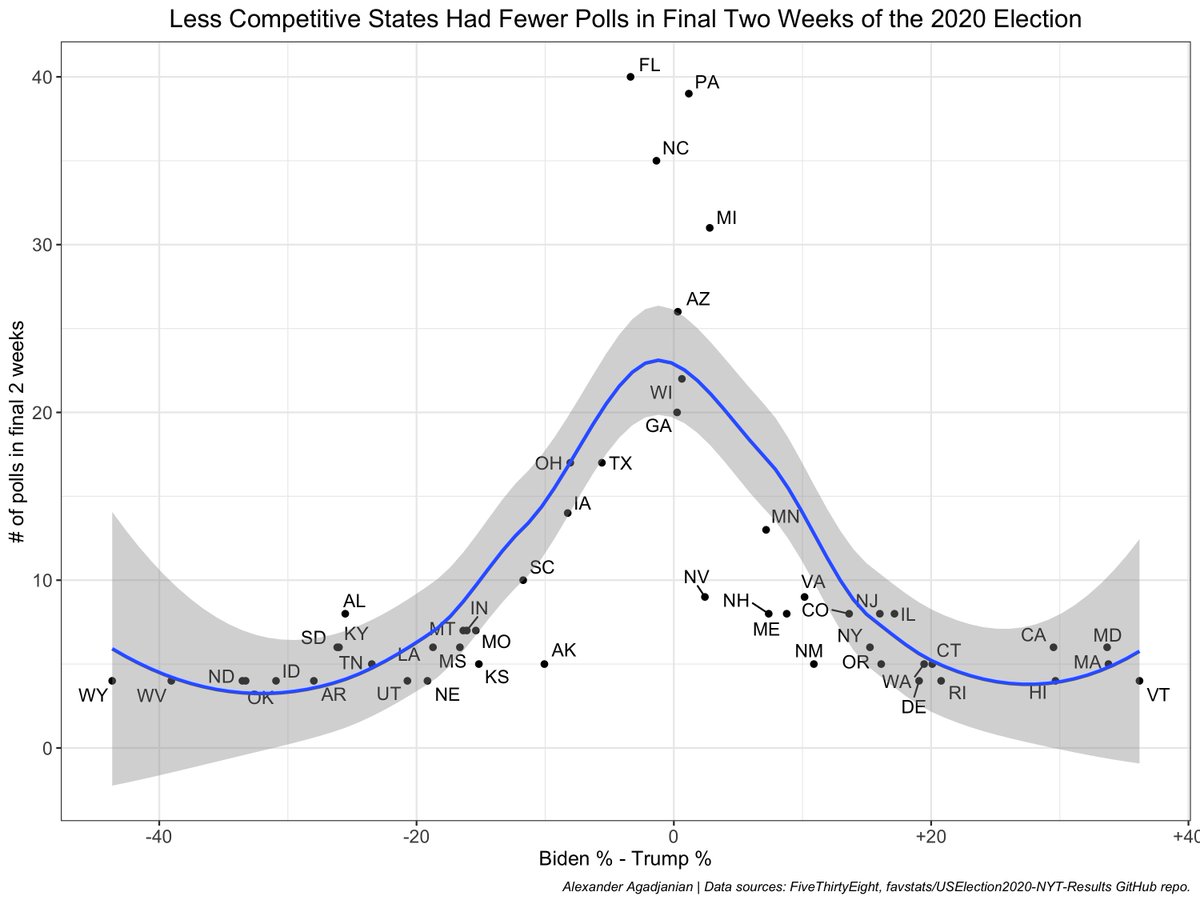
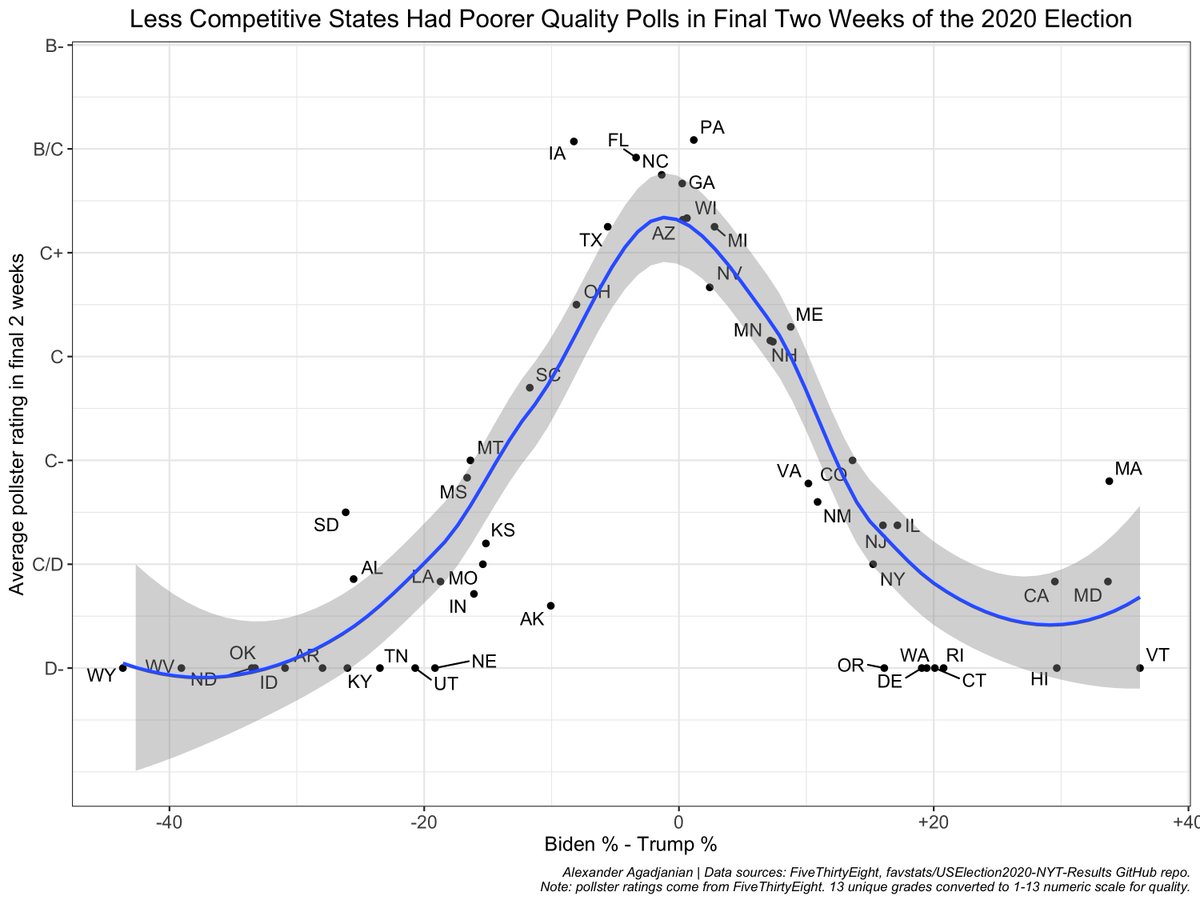
Analyses of 2020 polling error often find that error was largest in the most Republican states, but it may not be too informative. The problem is that polling avg& #39;s in the most R (& most D) states are worse off in terms of 1) volume of polls behind the avg and 2) quality of polls
These graphs show that both volume and quality of polls in final 2 weeks is greatest in most competitive states and that it declines as a state gets more red/blue.
To give an example... according to 538& #39;s final day poll avg& #39;s, North Dakota had the worst polling error of 2020 (off true margin by 16 pts).
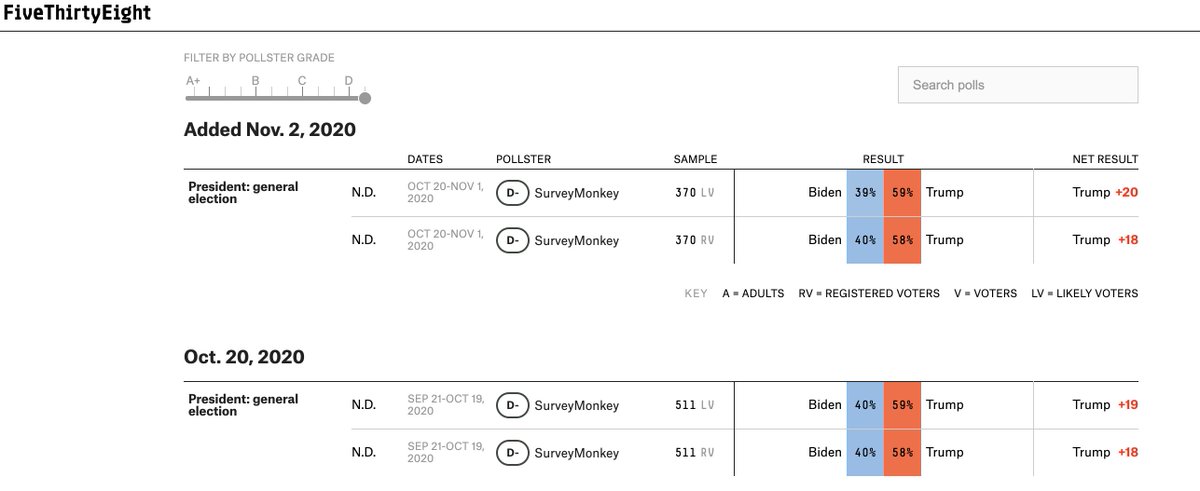
Here& #39;s what ND polls look like in final 2 weeks (4 polls from same D- pollster). Is this an adequate/fair test of general poll quality?
Here& #39;s what ND polls look like in final 2 weeks (4 polls from same D- pollster). Is this an adequate/fair test of general poll quality?
This is why I& #39;ve zeroed in on key/competitive states when quantifying polling error in 2020. Conclusions (like whether error was worse this year vs. 2016) could change if you include non-competitive states--but results there may not be too meaningful https://twitter.com/A_agadjanian/status/1328390542212751360">https://twitter.com/A_agadjan...

 Read on Twitter


