A secular fork in the road: Here, the secular bear mkts & secular bull mkts interspersed. It’s my thesis that we’re in a secular bull mkt which, at 11 years old (since the #SP500 index started making new highs in spring 2013), I believe is only in its 5th or 6th inning. 1/THREAD
The double-digit CAGR, the short & swift bear markets followed by robust recoveries to new highs, and the steady expansion in valuation multiples all spell “secular bull” in my view. 2/
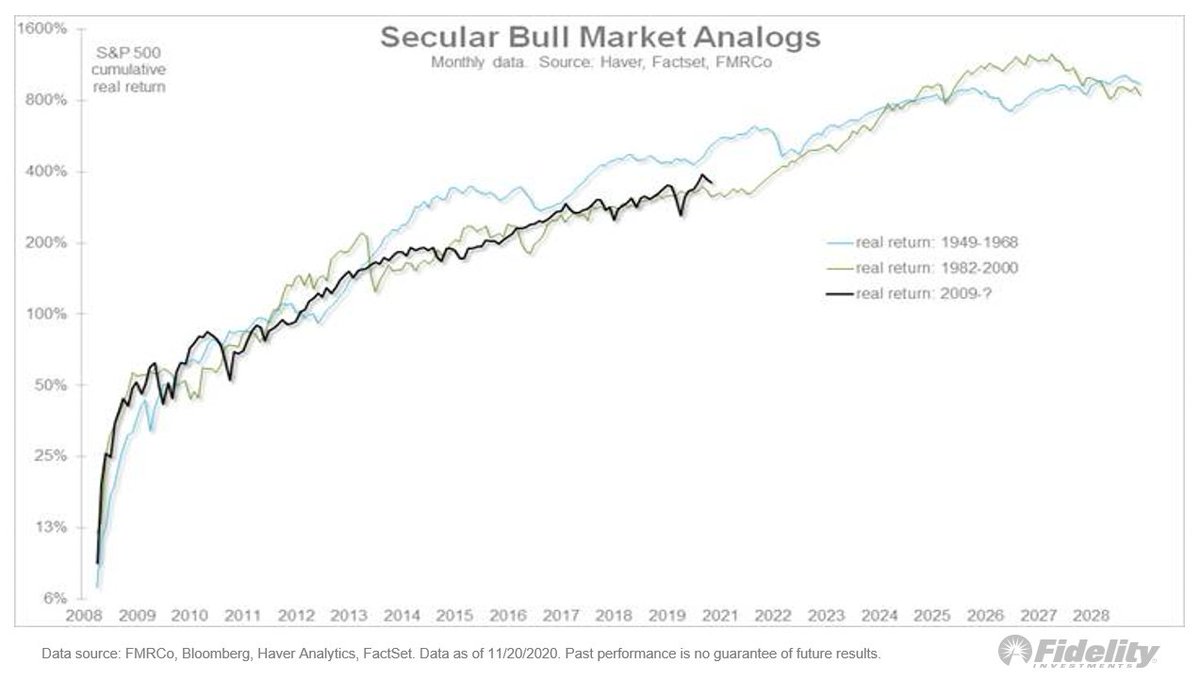
The post-global financial crisis (GFC) #bullmarket continues to closely track the secular bull markets of 1949-1968 and 1982-2000. It’s a sample size of only two but the analog suggests we may have a ways to go still. 3/
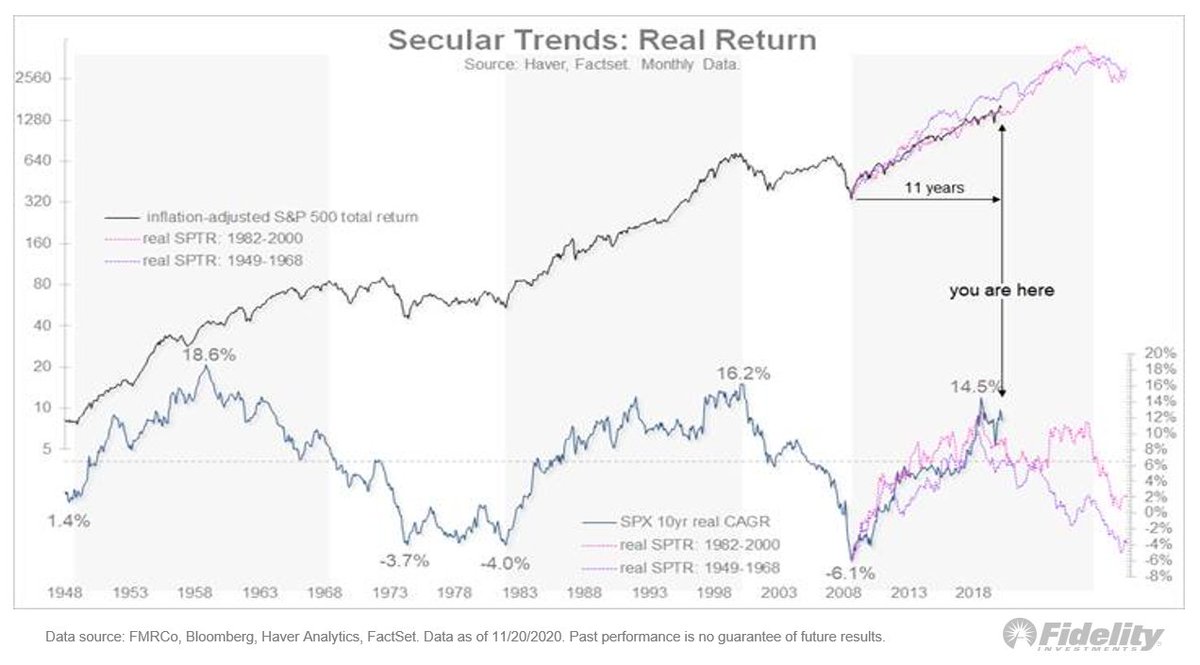
Let’s look at those previous 2 super cycles. The top panel show the #SP500 index & the bottom shows the 10-year CAGR. The chart indicates that while we’re just past the midway point on the analog, we’ve reached the point at which the 10-year CAGR has peaked in the past. 4/
That suggests the #market should continue advancing but at an increasingly less-positive rate of change. An important milestone, in my view. From what I’ve seen, when a price trend continues but its momentum wanes, leadership can get less monolithic and more diverse. 5/
If the 10-year CAGR is peaking at around 14% and on its way to moderating, the secular road map should start to converge toward the CAPE model. 6/
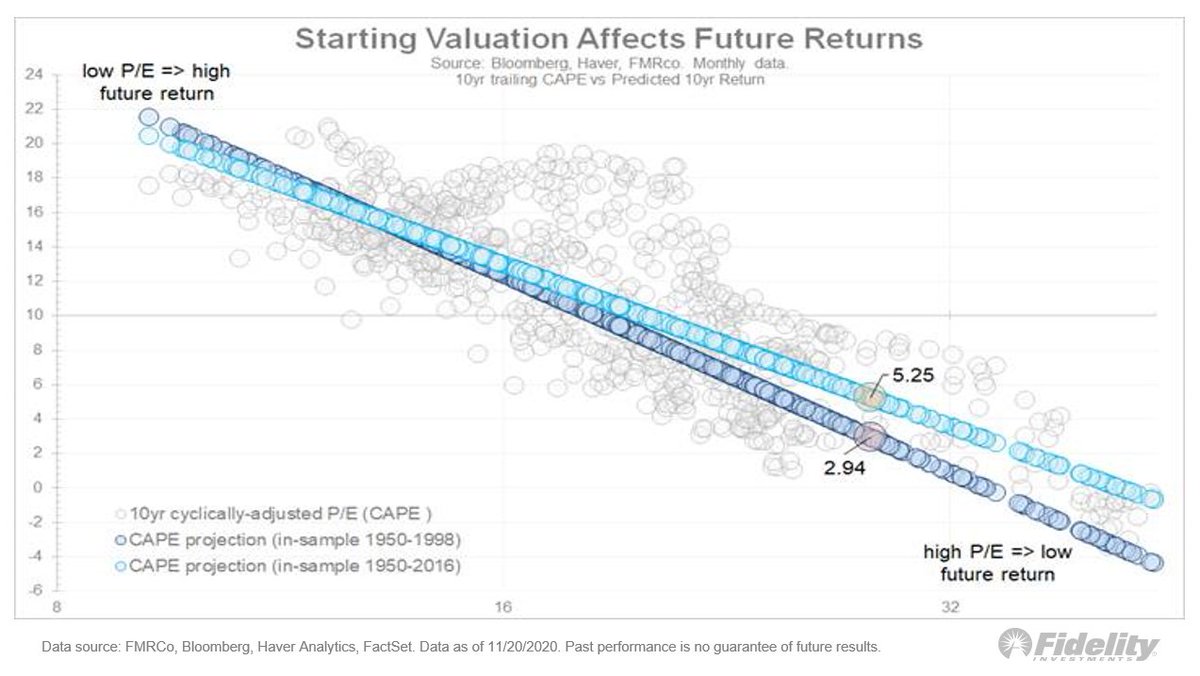
The cyclically adjusted price-to-earnings CAPE model has been consistently at odds with the secular roadmap in that it has predicted lower forward returns in the low- to mid-single digits. 7/
But given we’re on the roadmap, the 2 approaches could start to look more complementary. Here, the CAPE model based on 2 different in-sample periods: 1950-1998 & 1950-2016. In the chart, the y-scale is the forward CAGR and the x-scale is the CAPE. 8/
The latter in-sample “normalizes” the valuation levels of the late 1990s and therefore projects a better future rate of growth (5.25%) than the former (2.94%). 9/
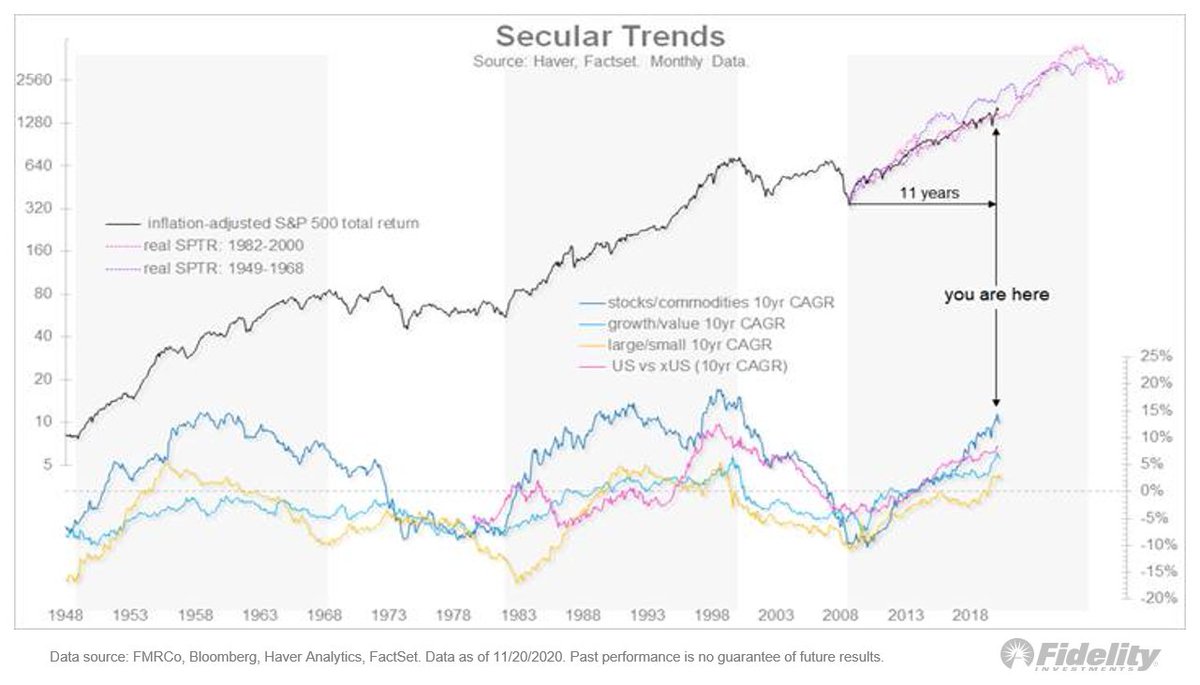
So what does this mean for style rotation? This chart shows the 10-year-CAGR for growth/value, large/small, US/ex-US and stocks/commodities. Since the 2009 post-GFC low, it has all been the same trade. Will this continue or reverse? 12/
If the rate of change peaks here, it could be the time when the all-one-trade nature of the #bullmarket could change into something more disperse. 13/END

 Read on Twitter


