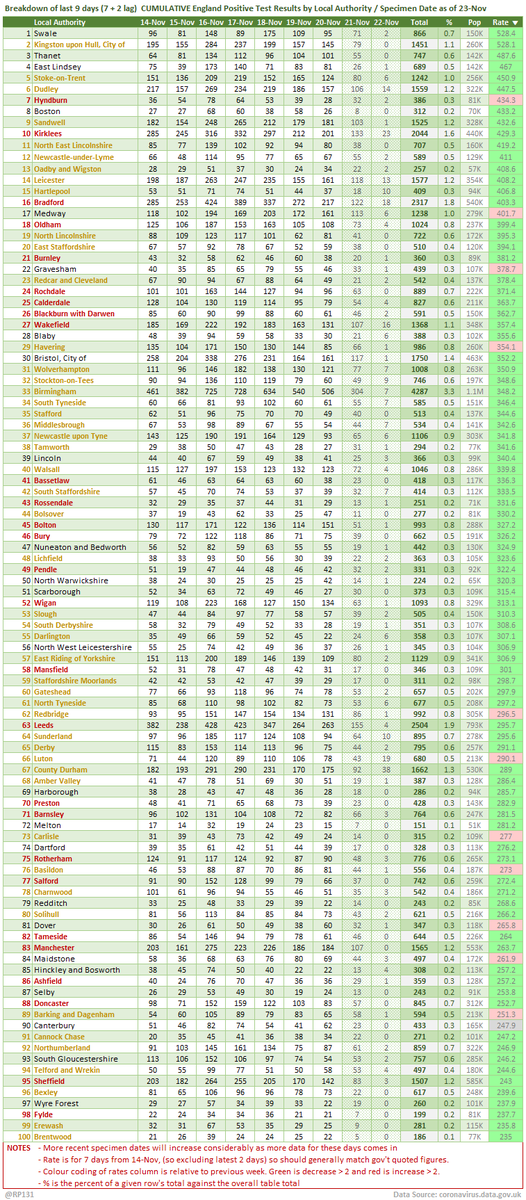
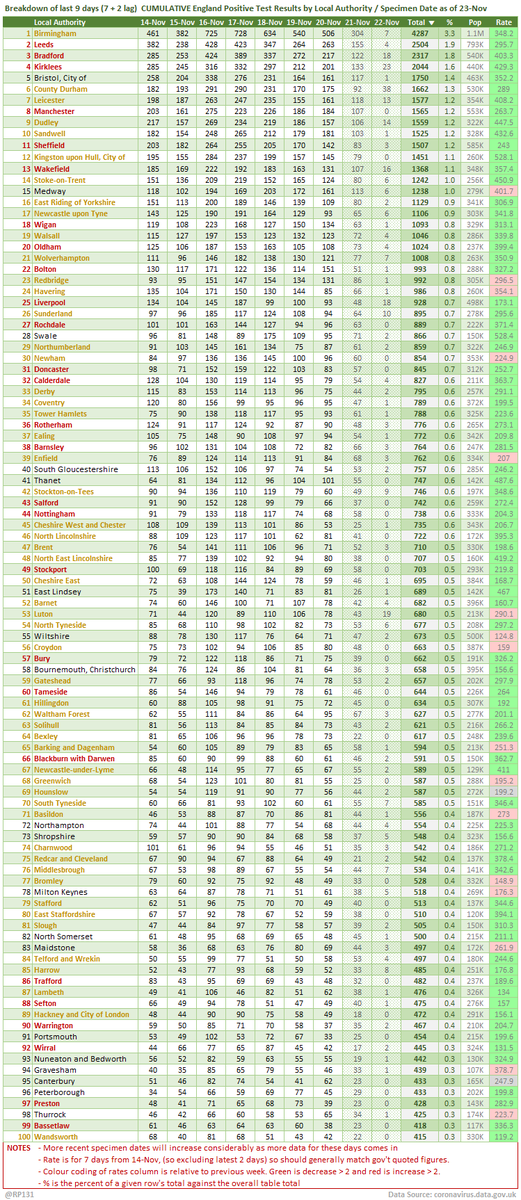
#covid19uk - Tables thread. Re-ordered now to put the more popular rate sorted table at the top. So this is to 100 England Local Authorities by positives per 100K population in last 7 days, up to 3 days ago. Bright green means lower than previous period.
Link to full version sorted by Rate: …https://coviddatashare.s3-eu-west-1.amazonaws.com/TableCumulative_Rate_20201123.html">https://coviddatashare.s3-eu-west-1.amazonaws.com/TableCumu...
Link to full version sorted by Count: …https://coviddatashare.s3-eu-west-1.amazonaws.com/TableCumulative_20201123.html">https://coviddatashare.s3-eu-west-1.amazonaws.com/TableCumu...
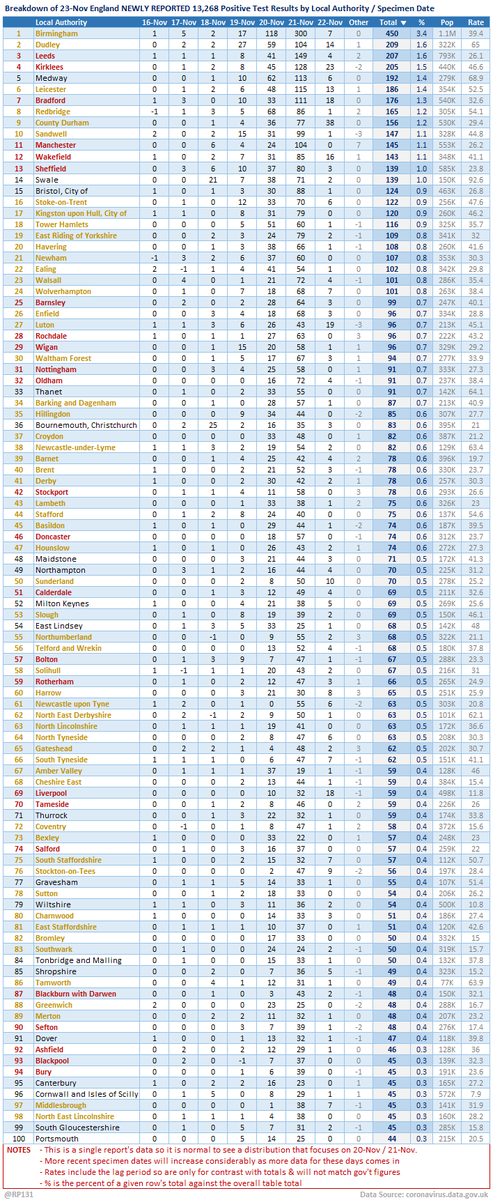
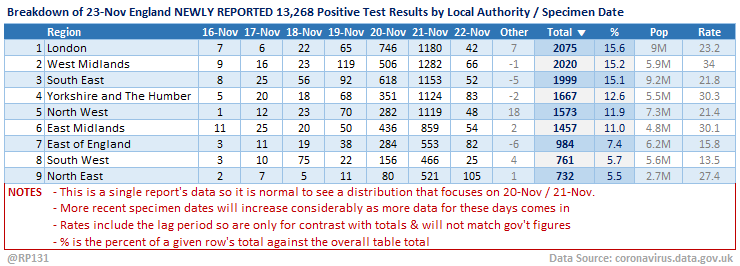
Table view of today& #39;s 13,268 NEWLY REPORTED England positive test results by local authority and recent specimen dates. Here showing top 100 authorities which represent 50% of the population, but have 66% of the positives.
Link to full table: …https://coviddatashare.s3-eu-west-1.amazonaws.com/Table_20201123.html">https://coviddatashare.s3-eu-west-1.amazonaws.com/Table_202...

 Read on Twitter


