Alright. I& #39;ve finally finished collecting Wisconsin& #39;s election results by reporting unit. Here will be a thread of maps on the election. You can get all the results here: https://docs.google.com/spreadsheets/d/1rW9R_L4V_tNRQlr2jWmtjr-ZOH1vM_a64JSd5AZ-CBY/edit?usp=sharing">https://docs.google.com/spreadshe...
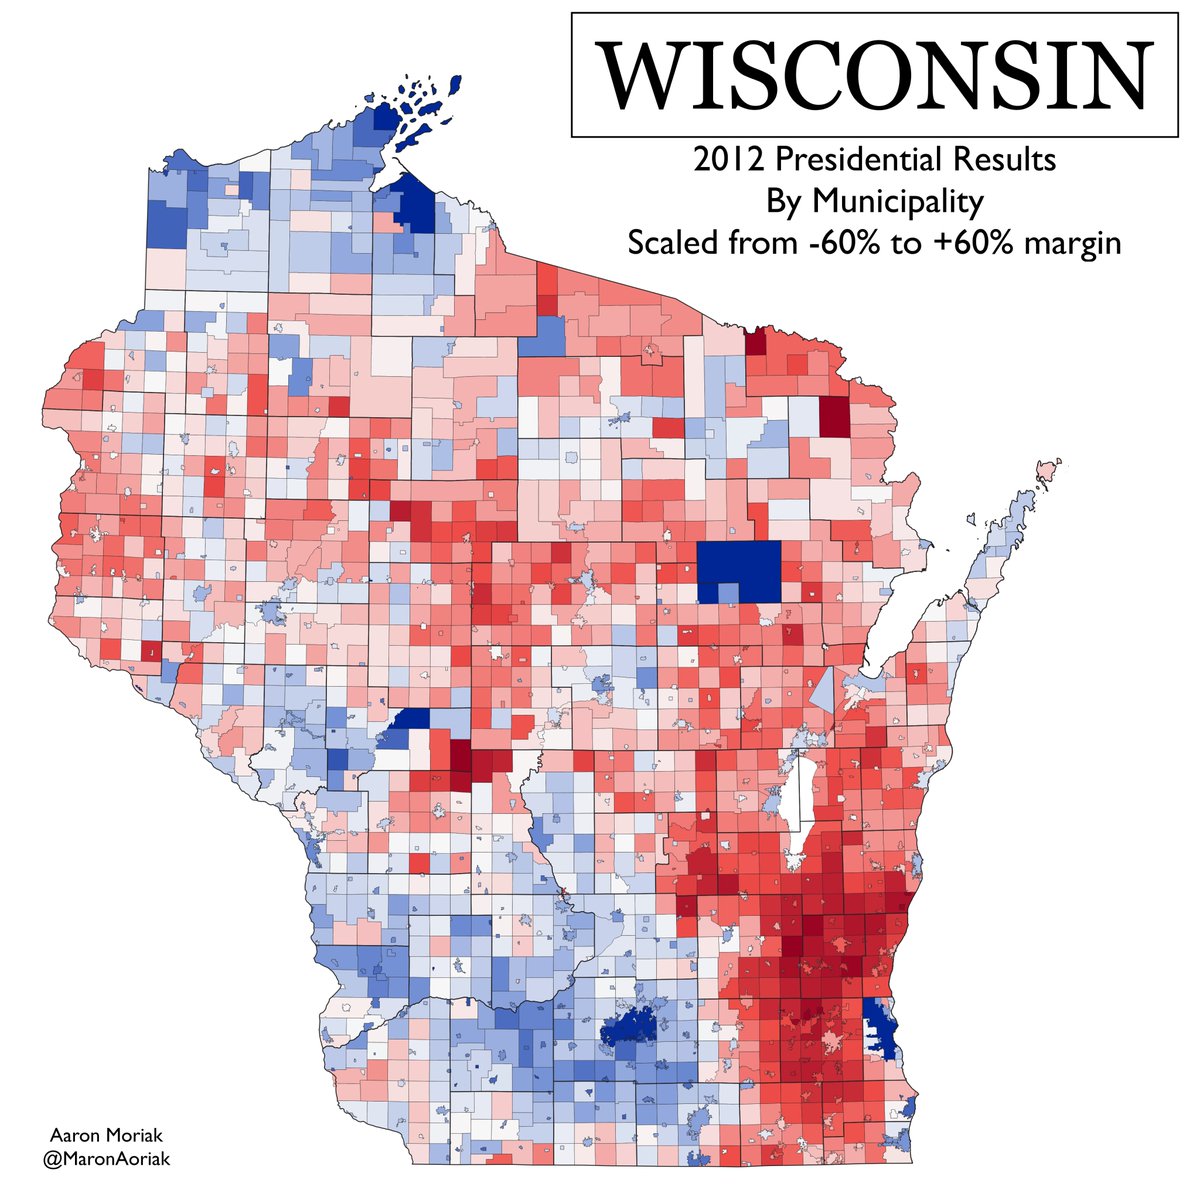
First up, the presidential results by municipality. Not too many surprises here, although it& #39;s notable how much light red is in the Milwaukee suburbs.
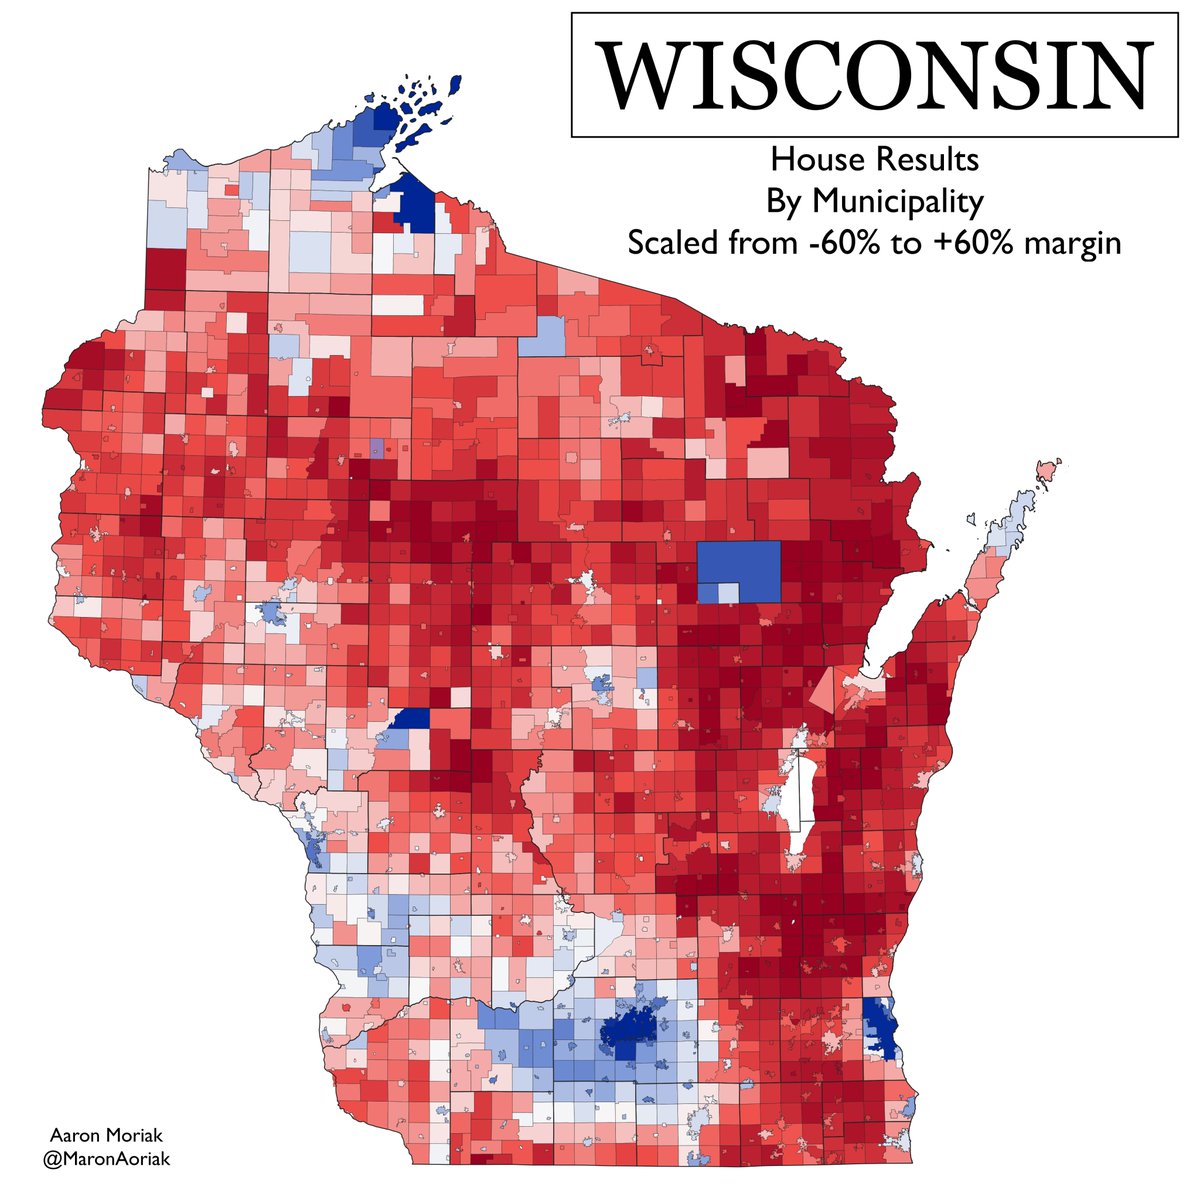
Next up is the House elections by municipality, where Ron Kind& #39;s down ballot strength is more apparent. He won Crawford and Vernon counties, which Biden could not win.
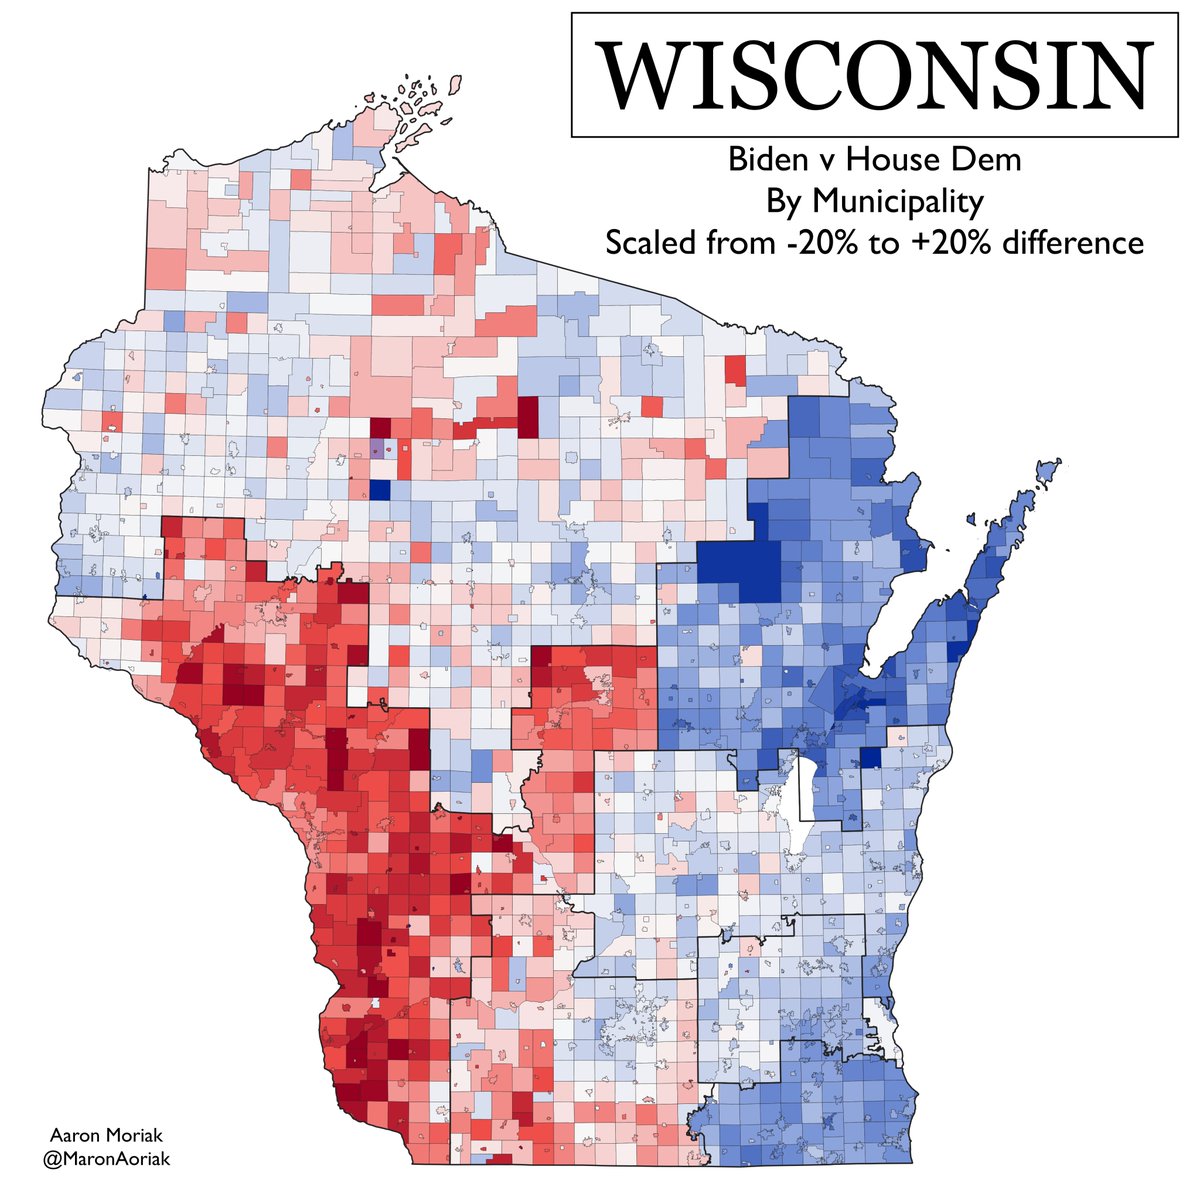
Kind& #39;s over performance is most visible in this map of the margin difference b/w Presidential and House candidates.
Mark Gallagher (R-WI-08) and Bryan Steil (R-WI-01) both over performed in their districts.
Mark Gallagher (R-WI-08) and Bryan Steil (R-WI-01) both over performed in their districts.
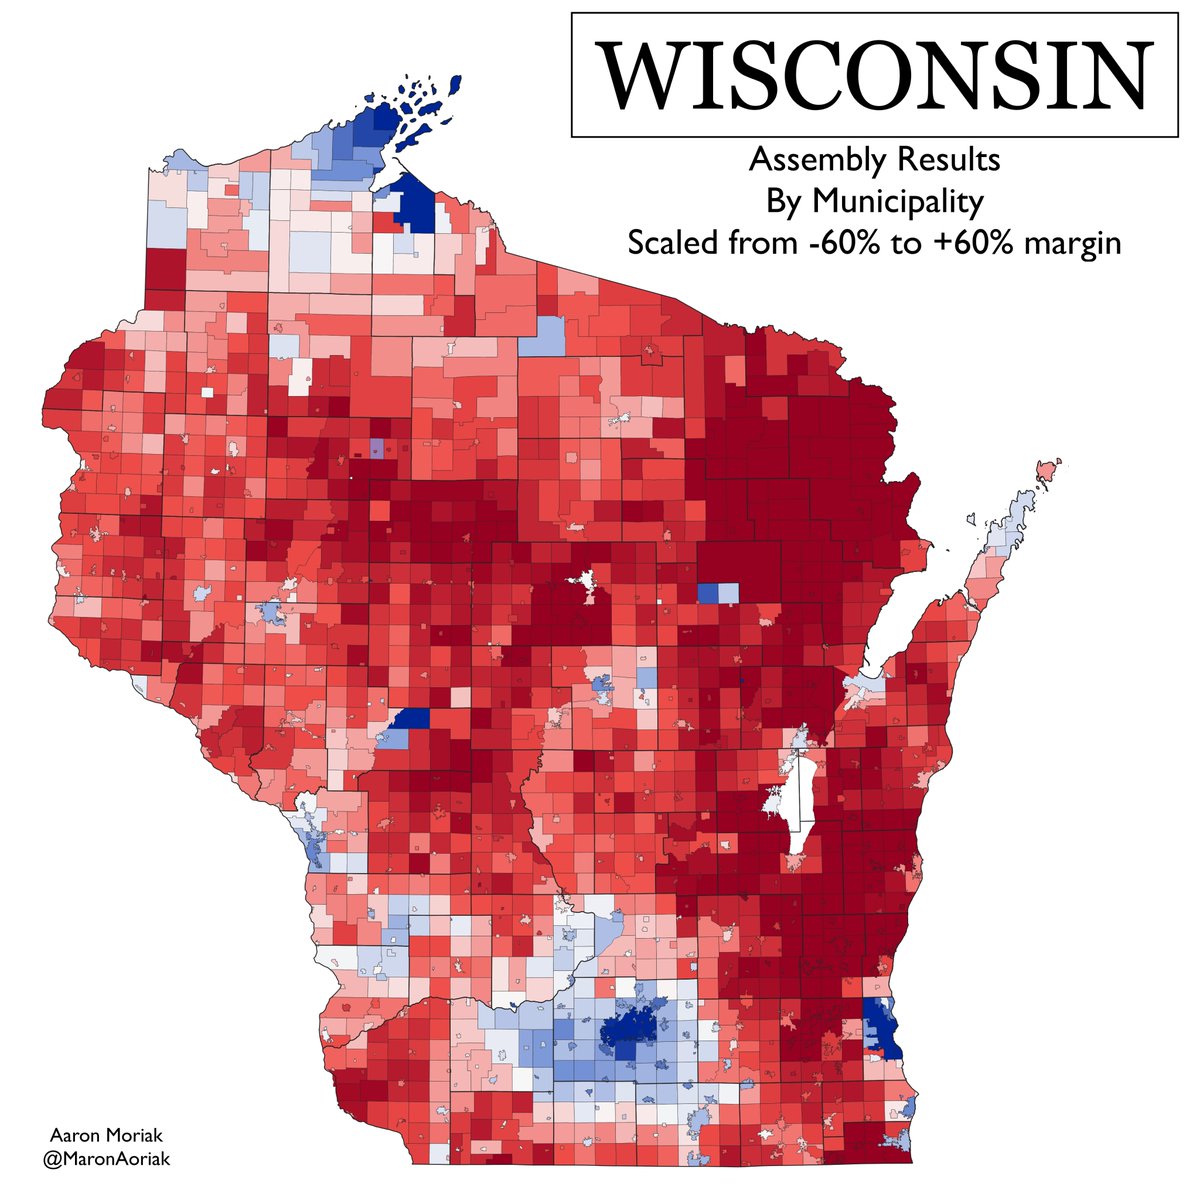
Here are the Assembly results by municipality. Please note that there were a number of uncontested races so some places (like the Menominee reservation) look discolored here.
And here& #39;s the difference in margin b/w Presidential and Assembly results. As before, the uncontested races make certain places look weird. I& #39;m interested to see how much of the difference can be explained by incumbency.

 Read on Twitter


