A thread...great news on the vaccine front this week, but perhaps a good time to remind folks that this is NOT the new normal, and that pandemics have a beginning, a middle and an end. We are in the middle now; the end will come.
I want to map out for you, in the most general terms, what I think is the likely future contour of the pandemic globally, based on how remarkably constant GLOBAL case growth has been for a number of months now.
Caveats galore.
As either Neils Bohr or Yogi Berra said: "Prediction is hard, especially about the future".
I think Neils Bohr but more fun if it was Yogi.
As either Neils Bohr or Yogi Berra said: "Prediction is hard, especially about the future".
I think Neils Bohr but more fun if it was Yogi.
So, absent a crystal ball, and also knowing that no good deed on the internet goes unpunished, I& #39;m going to share the following because: [drumroll] I think it is important for people to understand that what we are experiencing is not indefinite/open ended.
Ok, here goes...
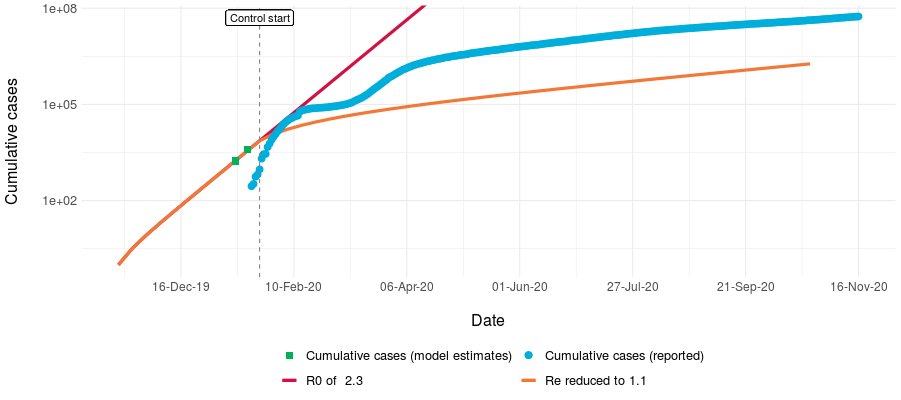
Something that& #39;s interesting (again, GLOBALLY) is that since April, global growth has basically been log-linear. In other words, you put it on a log scale and it& #39;s a straight line.
Something that& #39;s interesting (again, GLOBALLY) is that since April, global growth has basically been log-linear. In other words, you put it on a log scale and it& #39;s a straight line.
I think that represents the fact that (however reluctantly) people know how to control this now, so countries oscillate between wanting to scale back control and needing to institute control because they& #39;re in crisis (that& #39;s Canada right now).
That nets out at an R around 1.1, with very little variation over the long haul. Here& #39;s a graphic from something @AshTuite and I made in February, a lifetime ago, but which we are still updating [ https://art-bd.shinyapps.io/nCov_control/ ]">https://art-bd.shinyapps.io/nCov_cont...
What& #39;s nice about this is that you can see that we are basically growing 0.2 log per month, so the point where attack rate exceeds 50% of the global pop can be predicted by extrapolating.
[this is log10, btw]
If transmission heats up over the winter and R does rise that just means we get there sooner. 50% of the globe& #39;s pop is around 3.5 or 4 billion; the case count we hit when we have 4 billion infections depends what fraction of cases are identified...
It& #39;s probably somewhere between 1:10 and 1:20, or was back in May when I made this figure. Maybe it& #39;s higher now because of more widespread testing; maybe it& #39;s lower now because of more widespread disease. Maybe it nets out.
It doesn& #39;t make a huge difference...log 10 is between 8.3 and 8.6. That would mean we& #39;ll hit 50% infected when we& #39;re at 200-400 million counted cases. Unfortunately that& #39;s not too far away.
We& #39;re at 55 million now (log10 = 7.7 or so); with constant R we& #39;re growing by 0.6 million per day, and that is increasing over time (because R > 1). At 0.2 log per month, that is somewhere between 3 months at the low end and 4.5 at the high end.
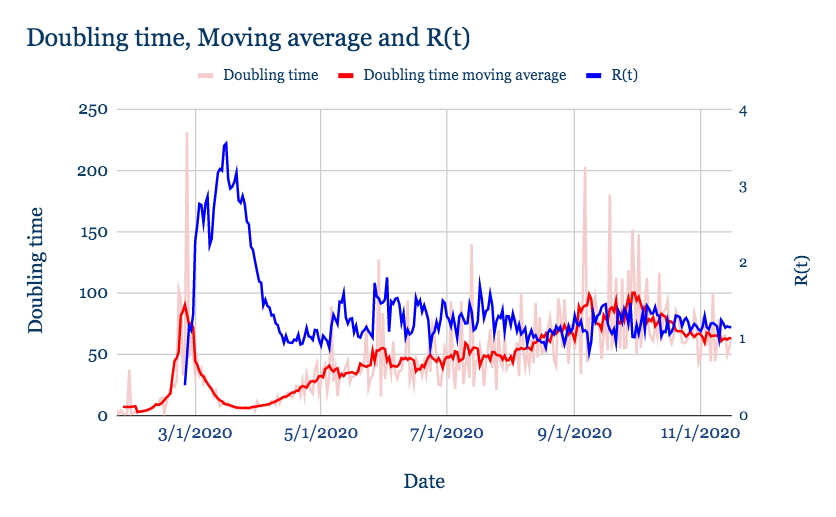
This graph shows global R and doubling time on cumulative cases...both remarkably constant for some time now.
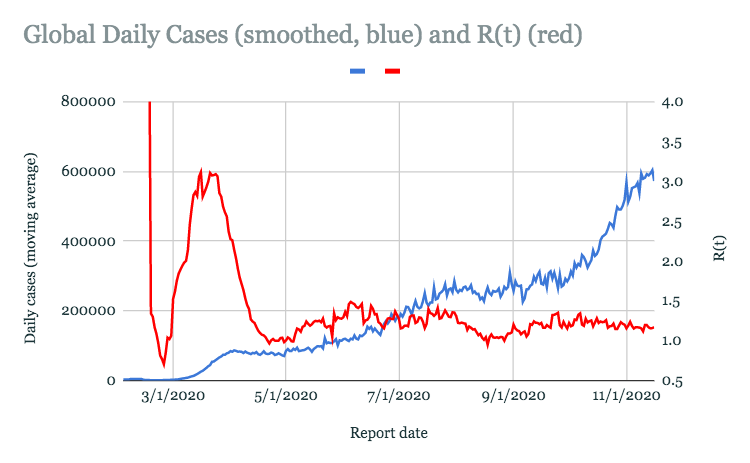
Here& #39;s the same R, but with moving average daily cases superimposed...R ~ 1.1 is a mighty force, and we& #39;re surpassing 600,000 cases a day now.
But back to the flawed prognostication: this puts global infections at 50% by late winter or early spring. The fixation on 50% infected is because with R in the 2& #39;s, that& #39;s where (globally) we& #39;ll hit the point where R effective is around 1, even without intervention.
That means the epidemic peaks and starts to decline. At that point there are a lot of PREVALENT infections, so this gets carried forward for a while like a truck that& #39;s come downhill and continues forward under its own momentum even on the flat...
..., so lots of deaths coming and hospital resources still needed, but declining over time. It& #39;ll be further helped along if we see vaccine rollout around the same time (as we will, it& #39;s now clear).
Even in the absence of a highly effective vaccine, this is where the thing starts to turn into an endemic (likely seasonal) disease. That would again put us on a 1918 timeline in terms of the worst (in terms of transmission) being behind us by April 2020.
R hovering around 1 without intervention also makes any interventions that are in place much more effective (anything we do markedly decreases growth).
Numerous caveats here...
Numerous caveats here...

 Read on Twitter


