Nerds! Here is a dataset featuring car-registration data at the LSOA (roughly: neighbourhood) level for England for 2010-2020 combined with ONS variables for population, house price, land area, etc. https://drive.google.com/drive/folders/1XUJVz5UfdG7m0XDxp5EdSt2FeGik1H_G?usp=sharing">https://drive.google.com/drive/fol...
The car-registration data were obtained via a request to DVLA. These data are already published for London but only at the borough level. My motivation was to see what impression the WF LTNs are making on car ownership.
I& #39;ve estimated a model (in @Stata, sorry it& #39;s not in R) that seems to indicate each year in an LTN is associated with a 3% reduction in car-ownership relative to non-LTN LSOAs London. This is controlling for population, land area, house prices and other items.
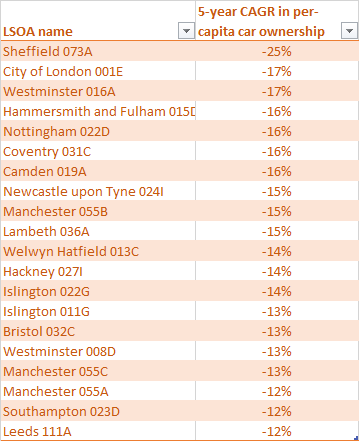
My first instinct was to calculate 5-year CAGR in per-capita car ownership for all of England and find @wfcouncil LTNs at the top of the list. Here is that list for the 5-year period ending June 2020.
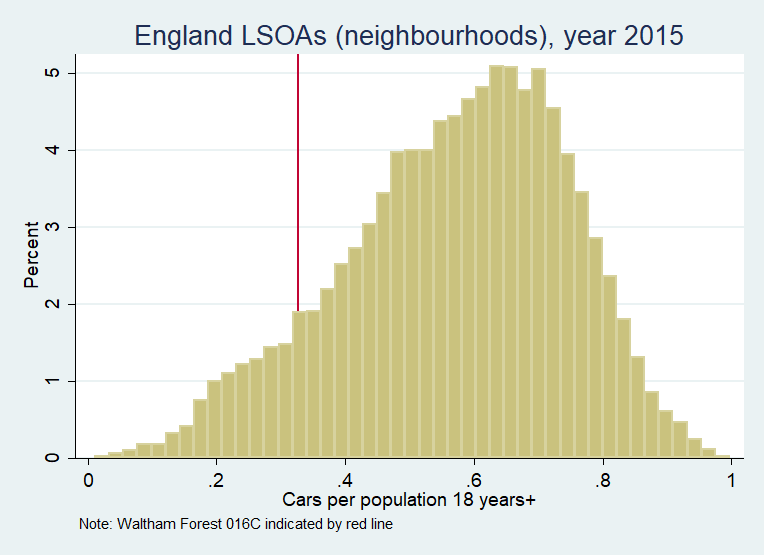
The first appearance of a WF LSOA is "Waltham Forest 016C" which is 100% LTN (half in the Hoe NW LTN, half in the Walthamstow Village LTN). It comes in at 458 out of 32k LSOAs in England (or 235 out of 4917 in London).
But it was already pretty far on the left-hand side of the distribution of car-ownership when the LTNs started going in. And this makes sense: LTNs went where car ownership was already pretty low.
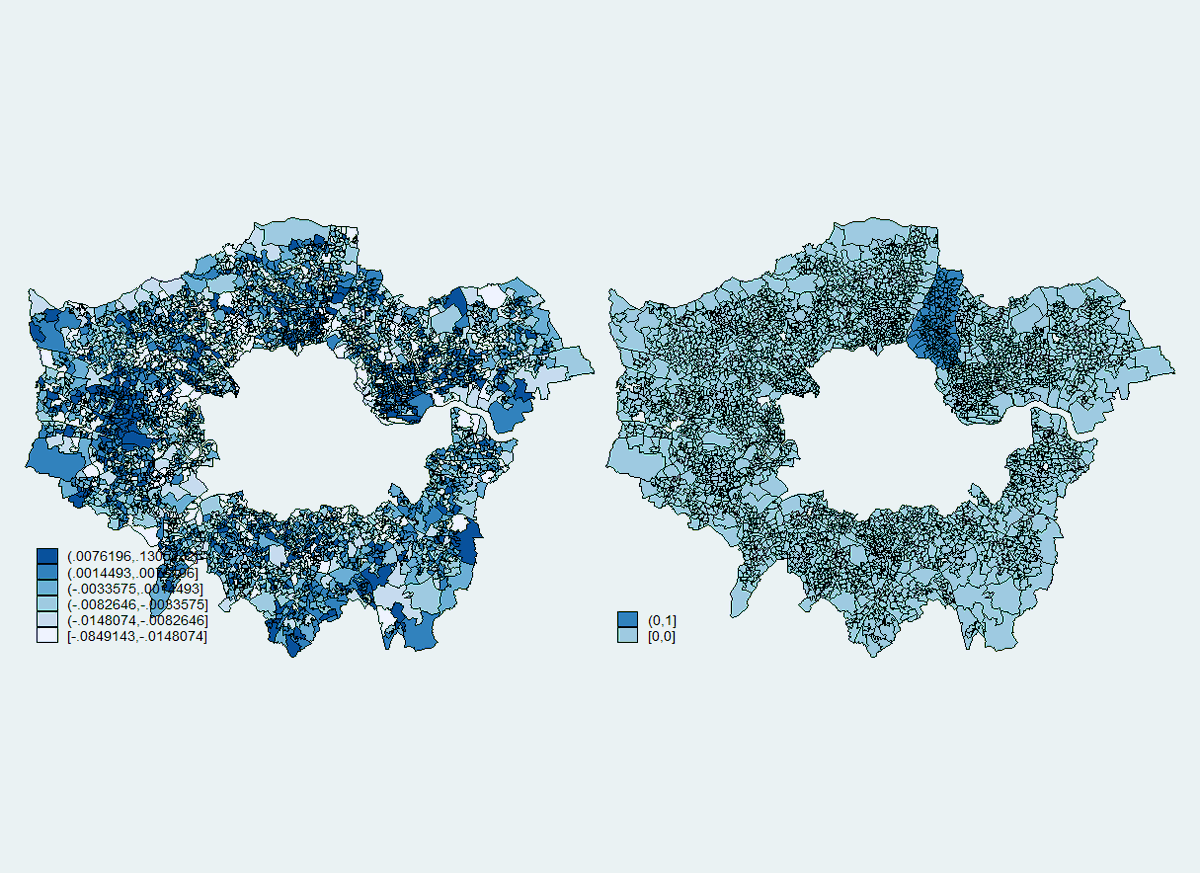
Here is 5-year CAGR in car-registration per capita as a heatmap for outer London boroughs. I do not find this massively helpful but it might mean more to you than me. The map on the right simply highlights the location of Waltham Forest.
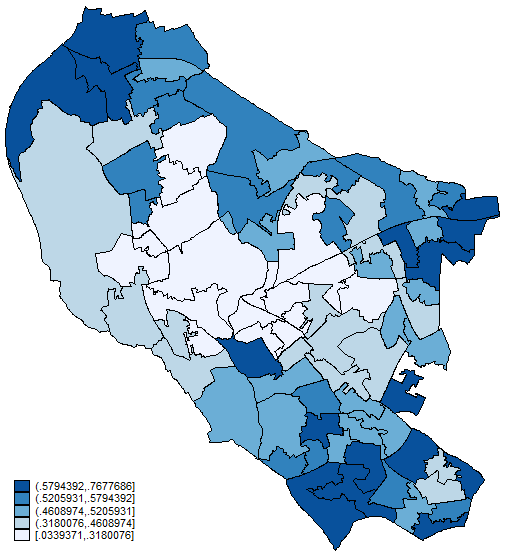
Per-capita car ownership in Oxford (June 2020). I haven& #39;t sussed how to overlay these with place names (maybe @WillRay3 will teach me?). The darkest-blue just south of centre of Oxford is Iffley Fields. The darkest-blue just south of that is Iffley Village.
The lightest blues in the map above might only reflect lack of car registrations to those neighbourhoods, not necessarily lack of cars. These areas have large university student populations.
Ok. In addition to car dealerships beware of new student accommodation. These push up the denominator in the cars/adult ratio 5-year cagr. I checked the leading 5-year decrease in this ratio — Sheffield city ctr — and it’s down to new blocks of student housing.

 Read on Twitter


