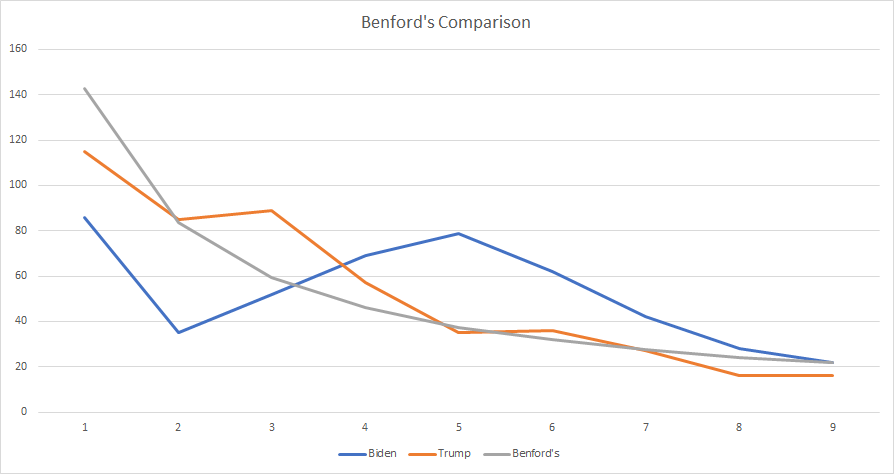
I am making these tweets to explain in one place some analysis that was done last night.
1 - I was asked offline about doing Benford& #39;s on election data. I explained that this is common and a useful way to detect anomalies in data that are driven by artificial process (e.g. fraud)
1 - I was asked offline about doing Benford& #39;s on election data. I explained that this is common and a useful way to detect anomalies in data that are driven by artificial process (e.g. fraud)
2 - My student then pointed me towards a tweet that was exploring this type of analysis (but they hadn& #39;t done Benford& #39;s). So I chimed in.
3 - However, I did not know what data they used so I found a source for the context they referenced. However, I could not initially find write-ins versus non-write-ins, so I looked at candidate counts.
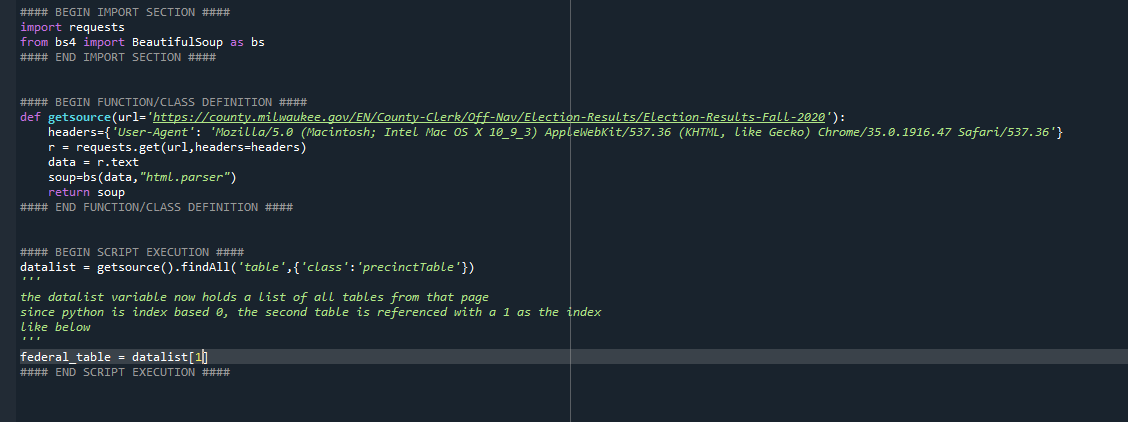
4 - I then wrote a quick script to gather that data, here is an example of what the data gathering portion of this process looked like.
5 - With this data now available to look at in code, I created a process to analyze first digit conformity to the Benford& #39;s distribution. This is a test that is often conducted via Chi-squared.
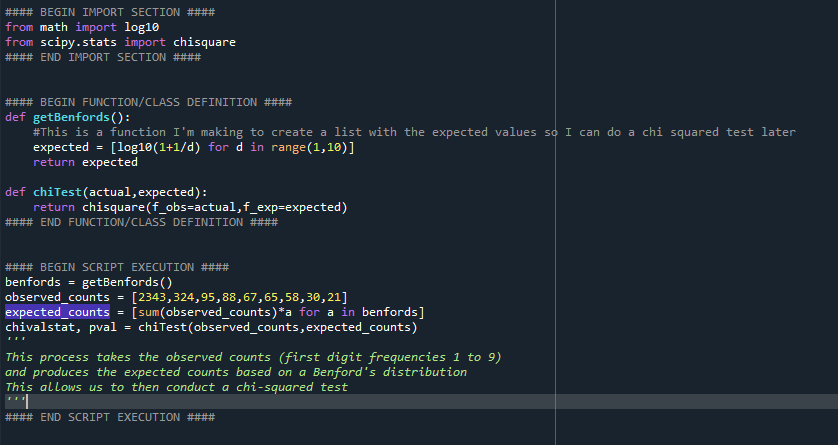
6 - I wrote the code to produce the Benford& #39;s discrete distribution. This code looks like this.
7 - Now that I had the data and the distribution, I simply needed to perform the test. To do that, I leveraged scipy& #39;s chisquare. However, prior to doing that, you need to produce the expected result values (not just the percentages. But this is as simple.
8 - To do that, you take the total number of observations (number of numbers that the first digit counts are derived from) and multiply them by the Benford& #39;s distribution frequencies accordingly. This looks like this:
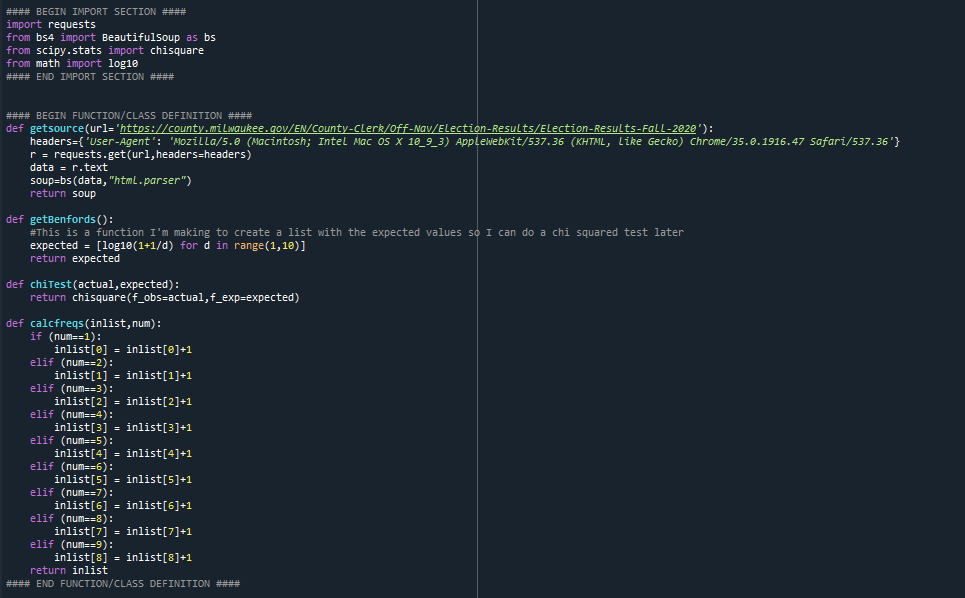
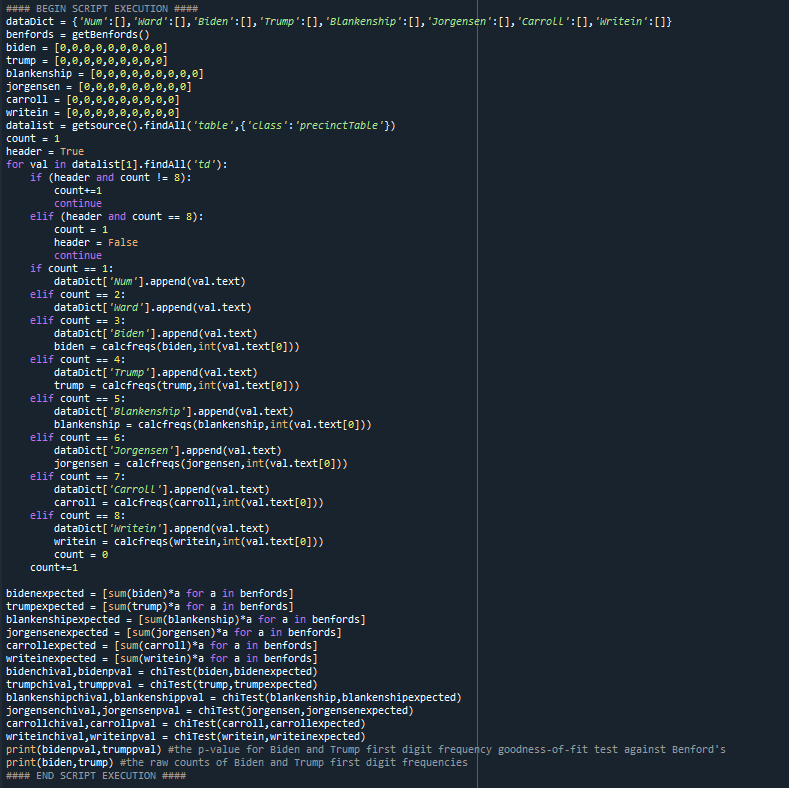
9 - The final process, put together, has some additional code to handle data and count the digits from that webpage (comes in 2 parts, first script setup and function definition, then the script on next tweet):

 Read on Twitter