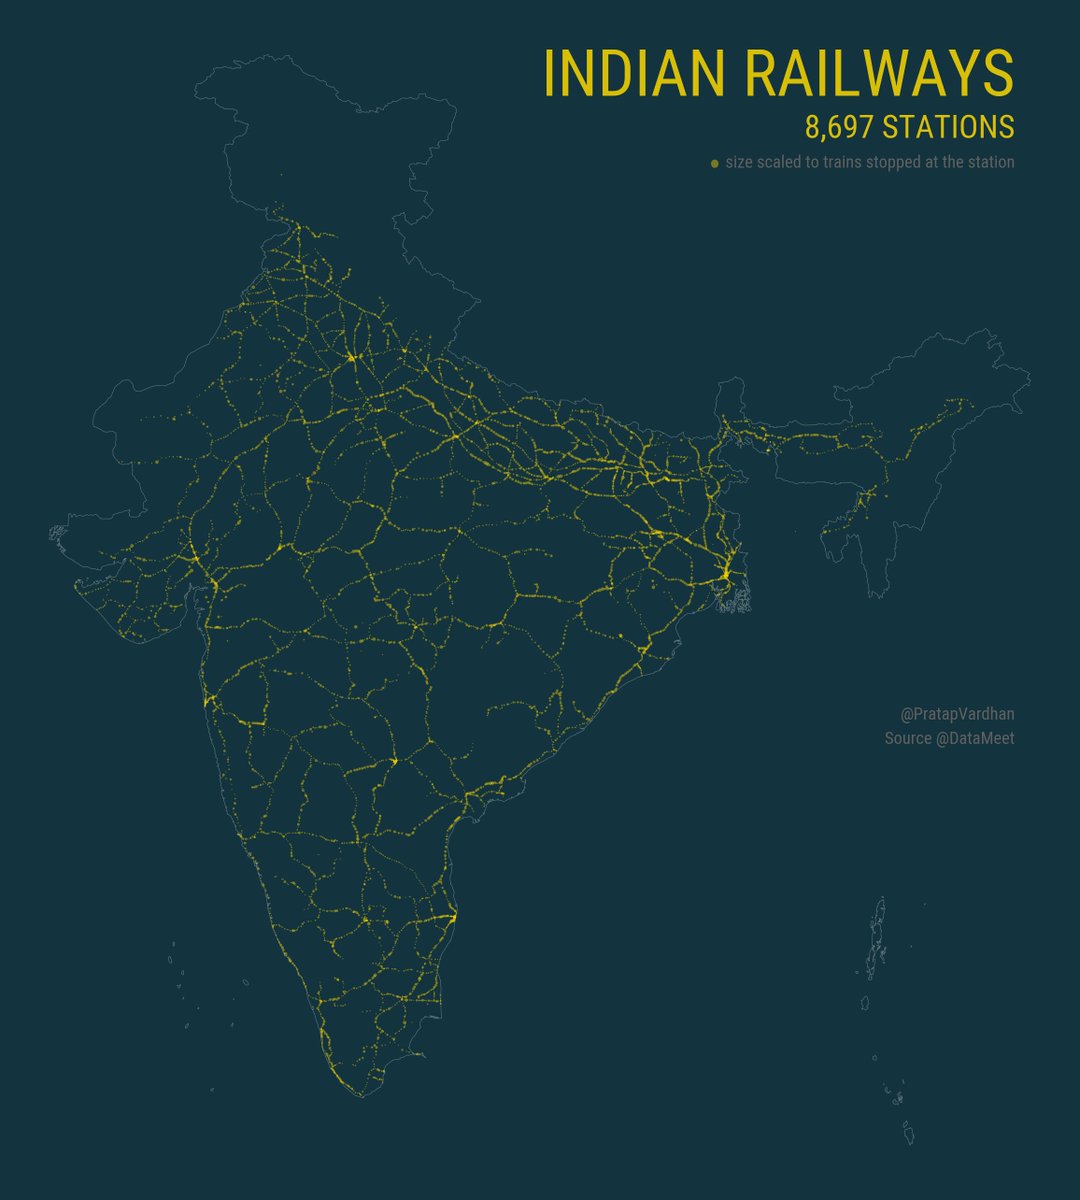
Kicking off the #30DayMapChallenge by visualizing the network formed by 8,697  https://abs.twimg.com/emoji/v2/... draggable="false" alt="🚉" title="Haltestelle" aria-label="Emoji: Haltestelle"> railway stations in India.
Day 1: Points
Looking forward to explore https://abs.twimg.com/emoji/v2/... draggable="false" alt="🇮🇳" title="Flagge von Indien" aria-label="Emoji: Flagge von Indien"> India through geospatial visualizations with this challenge.
  https://abs.twimg.com/emoji/v2/... draggable="false" alt="🤞" title="Crossed fingers" aria-label="Emoji: Crossed fingers">
Made with @geopandas @matplotlib
Day 1: Points
Looking forward to explore
Made with @geopandas @matplotlib
A day in the Indian Railways Network. Animating Rajdhani trains  https://abs.twimg.com/emoji/v2/... draggable="false" alt="🚆" title="Zug" aria-label="Emoji: Zug"> moving from and to New Delhi.
#30DayMapChallenge Day 02: Lines
Made with #Python @matplotlib @geopandas
Data @DataPortalIndia @datameet #gischat #dataviz
#30DayMapChallenge Day 02: Lines
Made with #Python @matplotlib @geopandas
Data @DataPortalIndia @datameet #gischat #dataviz
Literacy in India - understanding the picture at district level from census data. Just over a quarter districts have literacy above 70%.
#30DayMapChallenge Day 03: Polygons
Made with @matplotlib @geopandas data: @censusindia2021
#dataviz #census
#30DayMapChallenge Day 03: Polygons
Made with @matplotlib @geopandas data: @censusindia2021
#dataviz #census
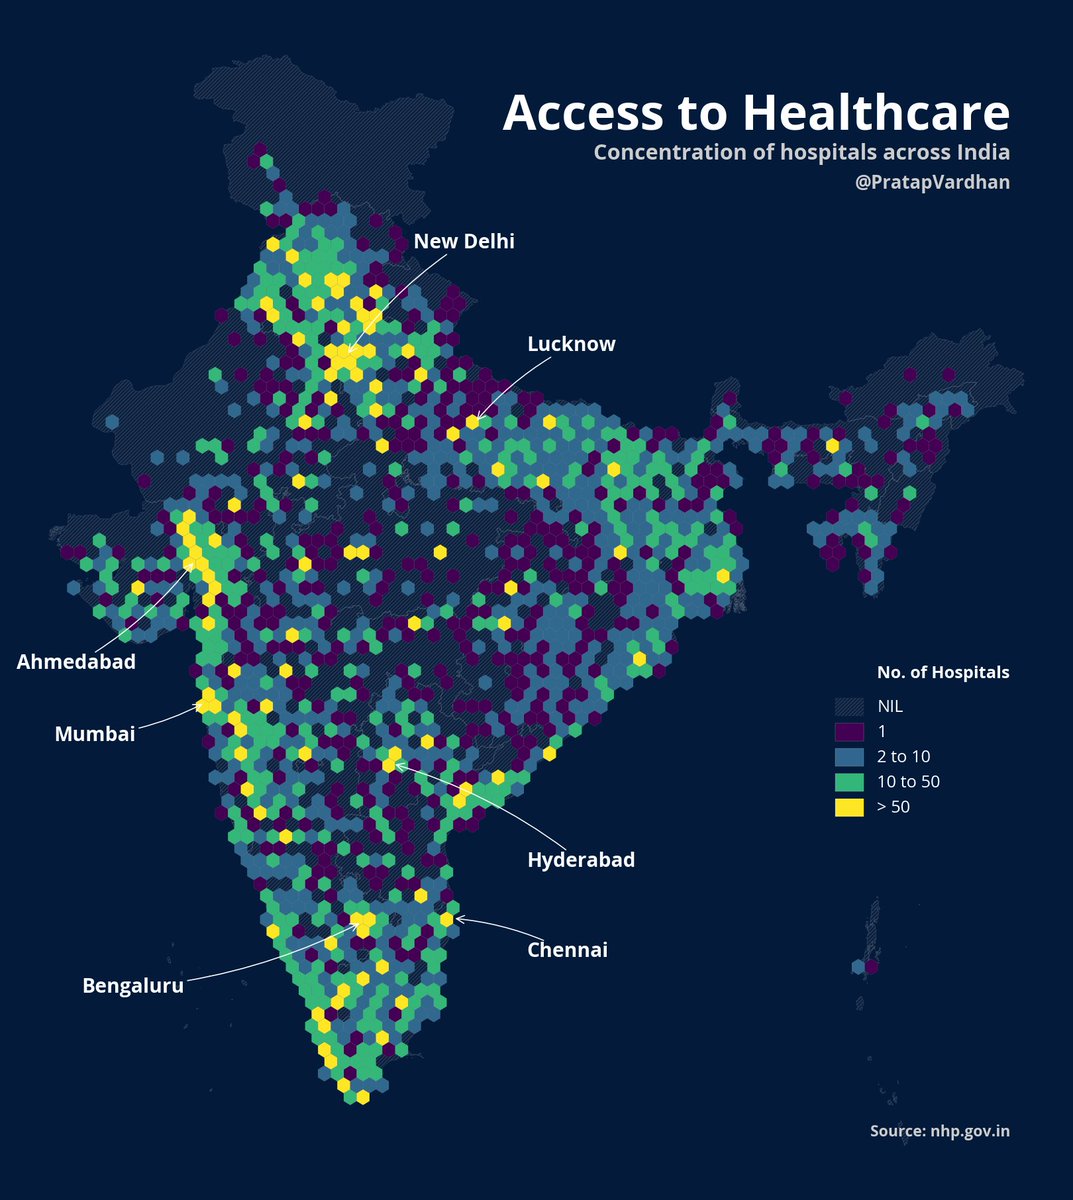
Access to healthcare - visualizing concentration of hospitals across India.
#30DayMapChallenge Day 04: Hexagons
made with @matplotlib data @nhpindia
#dataviz #healthcare #python
#30DayMapChallenge Day 04: Hexagons
made with @matplotlib data @nhpindia
#dataviz #healthcare #python
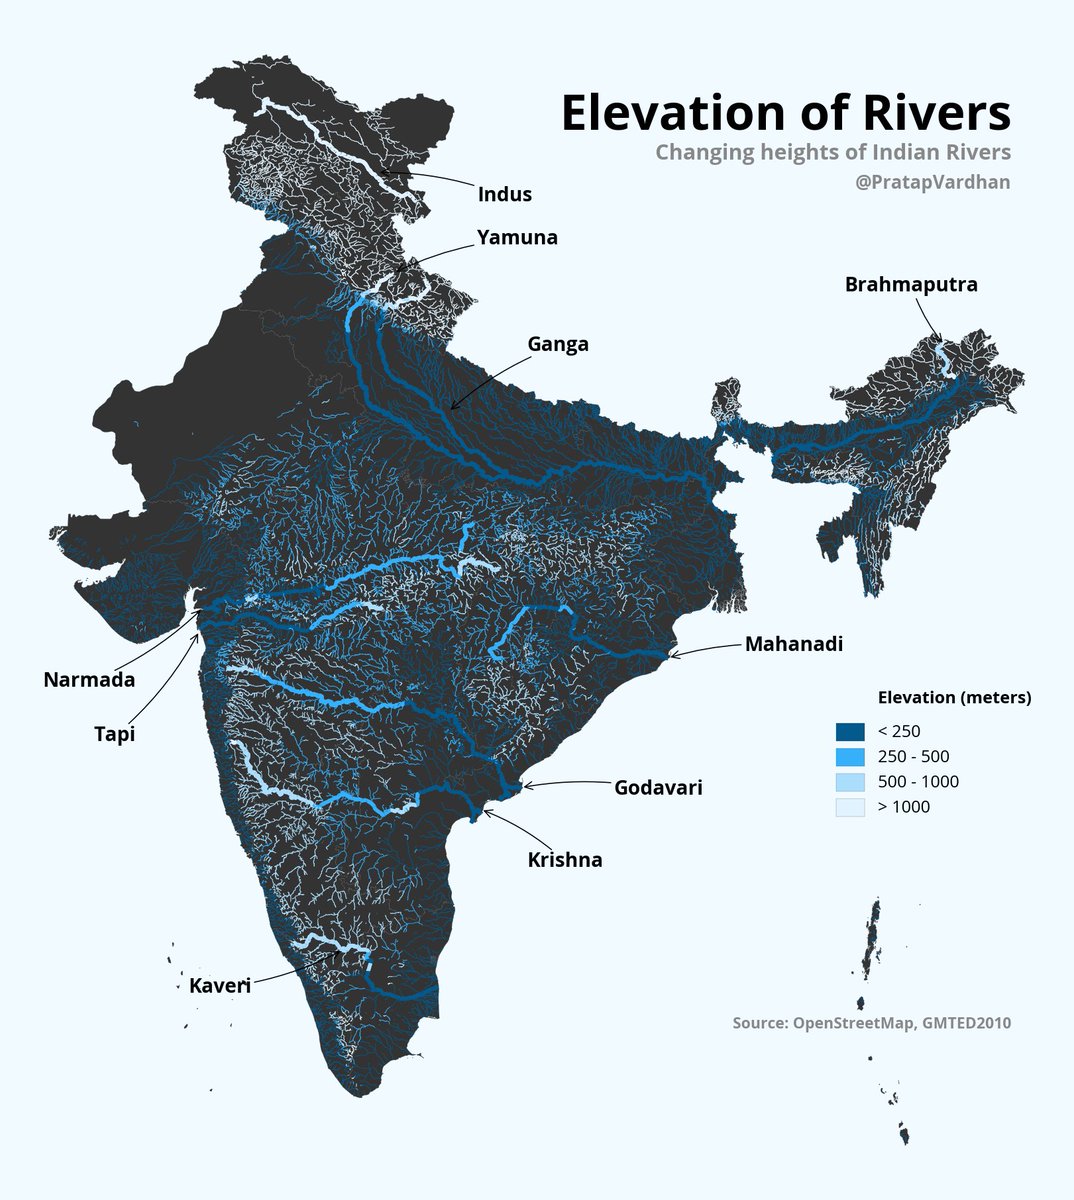
Elevation of Rivers: #30DayMapChallenge Day 05: Blue
Attempt to understand changing heights of Indian Rivers from @openstreetmap and DEM data.
Made with @matplotlib #rasterio #openstreetmap #python
Attempt to understand changing heights of Indian Rivers from @openstreetmap and DEM data.
Made with @matplotlib #rasterio #openstreetmap #python
Land Surface Temperature: #30DayMapChallenge Day 06: Red
Remarkable changes in land surface temperatures across India in 2020.
Made with @matplotlib #rasterio #python @NASAEarthData
Remarkable changes in land surface temperatures across India in 2020.
Made with @matplotlib #rasterio #python @NASAEarthData
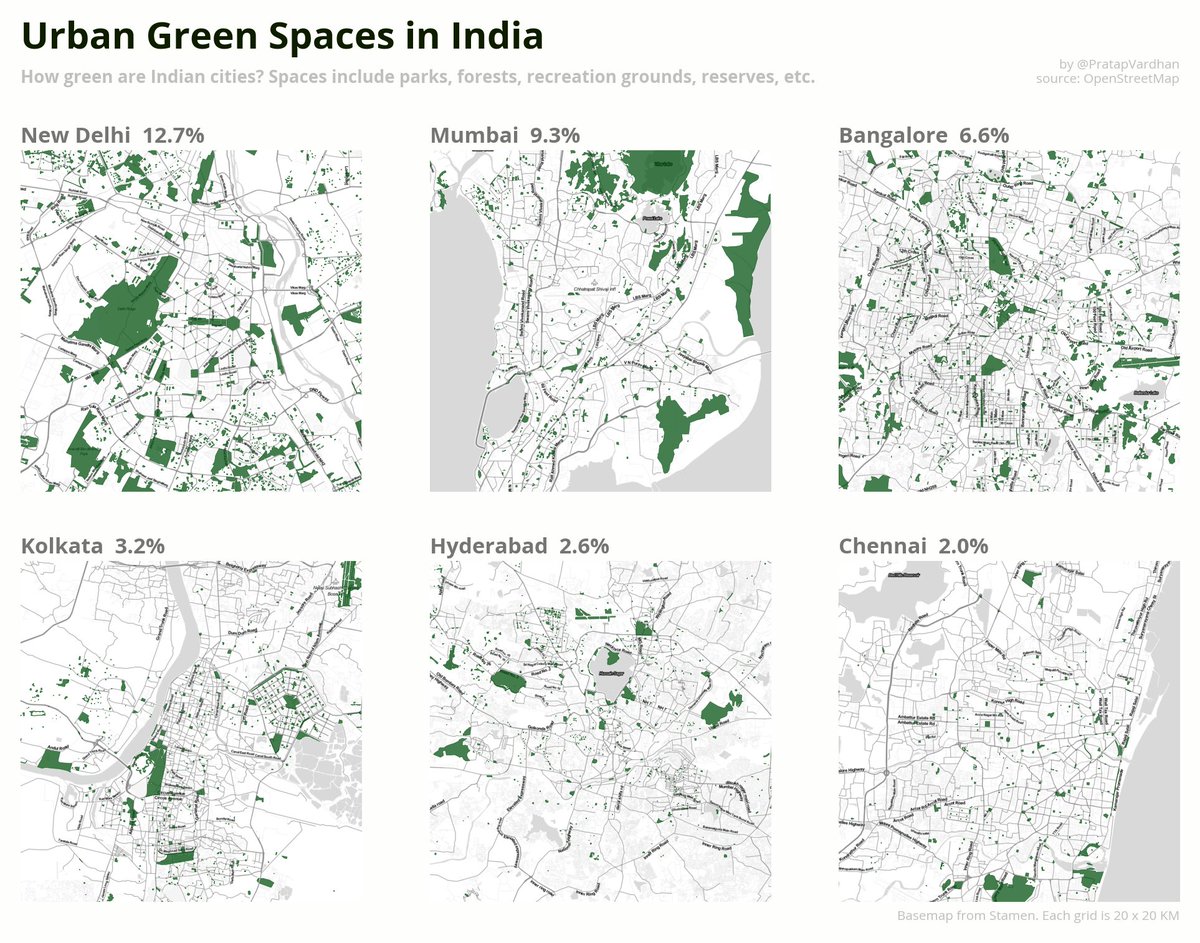
Urban Green Spaces in India: #30DayMapChallenge Day 07: Green
How green are Indian cities? Looking at spaces including parks, forests, recreation grounds, etc. within 25km grids.
Made with @matplotlib @geopandas
Data from @openstreetmap
#python #openstreetmap #dataviz
How green are Indian cities? Looking at spaces including parks, forests, recreation grounds, etc. within 25km grids.
Made with @matplotlib @geopandas
Data from @openstreetmap
#python #openstreetmap #dataviz
Solar Potential in India: #30DayMapChallenge Day 08: Yellow
Visualizing direct normal solar irradiance throughout the year with current installed capacity of solar plants.
Made with @matplotlib @geopandas
Data from @NREL @WorldResources @mnreindia
#python #solar #renewable
Visualizing direct normal solar irradiance throughout the year with current installed capacity of solar plants.
Made with @matplotlib @geopandas
Data from @NREL @WorldResources @mnreindia
#python #solar #renewable
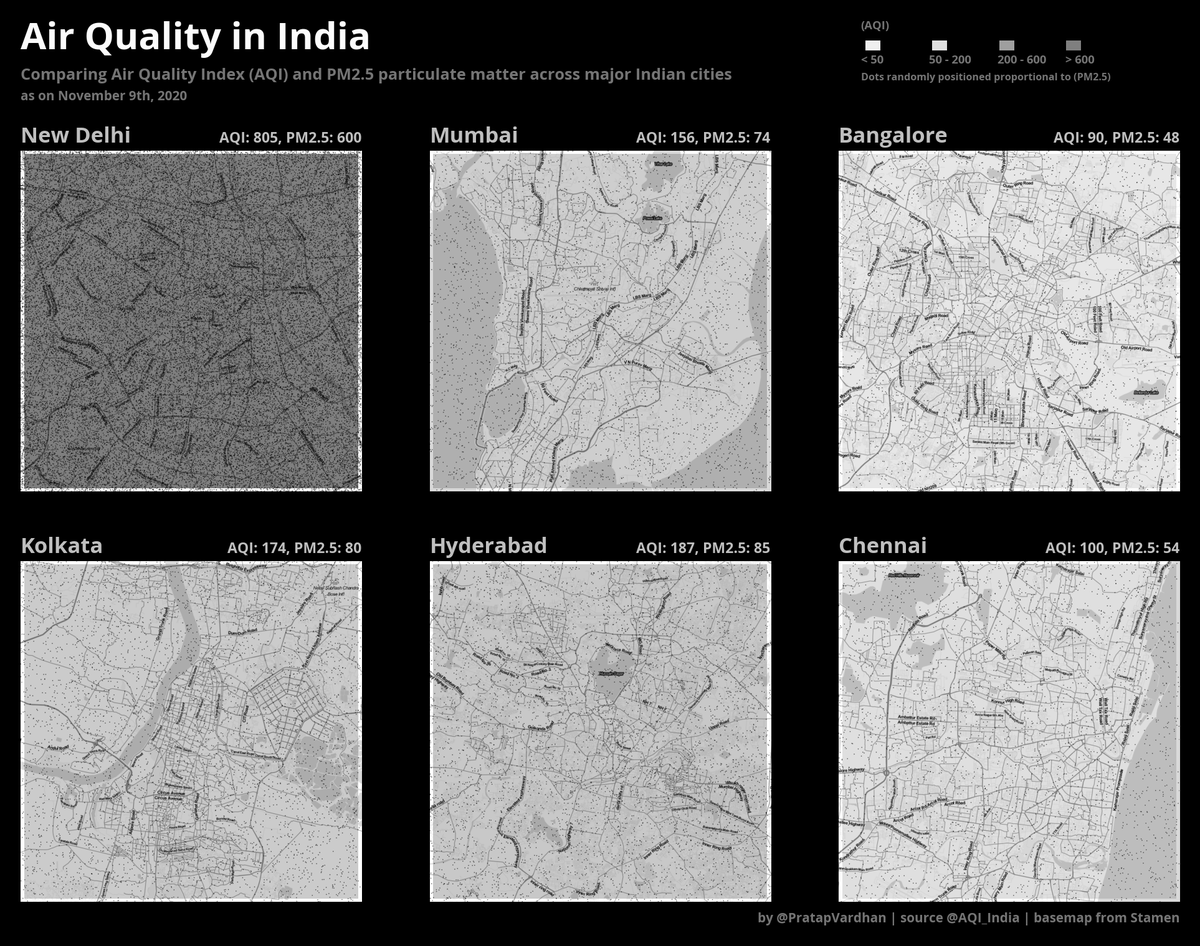
Air Quality in India: Comparing AQI and PM2.5 particulate matter across major Indian cities.
As on today, #DelhiAirQuality is 4x that of any other major Indian city.
#30DayMapChallenge Day 09: Monochrome
Made with @matplotlib data @AQI_India #AirQuality
As on today, #DelhiAirQuality is 4x that of any other major Indian city.
#30DayMapChallenge Day 09: Monochrome
Made with @matplotlib data @AQI_India #AirQuality
Plant Growth Patterns: Changing green vegetation in India
#30DayMapChallenge Day 10: Grid
Made with @matplotlib with #NDVI data from @NASAEarthData
#python #gischat
#30DayMapChallenge Day 10: Grid
Made with @matplotlib with #NDVI data from @NASAEarthData
#python #gischat
*^ sorry, supposed to be Western Ghats.  https://abs.twimg.com/emoji/v2/... draggable="false" alt="🙊" title="Nichts sagen-Affe" aria-label="Emoji: Nichts sagen-Affe">
 https://abs.twimg.com/emoji/v2/... draggable="false" alt="😴" title="Schlafendes Gesicht" aria-label="Emoji: Schlafendes Gesicht">
Hills of southern India: Visualizing exaggerated terrain model over @OpenStreetMap map  https://abs.twimg.com/emoji/v2/... draggable="false" alt="⛰️" title="Berg" aria-label="Emoji: Berg">
#30DayMapChallenge Day 11: 3D
Made with #rayshader #rstats, using @gebcobathymetry elevation data, @Esri basemap
#rspatial #gistribe @osm_in
#30DayMapChallenge Day 11: 3D
Made with #rayshader #rstats, using @gebcobathymetry elevation data, @Esri basemap
#rspatial #gistribe @osm_in
Can you create editable #Maps in @PowerPoint?
Visualizing rainfall patterns in India with PowerPoint. Slides and objects are auto-generated from data. https://abs.twimg.com/emoji/v2/... draggable="false" alt="😃" title="Lächelndes Gesicht mit geöffnetem Mund" aria-label="Emoji: Lächelndes Gesicht mit geöffnetem Mund">
#30DayMapChallenge Day 12: Map not made with GIS software
Made with @Gramener SlideSense https://abs.twimg.com/emoji/v2/... draggable="false" alt="🖼️" title="Bilderrahmen mit Bild" aria-label="Emoji: Bilderrahmen mit Bild">, data @Indiametdept #gischat #GIS
Visualizing rainfall patterns in India with PowerPoint. Slides and objects are auto-generated from data.
#30DayMapChallenge Day 12: Map not made with GIS software
Made with @Gramener SlideSense
30 Years of Ganga Koshi Confluence: Tracing changing river courses from Landsat imagery.
Uses band combination of SWIR1,NIR,Red for color.
#30DayMapChallenge Day 13: Raster
Made with #geemap (thanks to @giswqs) #ipyleaflet data from @nasa_landsat #python #EarthEngine
Uses band combination of SWIR1,NIR,Red for color.
#30DayMapChallenge Day 13: Raster
Made with #geemap (thanks to @giswqs) #ipyleaflet data from @nasa_landsat #python #EarthEngine
Rainfall Anomaly in India: Tracking unpredictable rainfall changes. We compare annual rainfall deficits since 2001 with average baseline of 1980-2000.
#30DayMapChallenge Day 14: Climate change
made with @matplotlib data @Indiametdept #python #gis #climatechange
#30DayMapChallenge Day 14: Climate change
made with @matplotlib data @Indiametdept #python #gis #climatechange
The Toy Train Connection: Built in the 1880s, this mountain railway spanning 88km connects New Jalpaiguri (100m) to Darjeeling (2,200m elevation)
#30DayMapChallenge Day 15: Connections
Using #rstats #rayshader @isro cartodem, #openstreetmap #rspatial @osm_in @tylermorganwall
#30DayMapChallenge Day 15: Connections
Using #rstats #rayshader @isro cartodem, #openstreetmap #rspatial @osm_in @tylermorganwall
Islands of Power held by Women: A look at constituencies that have elected at least one woman MP since 1962.
There are still ~50% constituencies yet to elect a woman MP to the Indian Parliament.
#30DayMapChallenge Day 16: Islands
Made with @matplotlib #python @ecisveep
There are still ~50% constituencies yet to elect a woman MP to the Indian Parliament.
#30DayMapChallenge Day 16: Islands
Made with @matplotlib #python @ecisveep
18th Century Kingdoms of India: Interesting to see how the terrain separates the kingdoms of Malabar and Carnatic from Mysore empire, and Northern Sarkars and Nizams from the Marathas.
#30DayMapChallenge Day 17: Historical map from 1923 Atlas. Made #rstats #rayshader #rspatial
#30DayMapChallenge Day 17: Historical map from 1923 Atlas. Made #rstats #rayshader #rspatial
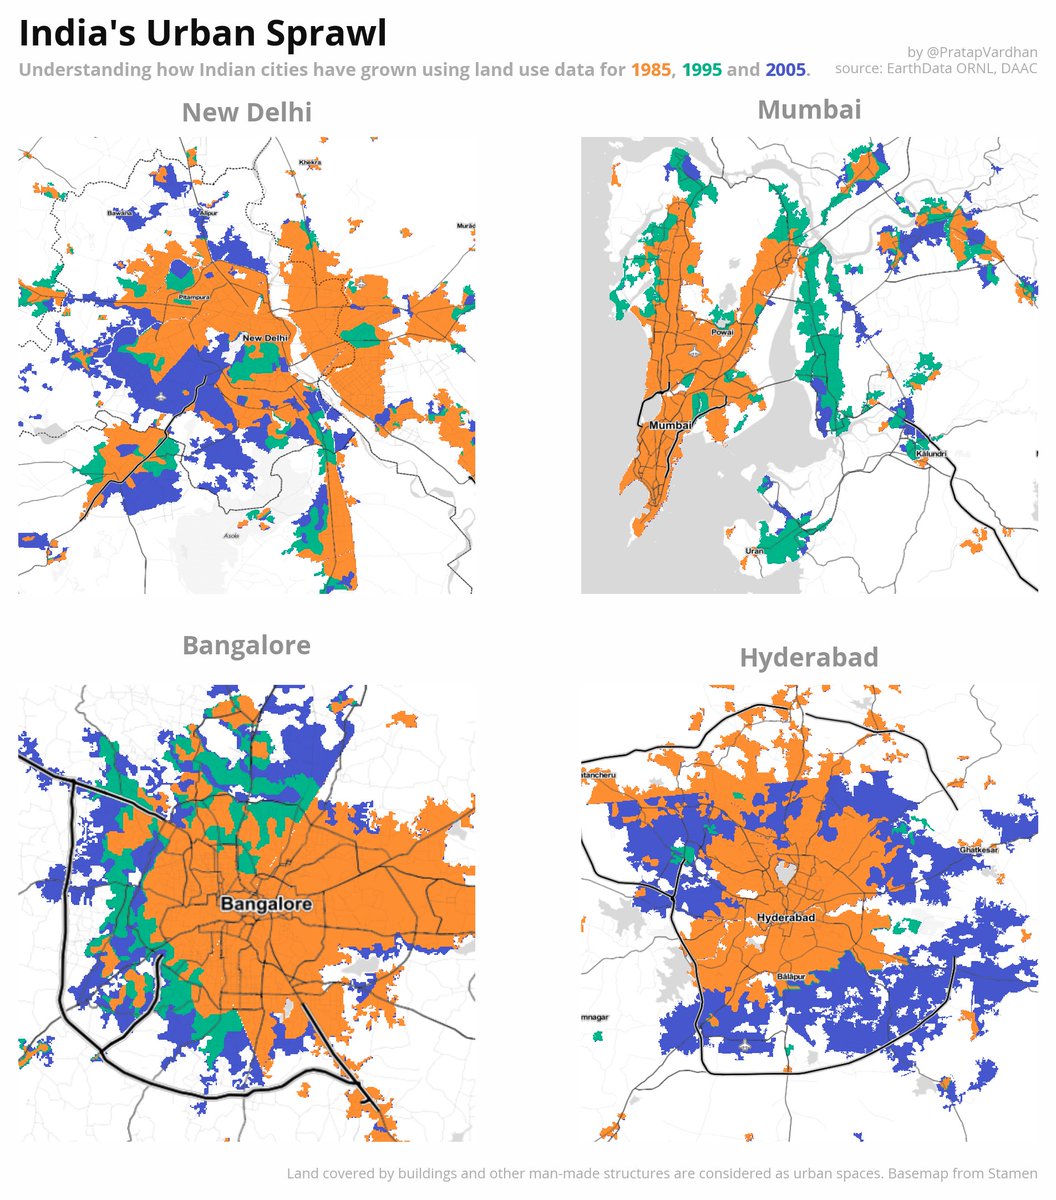
India& #39;s Urban Sprawl: Understanding how Indian cities have grown from 1985 to 1995 and to 2005, using land cover and land use data.
#30DayMapChallenge Day 18: Landuse
Made with @Matplotlib Data: @NASAEarthData DAAC ORNL #python #dataviz #rasterio
#30DayMapChallenge Day 18: Landuse
Made with @Matplotlib Data: @NASAEarthData DAAC ORNL #python #dataviz #rasterio
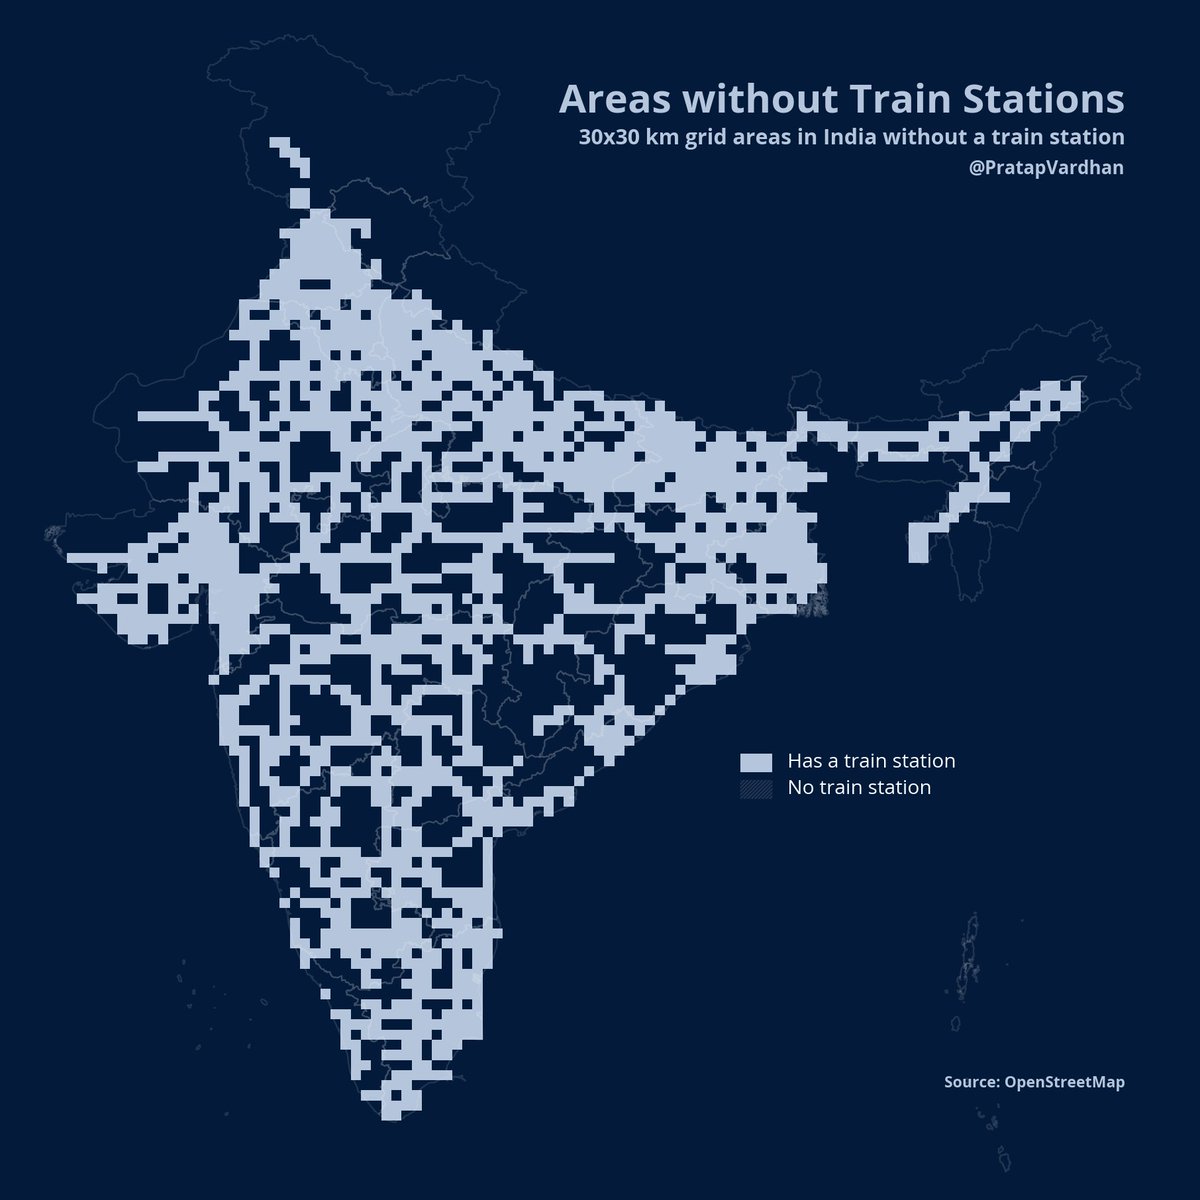
Areas without Train Stations: These are 30x30 km grid areas in India without a train station.
#30DayMapChallenge Day 19: NULL
Data: #openstreetmap Made: @Matplotlib #python #gis
#30DayMapChallenge Day 19: NULL
Data: #openstreetmap Made: @Matplotlib #python #gis
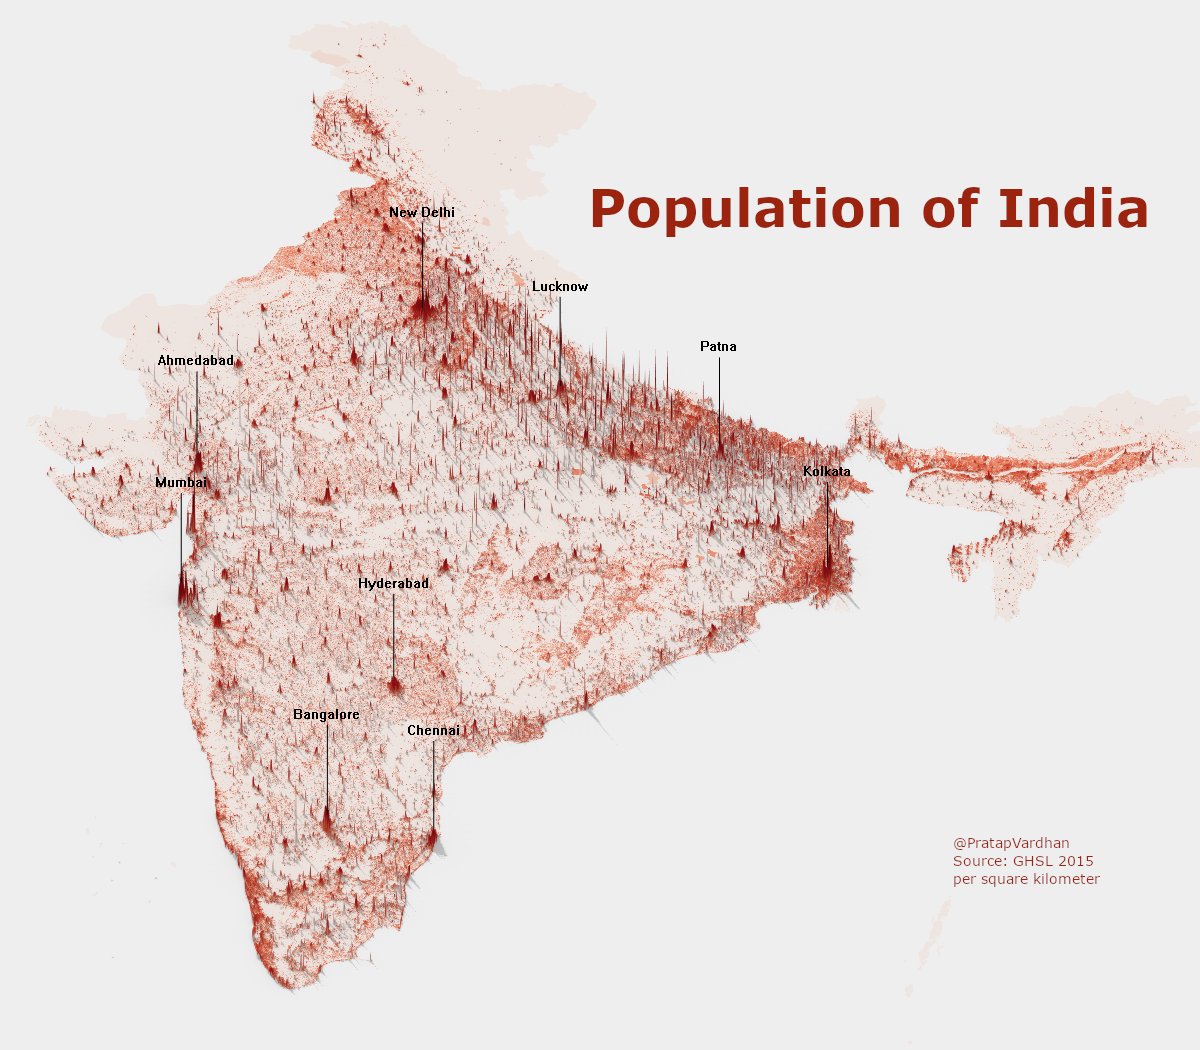
Population density of India: Pretty conspicuous that northern India across the fertile plains of river Ganges is much more densely packed than the rest of India.
#30DayMapChallenge Day 20: Population
Made with #rstats #rayshader Data from GHSL 2015 estimate. #rspatial #QGIS
#30DayMapChallenge Day 20: Population
Made with #rstats #rayshader Data from GHSL 2015 estimate. #rspatial #QGIS
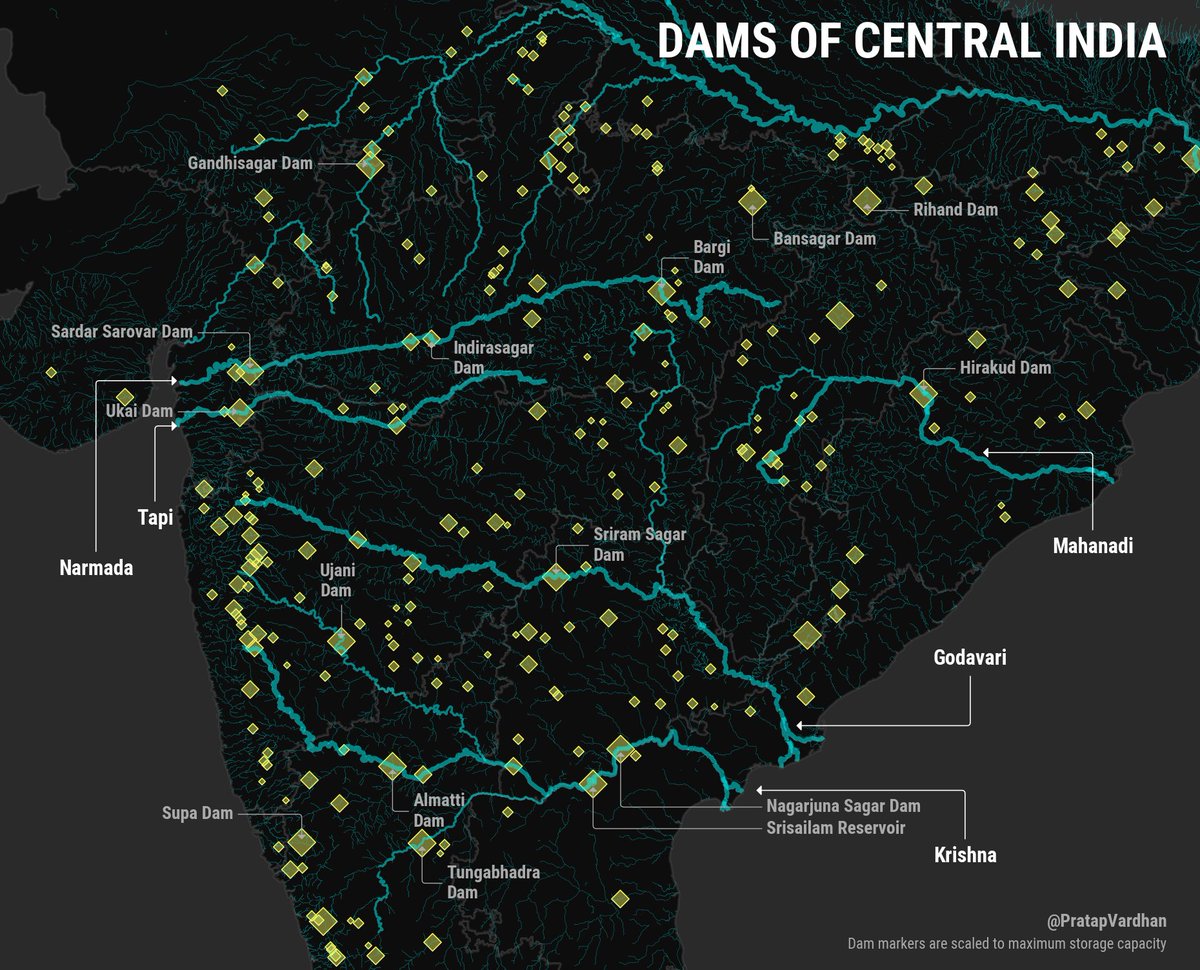
Dams of Central India: A look at how dams are built around some of the major rivers of India.
#30DayMapChallenge Day 21: Water
Made with @Matplotlib Data: GRanD, #OpenStreetMap
#python #dataviz
#30DayMapChallenge Day 21: Water
Made with @Matplotlib Data: GRanD, #OpenStreetMap
#python #dataviz
Migration in India: Mapping Inter-State migratory movements
Interesting to see that apart from Delhi and Mumbai, most state migrations happen just around the state borders.
#30DayMapChallenge Day 22: Movement
Made with @matplotlib data census 2011
#migration #python #dataviz
Interesting to see that apart from Delhi and Mumbai, most state migrations happen just around the state borders.
#30DayMapChallenge Day 22: Movement
Made with @matplotlib data census 2011
#migration #python #dataviz
Nearest Capital-based Boundaries: Mapping each district of India to the nearest capital city.
Distance from the nearest capital city is measured from district& #39;s center location.
#30DayMapChallenge Day 23: Boundaries
Made with @matplotlib #python #dataviz
Distance from the nearest capital city is measured from district& #39;s center location.
#30DayMapChallenge Day 23: Boundaries
Made with @matplotlib #python #dataviz
The origins of Ganga: Alaknanda and Bhagirathi rivers meet at Devprayag (at 830m elevation) to form Ganga, and in less than 75kms, #Ganga drops to 370m at Rishikesh.
#30DayMapChallenge Day 24: Elevation https://abs.twimg.com/emoji/v2/... draggable="false" alt="🏞️" title="Nationalpark" aria-label="Emoji: Nationalpark">
Using #rstats #rayshader @isro cartodem
#rspatial @osm_in #OpenStreetMap
#30DayMapChallenge Day 24: Elevation
Using #rstats #rayshader @isro cartodem
#rspatial @osm_in #OpenStreetMap

 Read on Twitter
 railway stations in India.Day 1: PointsLooking forward to explore https://abs.twimg.com/emoji/v2/... draggable="false" alt="🇮🇳" title="Flagge von Indien" aria-label="Emoji: Flagge von Indien"> India through geospatial visualizations with this challenge. https://abs.twimg.com/emoji/v2/... draggable="false" alt="🤞" title="Crossed fingers" aria-label="Emoji: Crossed fingers">Made with @geopandas @matplotlib" title="Kicking off the #30DayMapChallenge by visualizing the network formed by 8,697 https://abs.twimg.com/emoji/v2/... draggable="false" alt="🚉" title="Haltestelle" aria-label="Emoji: Haltestelle"> railway stations in India.Day 1: PointsLooking forward to explore https://abs.twimg.com/emoji/v2/... draggable="false" alt="🇮🇳" title="Flagge von Indien" aria-label="Emoji: Flagge von Indien"> India through geospatial visualizations with this challenge. https://abs.twimg.com/emoji/v2/... draggable="false" alt="🤞" title="Crossed fingers" aria-label="Emoji: Crossed fingers">Made with @geopandas @matplotlib" class="img-responsive" style="max-width:100%;"/>
