#30DayMapChallenge
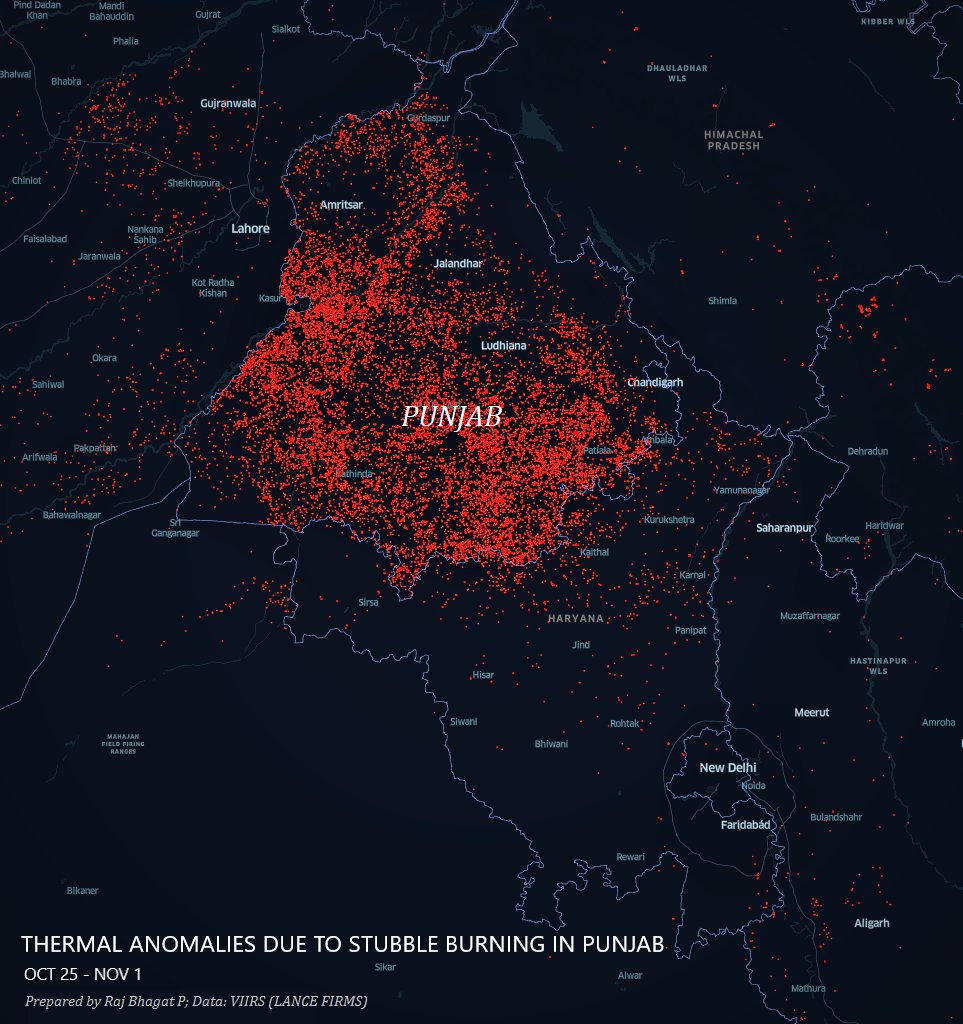
Map 1: Points
Thermal anomalies observed across Northern India in the last one week. These are primarily stubble-burning crop fire incidents in #Punjab.
Map 1: Points
Thermal anomalies observed across Northern India in the last one week. These are primarily stubble-burning crop fire incidents in #Punjab.
#30DayMapChallenge
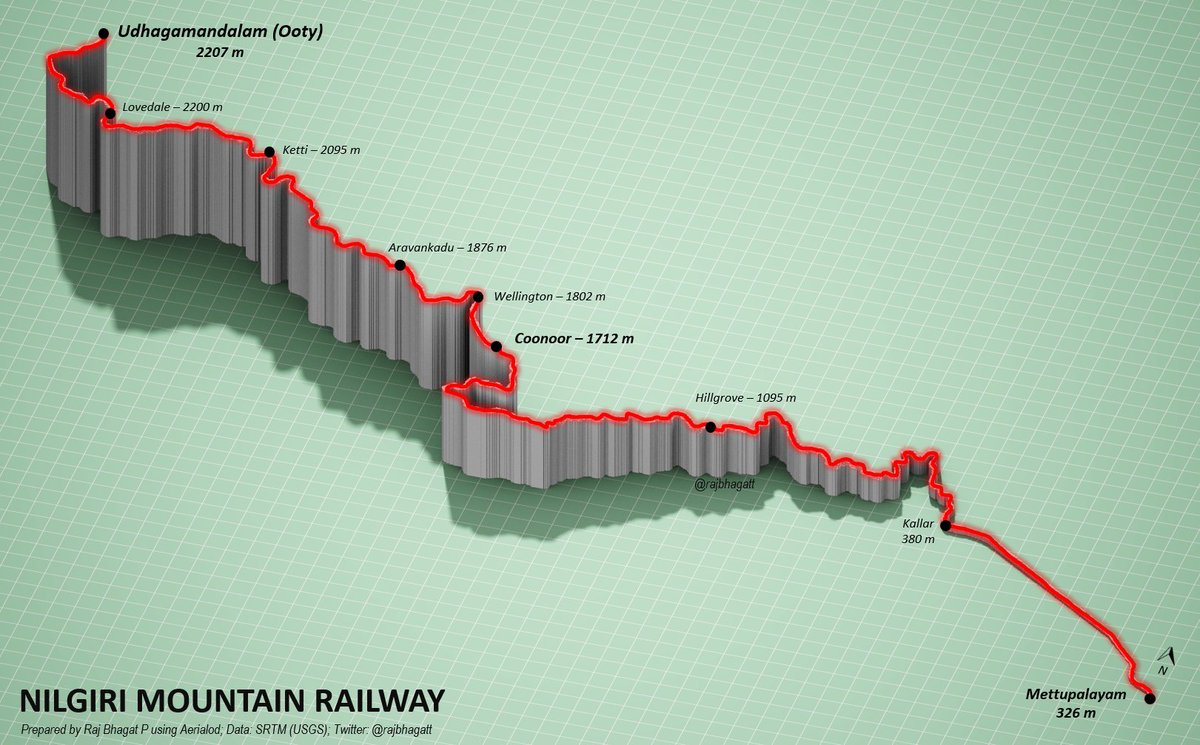
Map 2: Lines (Only one line though https://abs.twimg.com/emoji/v2/... draggable="false" alt="😋" title="Face savouring food" aria-label="Emoji: Face savouring food">)
#Viz shows the elevation profile of Nilgiri Mountain Railway in Tamil Nadu which is an UNESCO world heritage site
Map 2: Lines (Only one line though
#Viz shows the elevation profile of Nilgiri Mountain Railway in Tamil Nadu which is an UNESCO world heritage site
#30DayMapChallenge
Map 3: Polygons
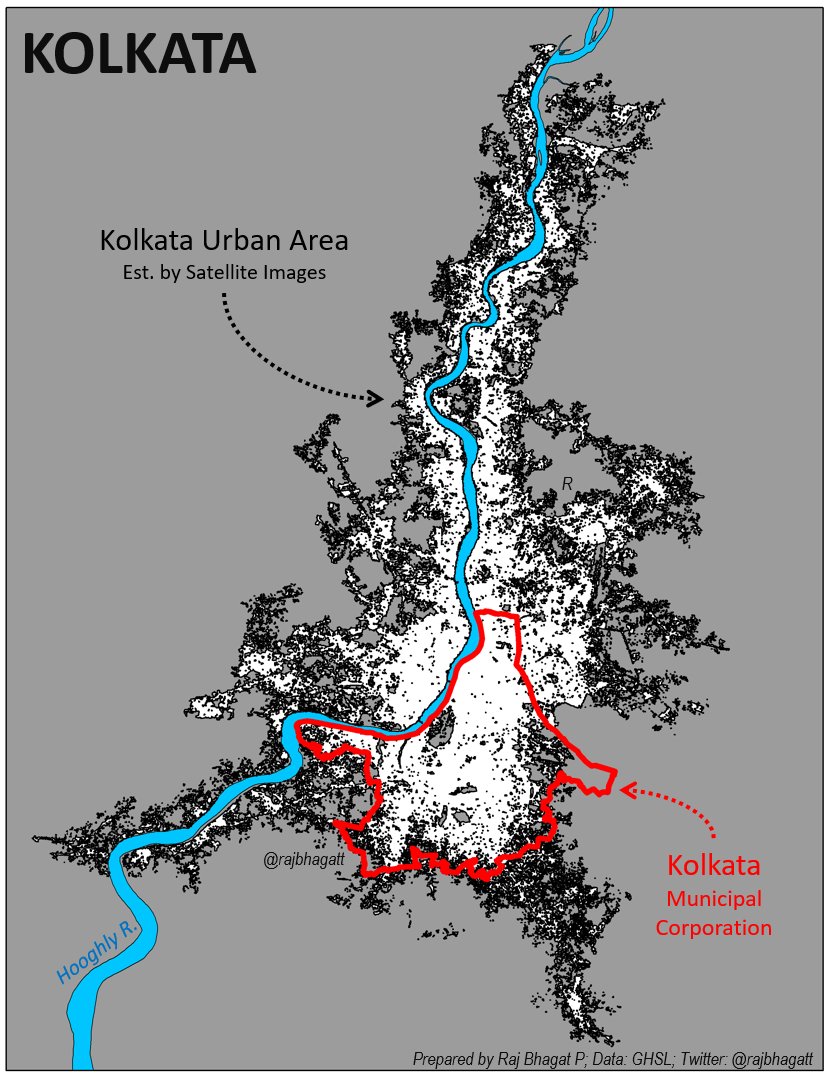
#Map shows 3 Polygon layers for #Kolkata City
1. Municipal corporation -in https://abs.twimg.com/emoji/v2/... draggable="false" alt="🔴" title="Roter Kreis" aria-label="Emoji: Roter Kreis">
2. Kolkata Urban Area -Satellite est. -in https://abs.twimg.com/emoji/v2/... draggable="false" alt="⬛️" title="Schwarzes großes Quadrat" aria-label="Emoji: Schwarzes großes Quadrat">
3. Hooghly River -in https://abs.twimg.com/emoji/v2/... draggable="false" alt="🔵" title="Blauer Kreis" aria-label="Emoji: Blauer Kreis">
DYK: More than 2/3rds of Kolkata& #39;s urban agg population lives outside the Kolkata Corporation?
Map 3: Polygons
#Map shows 3 Polygon layers for #Kolkata City
1. Municipal corporation -in
2. Kolkata Urban Area -Satellite est. -in
3. Hooghly River -in
DYK: More than 2/3rds of Kolkata& #39;s urban agg population lives outside the Kolkata Corporation?
#30DayMapChallenge
Map 4: Hexagons
#Map shows the religious landscape of #Kerala. The colour of the hexagon denotes the share of places of worship belonging to each religion.
Red-Hinduism; Blue-Christianity; Green - Islam
Created with @osm_in data on places of worship
Map 4: Hexagons
#Map shows the religious landscape of #Kerala. The colour of the hexagon denotes the share of places of worship belonging to each religion.
Red-Hinduism; Blue-Christianity; Green - Islam
Created with @osm_in data on places of worship
#30DayMapChallenge
Map 5: Blue
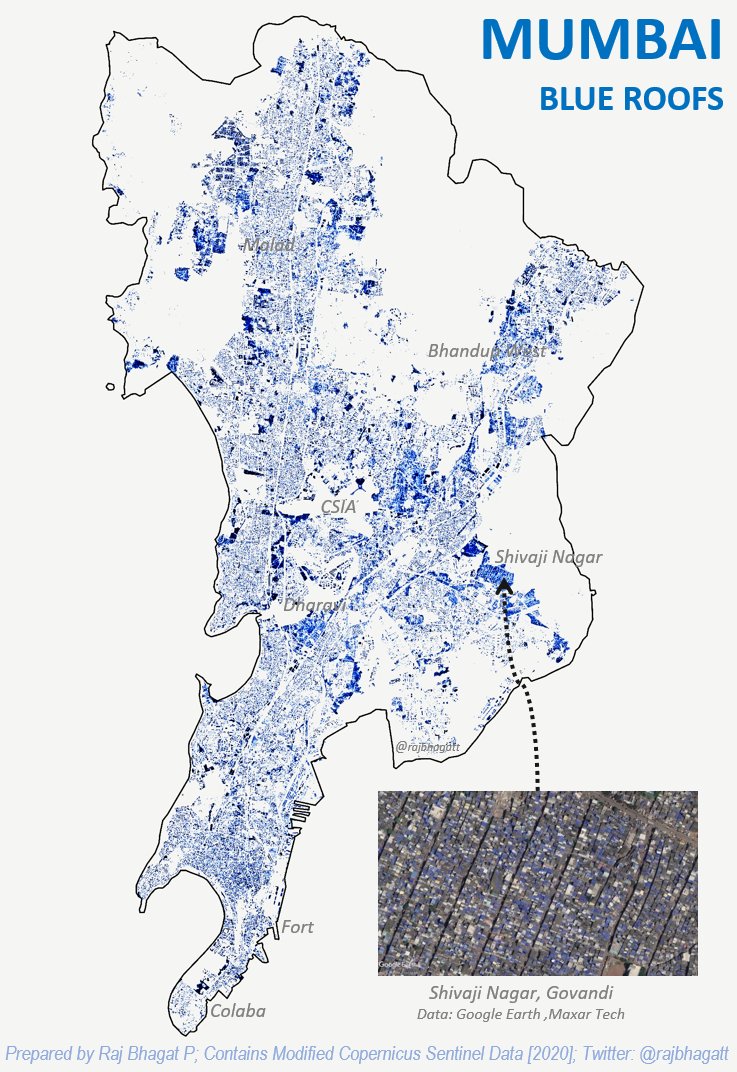
Blue domintes #Mumbai& #39;s roofing scene. Map shows areas where blue coloured roofs are prevalent. Created based on a simple processing of @CopernicusEU Satellite images
More:
https://twitter.com/WRIIndia/status/1319165743804469248">https://twitter.com/WRIIndia/...
Map 5: Blue
Blue domintes #Mumbai& #39;s roofing scene. Map shows areas where blue coloured roofs are prevalent. Created based on a simple processing of @CopernicusEU Satellite images
More:
https://twitter.com/WRIIndia/status/1319165743804469248">https://twitter.com/WRIIndia/...
#30DayMapChallenge
Map 5: Red
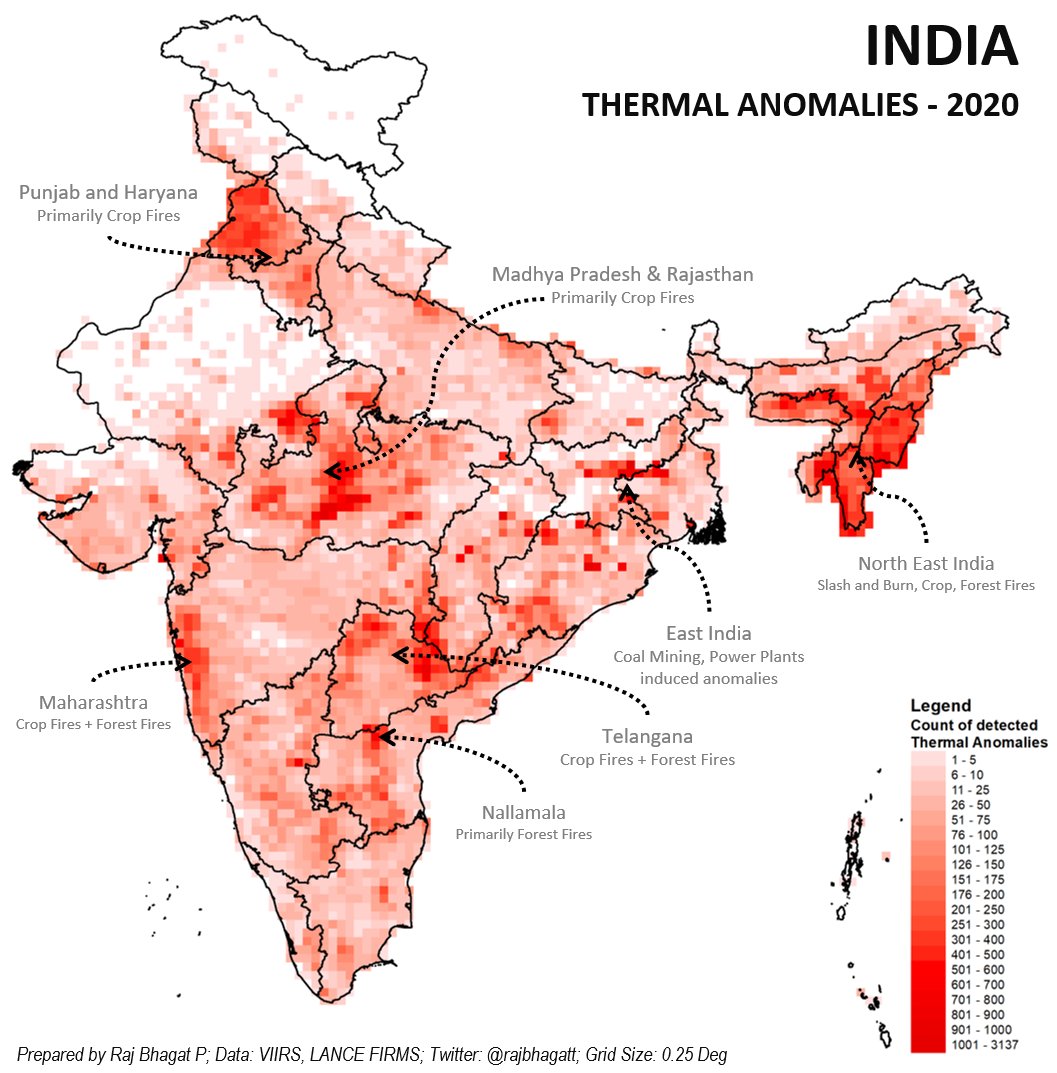
#Map shows thermal anomalies detected over India in 2020. Includes various causes such as Crop fires, Forest fires, power plants, and even landfill fires. Remember - 2 more months to go.
MadhyaPradesh is one of the leaders but hardly gets noticed
Map 5: Red
#Map shows thermal anomalies detected over India in 2020. Includes various causes such as Crop fires, Forest fires, power plants, and even landfill fires. Remember - 2 more months to go.
MadhyaPradesh is one of the leaders but hardly gets noticed
#30DayMapChallenge
Map 7: Green
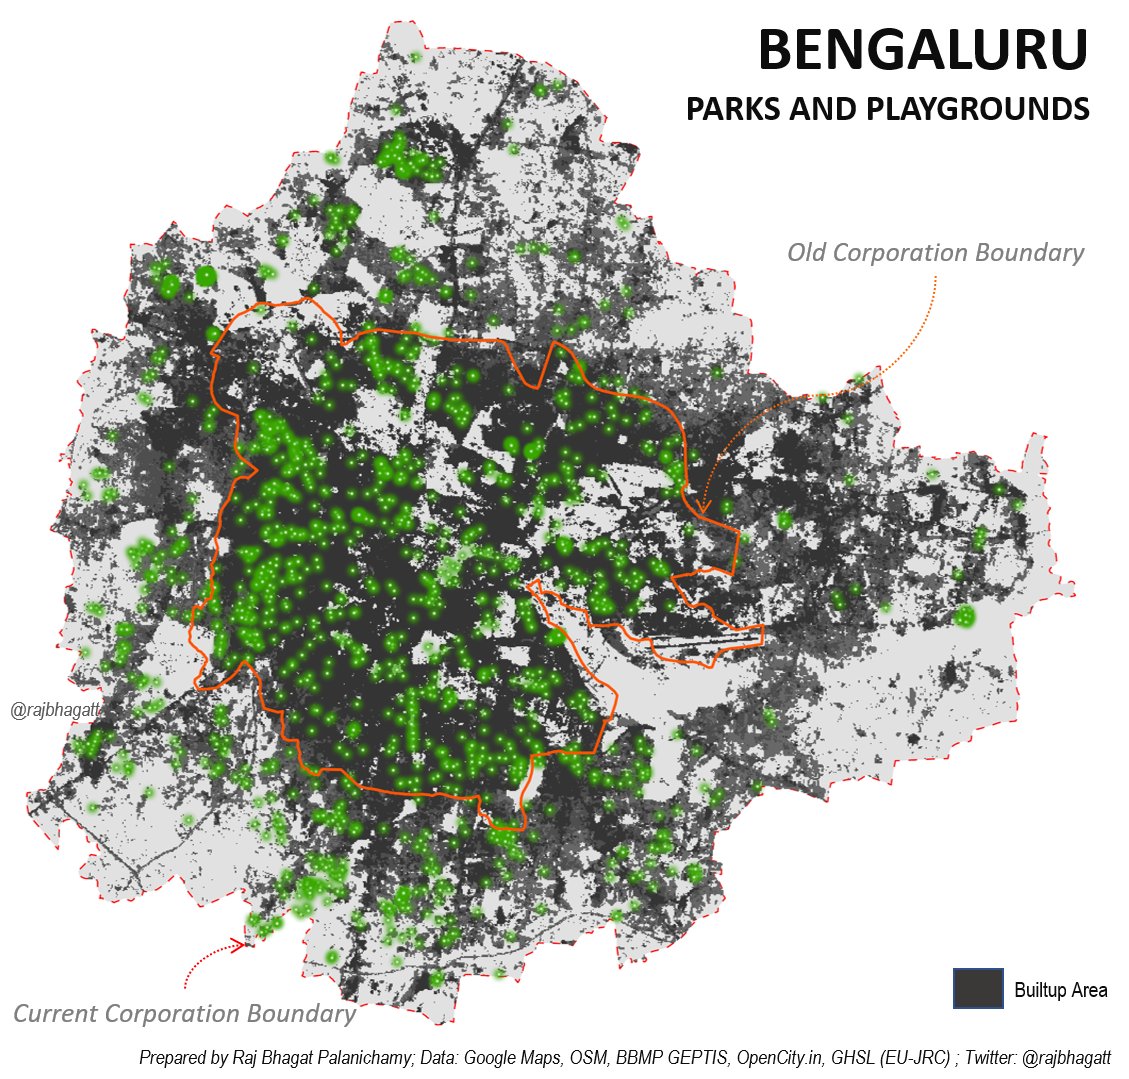
#Map shows locations of ~1400 parks & playgrounds in #Bengaluru using GMaps, OSM, BBMP lists etc shown with backdrop of builtup area. Most of the well maintained parks are within old corp. Lakes, Private spaces fulfill the requirements outside
Map 7: Green
#Map shows locations of ~1400 parks & playgrounds in #Bengaluru using GMaps, OSM, BBMP lists etc shown with backdrop of builtup area. Most of the well maintained parks are within old corp. Lakes, Private spaces fulfill the requirements outside
#30DayMapChallenge
Map 8: Yellow
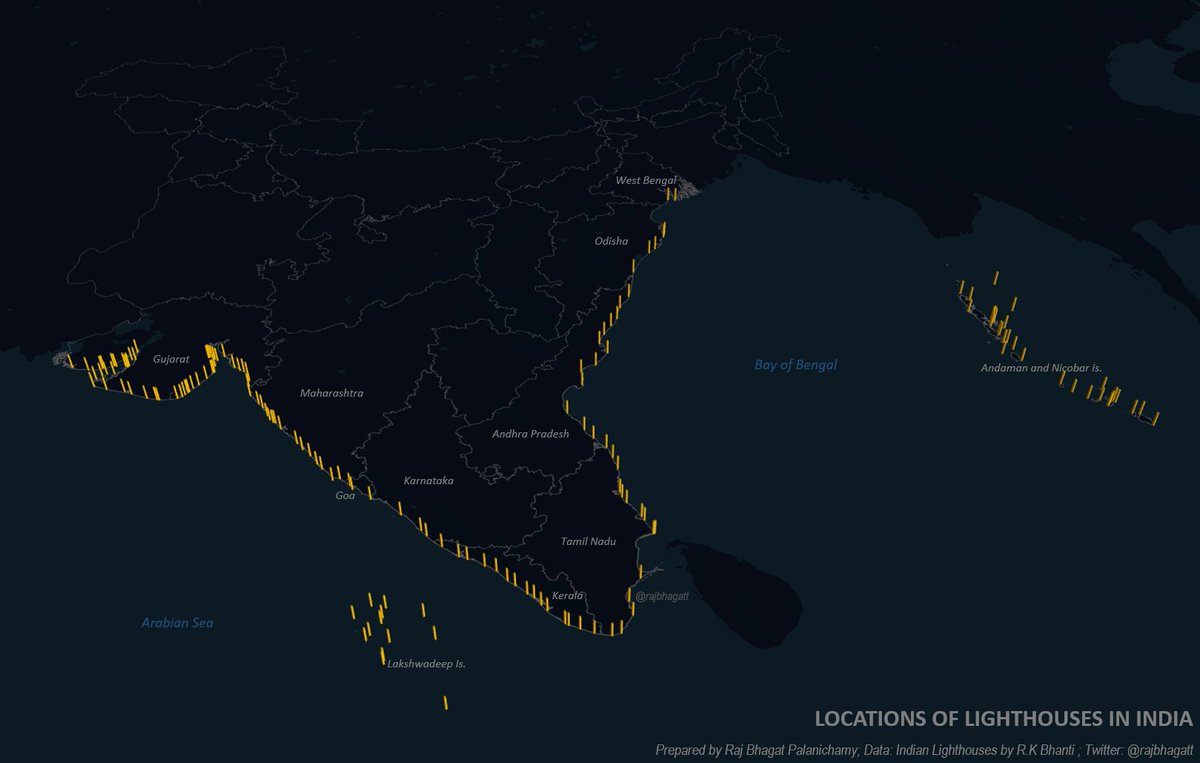
#Map shows locations of lighthouses in India. 170 Lighthouses have been marked in this.
Map 8: Yellow
#Map shows locations of lighthouses in India. 170 Lighthouses have been marked in this.

 Read on Twitter
 ) #Viz shows the elevation profile of Nilgiri Mountain Railway in Tamil Nadu which is an UNESCO world heritage site" title=" #30DayMapChallenge Map 2: Lines (Only one line though https://abs.twimg.com/emoji/v2/... draggable="false" alt="😋" title="Face savouring food" aria-label="Emoji: Face savouring food">) #Viz shows the elevation profile of Nilgiri Mountain Railway in Tamil Nadu which is an UNESCO world heritage site" class="img-responsive" style="max-width:100%;"/>
 2. Kolkata Urban Area -Satellite est. -in https://abs.twimg.com/emoji/v2/... draggable="false" alt="⬛️" title="Schwarzes großes Quadrat" aria-label="Emoji: Schwarzes großes Quadrat">3. Hooghly River -in https://abs.twimg.com/emoji/v2/... draggable="false" alt="🔵" title="Blauer Kreis" aria-label="Emoji: Blauer Kreis">DYK: More than 2/3rds of Kolkata& #39;s urban agg population lives outside the Kolkata Corporation?" title=" #30DayMapChallenge Map 3: Polygons #Map shows 3 Polygon layers for #Kolkata City1. Municipal corporation -in https://abs.twimg.com/emoji/v2/... draggable="false" alt="🔴" title="Roter Kreis" aria-label="Emoji: Roter Kreis">2. Kolkata Urban Area -Satellite est. -in https://abs.twimg.com/emoji/v2/... draggable="false" alt="⬛️" title="Schwarzes großes Quadrat" aria-label="Emoji: Schwarzes großes Quadrat">3. Hooghly River -in https://abs.twimg.com/emoji/v2/... draggable="false" alt="🔵" title="Blauer Kreis" aria-label="Emoji: Blauer Kreis">DYK: More than 2/3rds of Kolkata& #39;s urban agg population lives outside the Kolkata Corporation?" class="img-responsive" style="max-width:100%;"/>

