1/13 Children - the voiceless covid19 collateral damage. We have come a long way since the original thread. Many of the more ardent proponents of school closures have fortunately either switched feet or dialed down the intensity of their tweeting. https://twitter.com/EffectsFacts/status/1280221623686254598?s=20">https://twitter.com/EffectsFa...
2/13 For these commentators Sweden served as a bad example whenever the impact of the pandemic seemed severe. Yet when it came to children, the same people often dismissed the Swedish variety as fundamentally different from kids in the rest of the world.
3/13 The deep-seated reluctance to assign any significance to real world data from Sweden led many people to discount reports indicating that the risk of Covid19 to children (and teachers) appeared limited.
4/13 Luckily, schools have now been open for a significant time period in other parts of the world with similar results. You could therefore consider children living in Sweden to be alien lifeforms and still conclude that children are at no elevated risk from Covid19.
5/13 However, there are pockets on Twitter that remain eager to put blame on children for the spread of the virus. For example, I recently came across this thread where the comments have an undertone of disgust with children that I found disturbing. https://twitter.com/DrEricDing/status/1320209842859134977?s=20">https://twitter.com/DrEricDin...
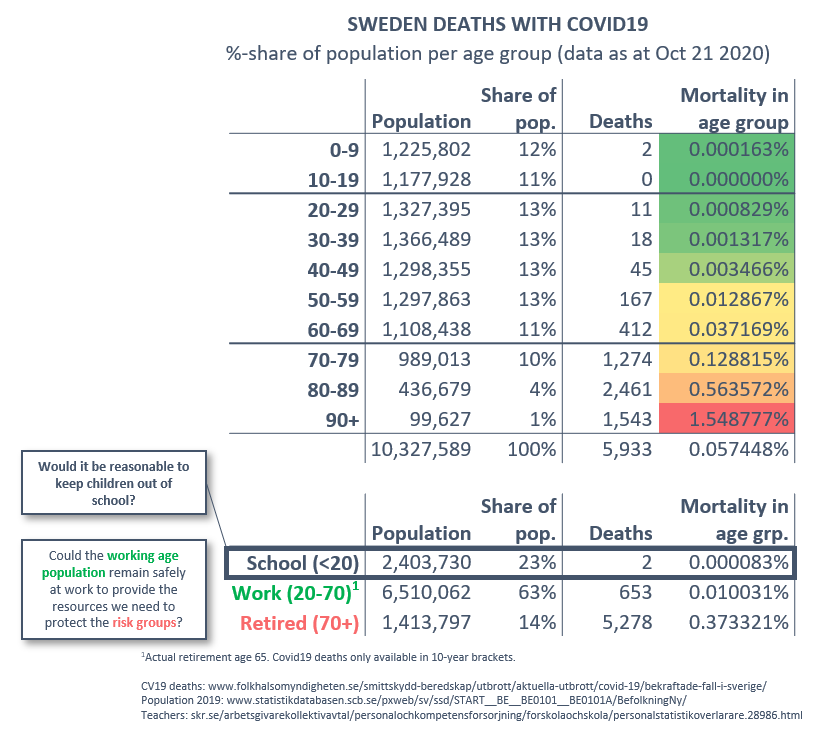
6/13 There is evidently a need to repeat the facts: Sweden didn’t close schools<16 throughout the pandemic. Out of 2.4m people <20 years old, 2 have died with covid19 (0.000083% PFR). For context, there were 289 all cause deaths for <15-year old’s week 6-41.
7/13 The PFR for the age group normally working in schools is 0.01% (653 deaths out of 6.5m pop. 20-70yrs). Studies show teachers had no elevated risk of contracting Covid19 compared to the working pop. at large (possibly even at lower relative risk).
https://twitter.com/NahasNewman/status/1288238263011082240?s=20">https://twitter.com/NahasNewm...
https://twitter.com/NahasNewman/status/1288238263011082240?s=20">https://twitter.com/NahasNewm...
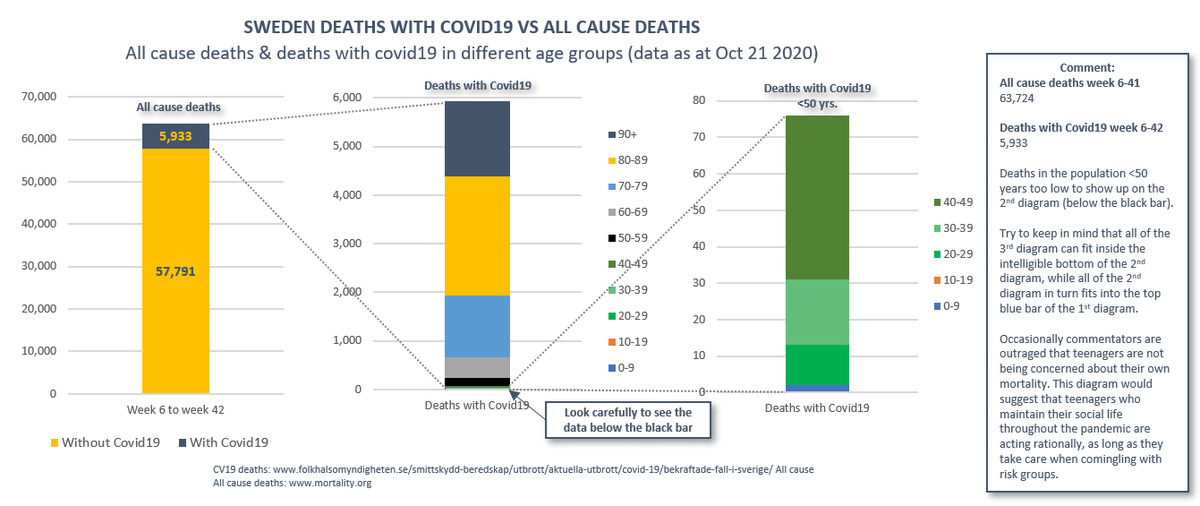
8/13 Covid19 currently accounts for less than 6k out of 64k all cause deaths (9%). The 76 deaths with covid19 under 50 years old (3rd diagram) is equivalent to 0.1% of all cause deaths for the same period and would be impossible to identify visually if included in the 1st diagram
9/13 If adjusted for demography, the mortality this cycle has been the 2nd lowest in the last 12 years for all age groups, apart from 85+ (which recorded the 6th lowest mortality). https://twitter.com/EffectsFacts/status/1314263092675706881?s=20">https://twitter.com/EffectsFa...

 Read on Twitter


