So this is the wildest debugging technique I& #39;ve used recently: OpenGL, being a stateful API, has a bunch of relatively generic entry points that can set states nowhere near where you use them. Decades of OpenGL wisdom says "cache all the state you can and don& #39;t set it twice."
So occasionally you find yourself with, I don& #39;t know, one single rock in the back of a scene that& #39;s bright white without any clear idea of when it got drawn or when the wrong state that caused the problem got set.
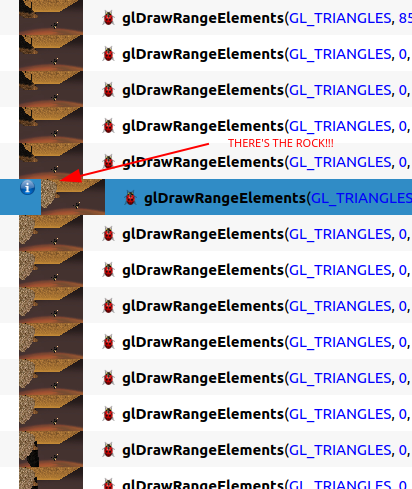
First step to debug: ApiTrace. Capture a run with the problem, hit CTRL-T to get a thumbnail of every draw call, find the one that draws the rock. Sometimes the problem is super-obvious at this point when you examine state, bound textures, etc. If not, we move on to cheating:
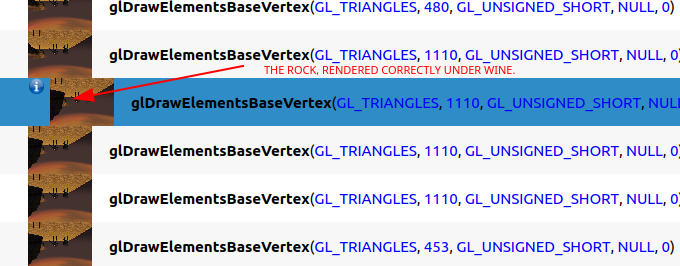
For some games, I will run the Windows version through PIX on Windows, and compare the Direct3D draw calls to my OpenGL. But this game is Direct3D 8, which PIX doesn& #39;t support. ApiTrace _should_ support D3D8, but I couldn& #39;t swing it. Soooo...I ran it under ApiTrace...under Wine.
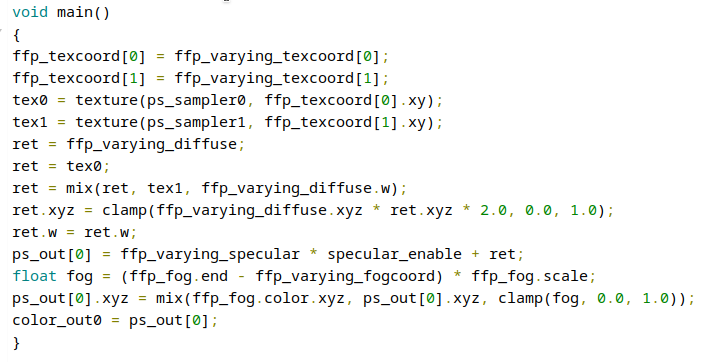
Wine does wild stuff to support Direct3D, including converting its fixed-function pipeline to GLSL shaders on the fly. Which is impressive, but also helpful, because it removes the question of "what weird side state might be affecting me here?" The shader does just what it needs.
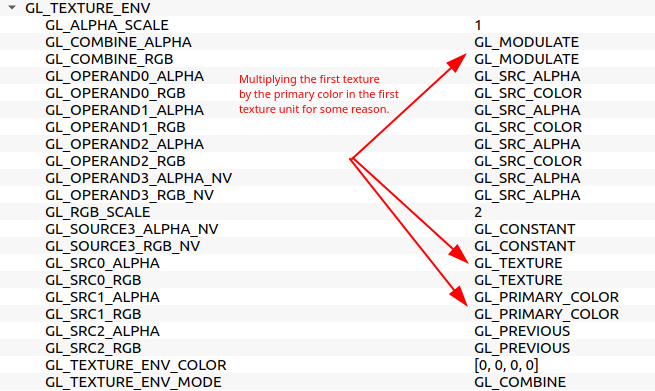
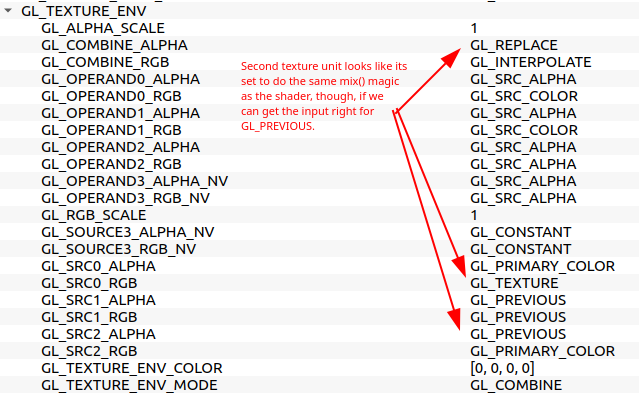
What I could see from this shader is that it wants to mix() the first sampled texture with the second, interpolating on the primary color& #39;s alpha. But my GL code& #39;s texture environment wasn& #39;t doing this. Why?
There& #39;s nowhere anywhere near this draw call this state gets set (the game notices it& #39;s already set correctly and doesn& #39;t set it again), and the place where it processes the game data into GL states to be set later happened 17 million years ago, elsewhere in some unknown place.
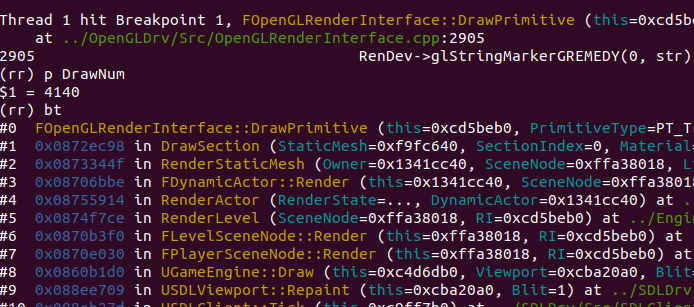
So I added a counter that increments every time there& #39;s a draw call, and some code that will annotate the ApiTrace output with this counter...
...and then I ran the game under "rr record" ...and ran *that* under ApiTrace.
rr is _amazing_. It basically lets you record a run of a program and then play it back, tivo& #39;ing back and forth with GDB to track down your bug: https://rr-project.org/ ">https://rr-project.org/">...
rr is _amazing_. It basically lets you record a run of a program and then play it back, tivo& #39;ing back and forth with GDB to track down your bug: https://rr-project.org/ ">https://rr-project.org/">...
...and the ability to park the debugger exactly at that call and then step backwards in time to figure out why it set up the GL state incorrectly. Turns out there was a switch statement missing a case to set up the specific operation I needed in the GL code, so it used a default.
In conclusion, I will be humble when I accept my Nobel Prize for making this rock in the background not render too brightly.

 Read on Twitter