When it comes to LV diastolic (dys)function, let& #39;s think of the LV like a spring, which is compressed during systole, and recoils during diastole.
A thread https://abs.twimg.com/emoji/v2/... draggable="false" alt="🧵" title="Thread" aria-label="Emoji: Thread">
1/n
@strain_rate @load_dependent @DrWillWatson @shaunrobinson02 @leoshmu https://twitter.com/strain_rate/status/1321203458079367170">https://twitter.com/strain_ra...
A thread
1/n
@strain_rate @load_dependent @DrWillWatson @shaunrobinson02 @leoshmu https://twitter.com/strain_rate/status/1321203458079367170">https://twitter.com/strain_ra...
The physics governing the recoil of a spring are well described as a damped harmonic oscillator, and it is well validated that the Doppler E-wave is governed by these same physics, aka parameterized diastolic filling (PDF) [ http://pubmed.gov/3812709 ].">https://pubmed.gov/3812709&q...
2/n
2/n
This means that the shape of the E-wave can be excellently curve fit to a function that describes the behavior of a damped harmonic oscillator. Figure from http://pubmed.gov/33066772
3/n">https://pubmed.gov/33066772&...
3/n">https://pubmed.gov/33066772&...
This mathematical function is uniquely described by three parameters, namely:
1. stiffness (k) - LV myocardial stiffness
2. damping (c) - the relaxation or viscoelastic property of the LV myocardium
3. load (x0) - the volume load, proportional to E-wave VTI
4/n
1. stiffness (k) - LV myocardial stiffness
2. damping (c) - the relaxation or viscoelastic property of the LV myocardium
3. load (x0) - the volume load, proportional to E-wave VTI
4/n
The key here is the difference between stiffness and damping. These words are sometimes used sloppily in cardiology, but being specific about them is important.
5/n
5/n
Stiffness contributes to the force DRIVING the recoil of the LV during diastole.
In contrast, damping contributes to the force OPPOSING the recoil of the LV during diastole.
6/n
In contrast, damping contributes to the force OPPOSING the recoil of the LV during diastole.
6/n
This has mechanistic consequences that make it possible to understand that diastolic dysfunction (DD) is different in different disease states.
7/n
7/n
For example, DD in  https://abs.twimg.com/emoji/v2/... draggable="false" alt="⬇️" title="Pfeil nach unten" aria-label="Emoji: Pfeil nach unten">EF is mostly characterized by
  https://abs.twimg.com/emoji/v2/... draggable="false" alt="⬆️" title="Pfeil nach oben" aria-label="Emoji: Pfeil nach oben">stiffness but unchanged damping [ http://pubmed.gov/33066772 ],">https://pubmed.gov/33066772&... but DD in hypertensive heart disease is mostly
  https://abs.twimg.com/emoji/v2/... draggable="false" alt="⬆️" title="Pfeil nach oben" aria-label="Emoji: Pfeil nach oben">damping but unchanged stiffness [ http://pubmed.gov/9336374 ].
8/n">https://pubmed.gov/9336374&q...
8/n">https://pubmed.gov/9336374&q...
While it remains to be shown, it is thought that:
Stiffness is related to titin, elastin, collagen, recoil of the great vessels and pericardium
Damping is related to calcium sequestration and cross-bridge uncoupling.
9/n
Stiffness is related to titin, elastin, collagen, recoil of the great vessels and pericardium
Damping is related to calcium sequestration and cross-bridge uncoupling.
9/n
Note, these are two very different pathophysiological manifestations.
That said, disturbances in both stiffness and damping can occur at the same time, and likely overlap in a number of heart diseases.
10/n
That said, disturbances in both stiffness and damping can occur at the same time, and likely overlap in a number of heart diseases.
10/n
Notably, the PDF method can both describe the E-wave and e& #39;-wave. Using the e& #39;-wave as an example, the PDF method has been shown to be mathematically identical [ http://pubmed.gov/32142380 ]">https://pubmed.gov/32142380&... to the Force Balance Model of DD [ http://pubmed.gov/21317306 ].
11/n">https://pubmed.gov/21317306&...
11/n">https://pubmed.gov/21317306&...
So, how does one do this PDF method analysis that you speak of?
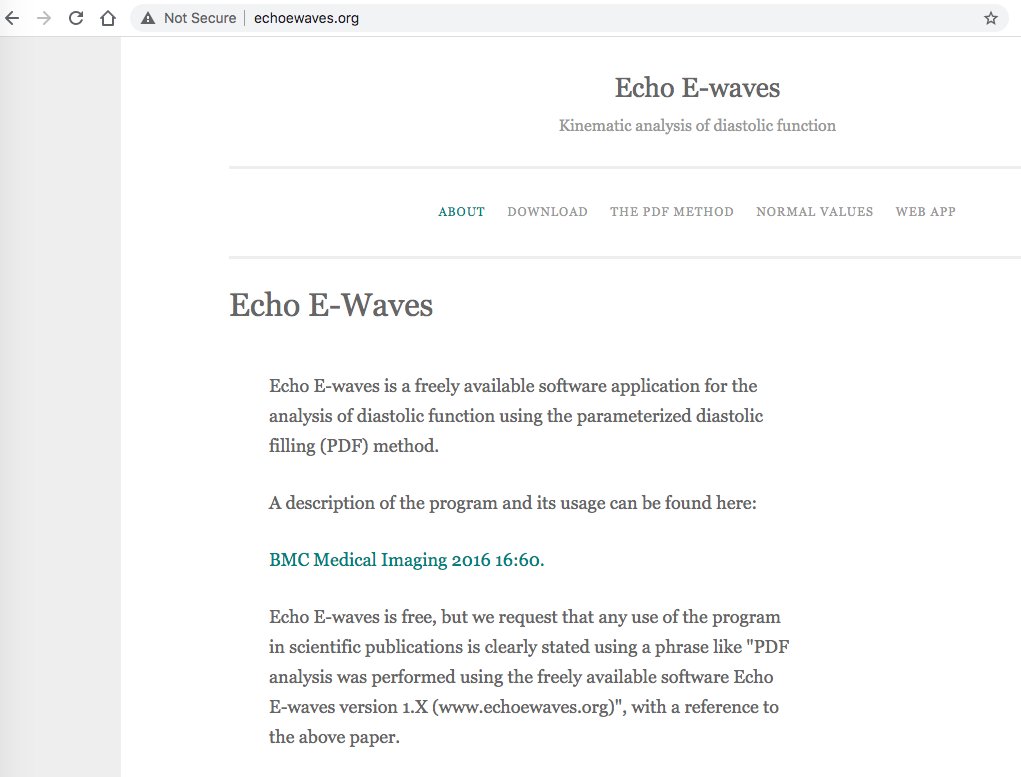
Fortunately, there& #39;s published [ http://pubmed.gov/27784288 ]">https://pubmed.gov/27784288&... and freely available software if you want to curve fit one or more Doppler E-waves from dicom images. http://www.echoewaves.org"> http://www.echoewaves.org
12/n
Fortunately, there& #39;s published [ http://pubmed.gov/27784288 ]">https://pubmed.gov/27784288&... and freely available software if you want to curve fit one or more Doppler E-waves from dicom images. http://www.echoewaves.org"> http://www.echoewaves.org
12/n
But there is an even easier method. If one measures the E-wave deceleration time (DT), acceleration time (AT), and E-wave Vmax (E), then one can simply calculate stiffness, damping and load [ http://pubmed.gov/29340885 ].">https://pubmed.gov/29340885&... I call this the DTATE method.
13/n
13/n
On http://www.echoewaves.org"> http://www.echoewaves.org there is a link to a free Web App, which let& #39;s you enter DTATE measurements, and output stiffness (k), damping (c), etc, and you can compare these to published normal values http://echoewaves.org/normal-values/ ">https://echoewaves.org/normal-va...
14/n
14/n
In closing, our lab& #39;s experience w the PDF method:
1. It is more variable to measure than conventional measures of DD, making cutoffs for clinical decision-making challenging.
2. The method provides valuable mechanistic insight on a group level.
15/15
1. It is more variable to measure than conventional measures of DD, making cutoffs for clinical decision-making challenging.
2. The method provides valuable mechanistic insight on a group level.
15/15

 Read on Twitter
 1/n @strain_rate @load_dependent @DrWillWatson @shaunrobinson02 @leoshmu https://twitter.com/strain_ra..." title="When it comes to LV diastolic (dys)function, let& #39;s think of the LV like a spring, which is compressed during systole, and recoils during diastole. A thread https://abs.twimg.com/emoji/v2/... draggable="false" alt="🧵" title="Thread" aria-label="Emoji: Thread"> 1/n @strain_rate @load_dependent @DrWillWatson @shaunrobinson02 @leoshmu https://twitter.com/strain_ra..." class="img-responsive" style="max-width:100%;"/>


