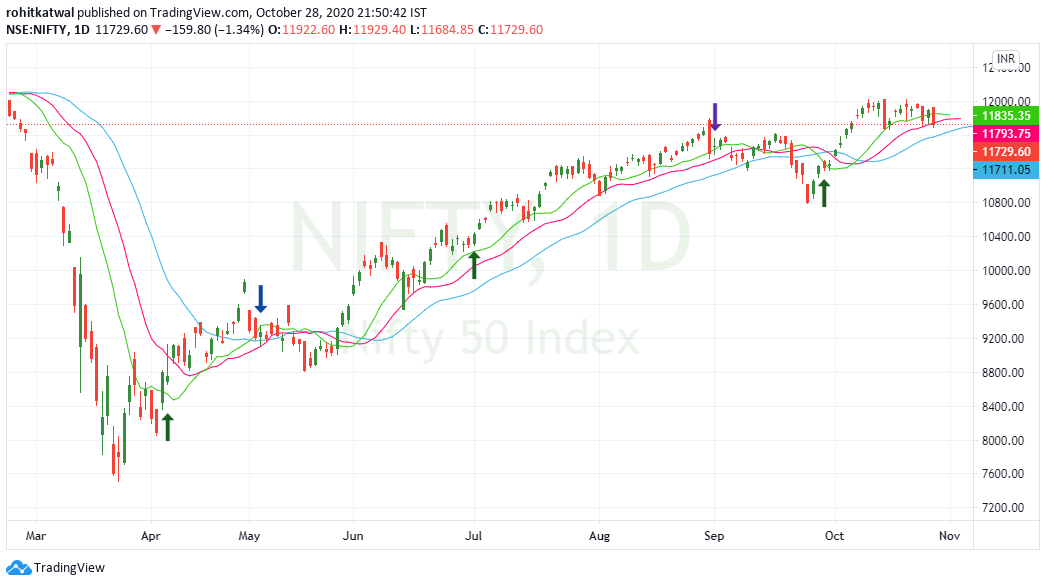
Is it possible to predict probable Top and Bottom on #Nifty #Nifty50 using #INDIAVIX ?
Lets find out.
#INDIAVIX is a measure of market’s expectation of volatility over the near term. VIX is computed using the order book of the underlying index options i.e #Nifty.
...1/n
Lets find out.
#INDIAVIX is a measure of market’s expectation of volatility over the near term. VIX is computed using the order book of the underlying index options i.e #Nifty.
...1/n
VIX is denoted as an annualized percentage. Higher the VIX, higher the expected volatility.
When Nifty goes up, VIX reduces. When Nifty goes down, VIX increases. Its an inverse relationship. Why?
In my past tweets, I mentioned IV is demand and supply.
...2/n
When Nifty goes up, VIX reduces. When Nifty goes down, VIX increases. Its an inverse relationship. Why?
In my past tweets, I mentioned IV is demand and supply.
...2/n
Puts are bought as hedge. When fear is less in the market, demand of puts is less and hence prices are low and hence low IV which results in Low Vix. When fear sets in, market dips and demand for put increases with increase in IV, VIX increases.
...3/n
...3/n
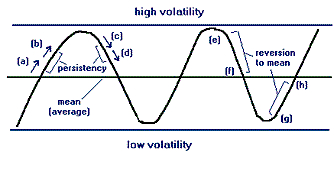
Volatility or #INDIAVIX has three main characteristics:
1. Cyclical - Vix is cyclical with low and high cycles
2. Persistent - Once it starts to rise, it keeps on rising and vice-versa
3. Mean Reversing - Its mean reversing by nature.
...4/n
1. Cyclical - Vix is cyclical with low and high cycles
2. Persistent - Once it starts to rise, it keeps on rising and vice-versa
3. Mean Reversing - Its mean reversing by nature.
...4/n
Extreme reading coincides with market extremes. When #VIX is extremely high & starts to reverse, we look for buys. When VIX is extremely low and starts to reverse, we look for sells. But how to calculate extremes?
Problem is solved by CVR3 Trading Strategy.
...5/n
Problem is solved by CVR3 Trading Strategy.
...5/n
The CVR3 is a short-term trading strategy using the CBOE Volatility Index to time the S&P 500. Developed by Larry Connors & Dave Landry, this strategy looks for overextended VIX readings to signal excessive fear or greed in the stock market
https://school.stockcharts.com/doku.php?id=trading_strategies:cvr3_vix_market_timi#:~:text=The%20CVR3%20is%20a%20short,greed%20in%20the%20stock%20market.">https://school.stockcharts.com/doku.php...
https://school.stockcharts.com/doku.php?id=trading_strategies:cvr3_vix_market_timi#:~:text=The%20CVR3%20is%20a%20short,greed%20in%20the%20stock%20market.">https://school.stockcharts.com/doku.php...
Extremes can be calculated as:
1. Sufficient Divergence from Mean which is 10 MA.
2. Extreme Values in short term i.e. 5% or 10% divergence from 10 MA.
So when we get these conditions met on #INDIAVIX, we have inverse signal on #NIFTY #NIFTY50.
...7/n
1. Sufficient Divergence from Mean which is 10 MA.
2. Extreme Values in short term i.e. 5% or 10% divergence from 10 MA.
So when we get these conditions met on #INDIAVIX, we have inverse signal on #NIFTY #NIFTY50.
...7/n
Rules for Buy:
1. The daily low is above its 10-day moving average.
2. The daily close is 10% above its 10-day moving average.
3. The close is below the open.
Rules for Sell inverse
1. Daily High is below 10 MA
2. Close below 10% of 10 MA
3. Close>Open
...8/n
1. The daily low is above its 10-day moving average.
2. The daily close is 10% above its 10-day moving average.
3. The close is below the open.
Rules for Sell inverse
1. Daily High is below 10 MA
2. Close below 10% of 10 MA
3. Close>Open
...8/n
When above criteria meets for buy on #INDIAVIX, we assume a temporary top is in place with Candle High as SL.
When sell criteria meets, we assume temporary bottom is in place with Candle low as SL.
If this information is known i.e. what is probable top/bottom
9/n
When sell criteria meets, we assume temporary bottom is in place with Candle low as SL.
If this information is known i.e. what is probable top/bottom
9/n
Then an #OptionTrader can plan his trade in N number of ways. He can do Calendars, Credit/Debit Spreads or can simply go directional according to his/her Risk-Management and Trading System. It can help in getting an early reversal based on Options Order Book.
10/n
10/n
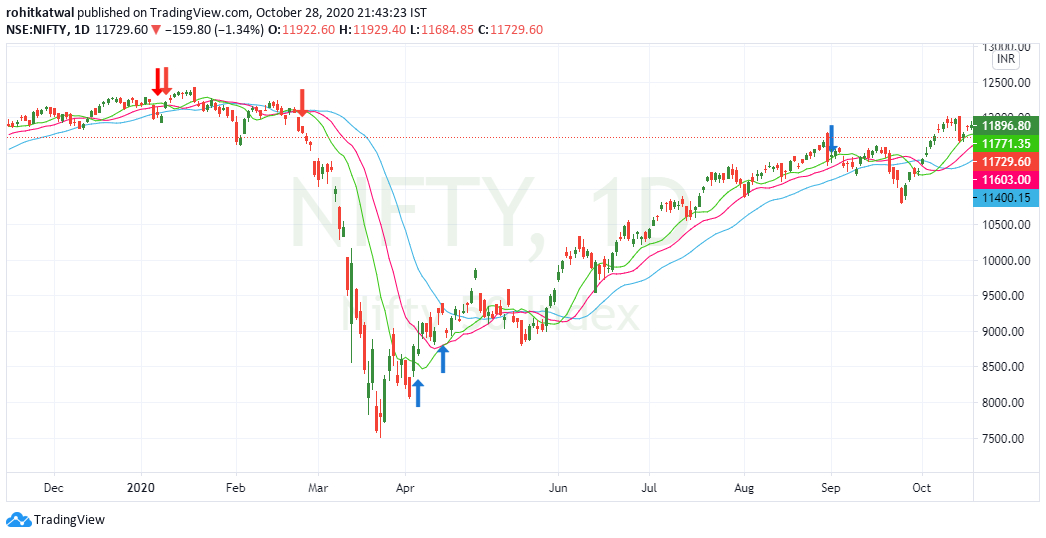
On #NIFTY Buy signals, price has to be lowest in last 15 days. On #NIFTY Sell Signals, price has to be at the highest in last 15 days. This I do by manually looking at the price charts.
11/n
11/n
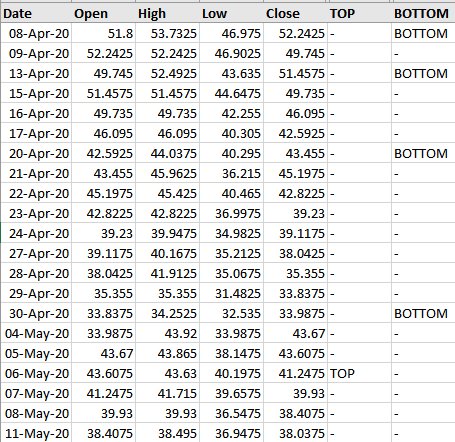
When implemented extremes at 10% in excel sheet which I make my self, this is how it gives the output on Excel. I am attaching a corresponding chart displaying probable tops and bottom.
12/n
12/n
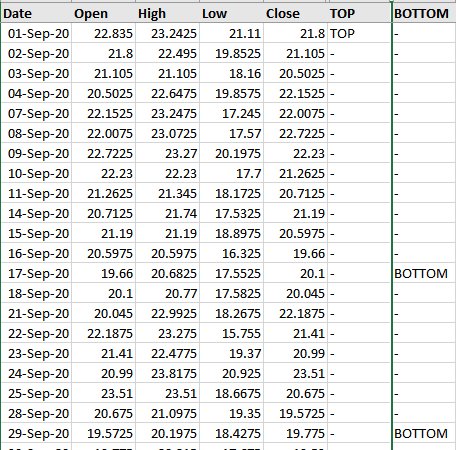
When Implemented extremes at 5% :
I use this to actively monitor quantitative tops and bottom on #Nifty as I am an Option Strategist. Sharing for education purpose. Test and use with care.
End of Thread. Open for discussion and Retweet.
I use this to actively monitor quantitative tops and bottom on #Nifty as I am an Option Strategist. Sharing for education purpose. Test and use with care.
End of Thread. Open for discussion and Retweet.

 Read on Twitter