My esteemed colleagues & I have a new paper out.
It tries to understand decompose where innovation drivers acted to lower onshore #wind #turbine prices
But there is a sneaky hidden objective here - to be revealed at the end of thread 1/n https://www.sciencedirect.com/science/article/pii/S0301421520306236?CMX_ID=&SIS_ID=&dgcid=STMJ_AUTH_SERV_PUBLISHED&utm_acid=126533279&utm_campaign=STMJ_AUTH_SERV_PUBLISHED&utm_in=DM89166&utm_medium=email&utm_source=AC_">https://www.sciencedirect.com/science/a...
First some background: Onshore wind turbine prices rose from around 2002 as the development of todays modern large MW scale turbines accelerated, raw materials costs increased & demand outstripped supply, allowing juicy margins for some, but since 2008/10 prices have fallen 2/n
But how important were each of those drivers? Since 2008/10 what was learning by doing, innovation and market dynamics contribution to driving down prices? Well, data availability makes that a tricky thing to figure out, but we wanted a better understanding... 3/n
..so we dived down the rabbit hole.
But first, the framework.
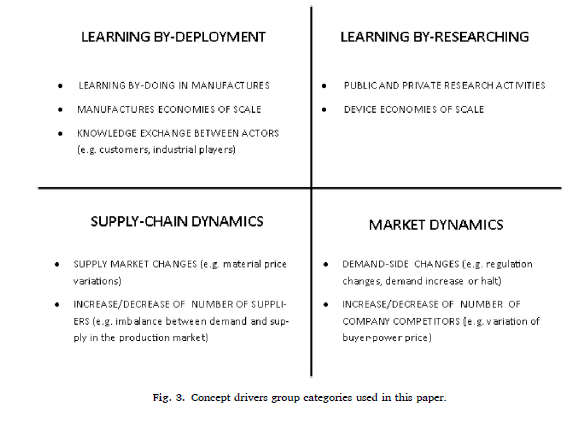
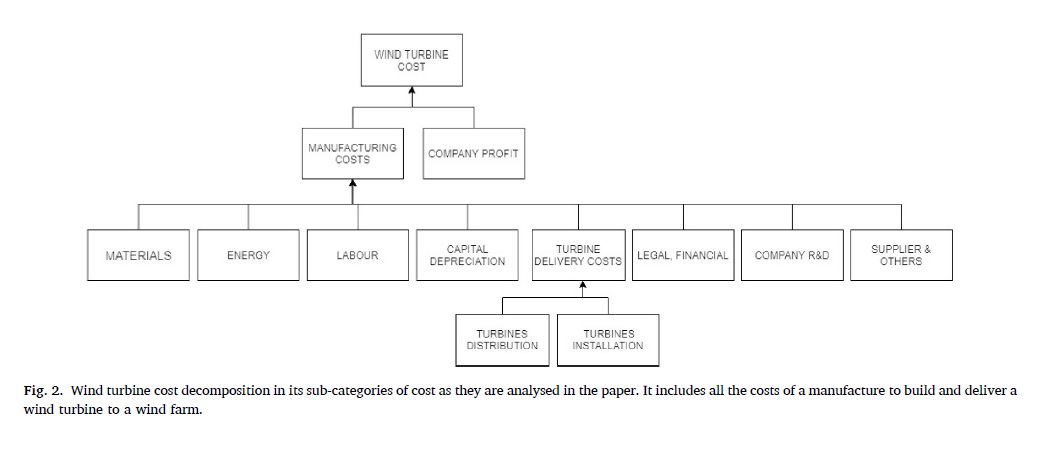
What we wanted to understand was how different learning dynamics were driving the price reduction. To have any hope of doing that, we needed to decompose the cost components of wind turbine prices 4/n
But first, the framework.
What we wanted to understand was how different learning dynamics were driving the price reduction. To have any hope of doing that, we needed to decompose the cost components of wind turbine prices 4/n
This is important, because the more granular the cost categories, the greater opportunity to allocate individual cost reduction drivers to a learning dynamic. Some choices would still be arbitrary, but we could run sensitivity analysis to see the range of impacts 5/n
Lets take an example: If we could decompose materials costs into an intensity affect (kg/kW) and price component ($/kg) we can start to at least carve out some of the supply chain dynamics (materials pricing) from other factors (e.g., learning by doing & researching) 6/n
So we have a framework to approach this and IRENA already has some data, but ONG its clear why this has not been attempted very often, the difficulty in obtaining data is off the scale.
In the end (& do read the paper 4 details) what we have is used the best available data 7/n
In the end (& do read the paper 4 details) what we have is used the best available data 7/n
It turns out, that this means relying v. heavily on data from @Vestas that really should be complemented for their transparency in life-cycle analysis that gave us materials use and useful financial data form their accounts (although a lot is missing). 8/n
Fortunately, relying on Vestas data isn& #39;t such an achilles heel, as remember tweet 2 shows Vestas price follows broadly other turbine price indicators.
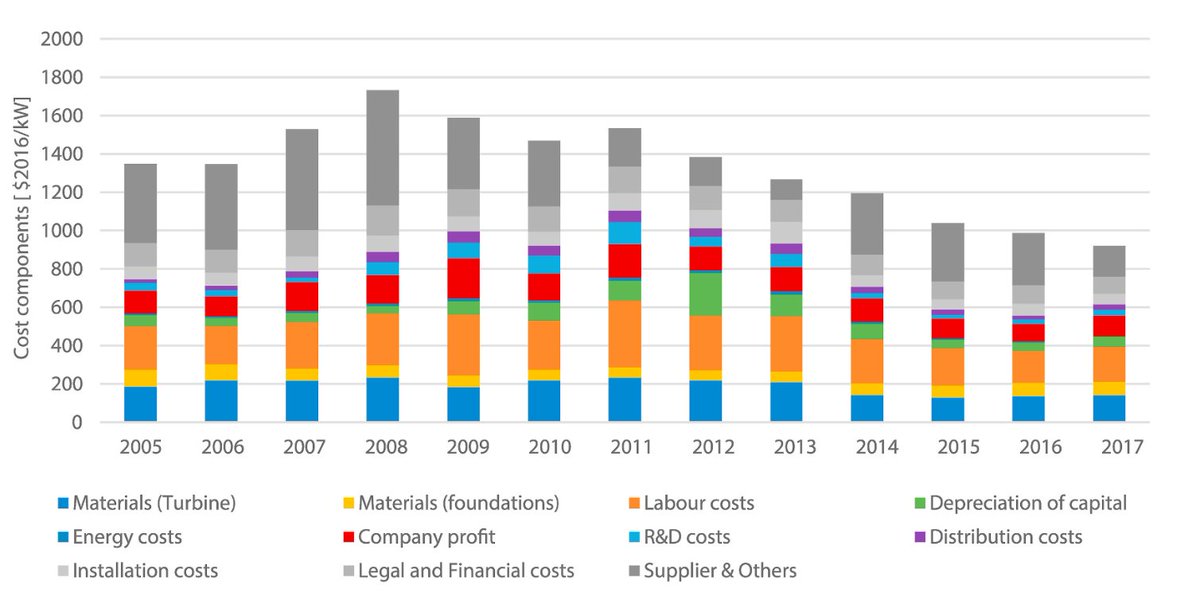
So skipping a big chunk of the paper, we get to this point below where we have our best understanding of WTP components 9/n
So skipping a big chunk of the paper, we get to this point below where we have our best understanding of WTP components 9/n
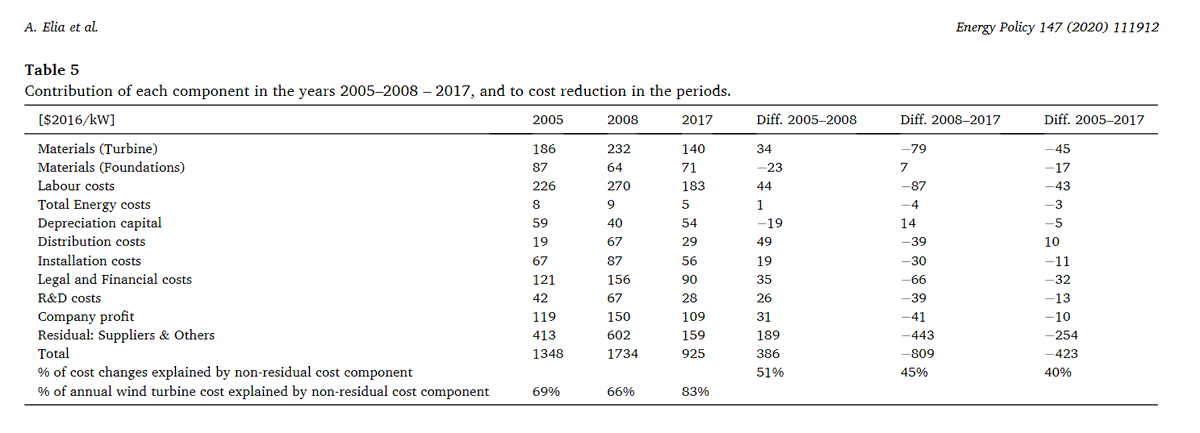
Lots of caveats, problems with data, etc. But we get to a point where we can start to decompose WTP reductions over the different time periods where different market and technology dynamics were in play. 10/n
Big issue is that "suppliers & other category" for 2 reasons. 1st flcutuating coy profits means we normalised at fixed return on assets, probably shifting some "margins" into & #39;other& #39;. 2nd, there is quite a lot of the overall costs in the & #39;suppliers& #39; with little transparency 11/n
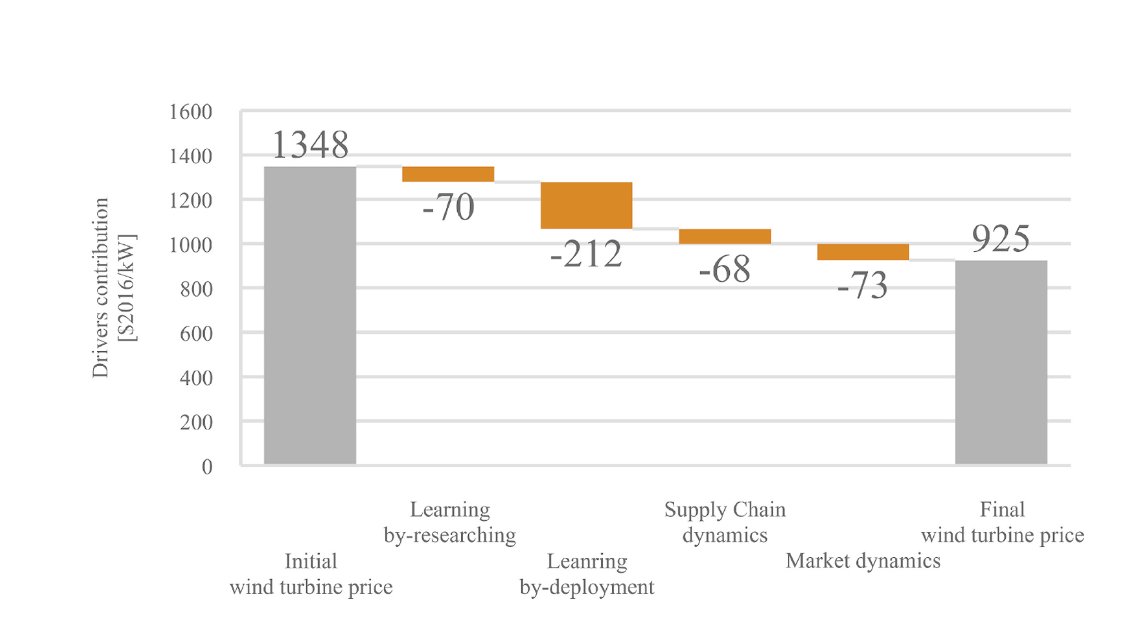
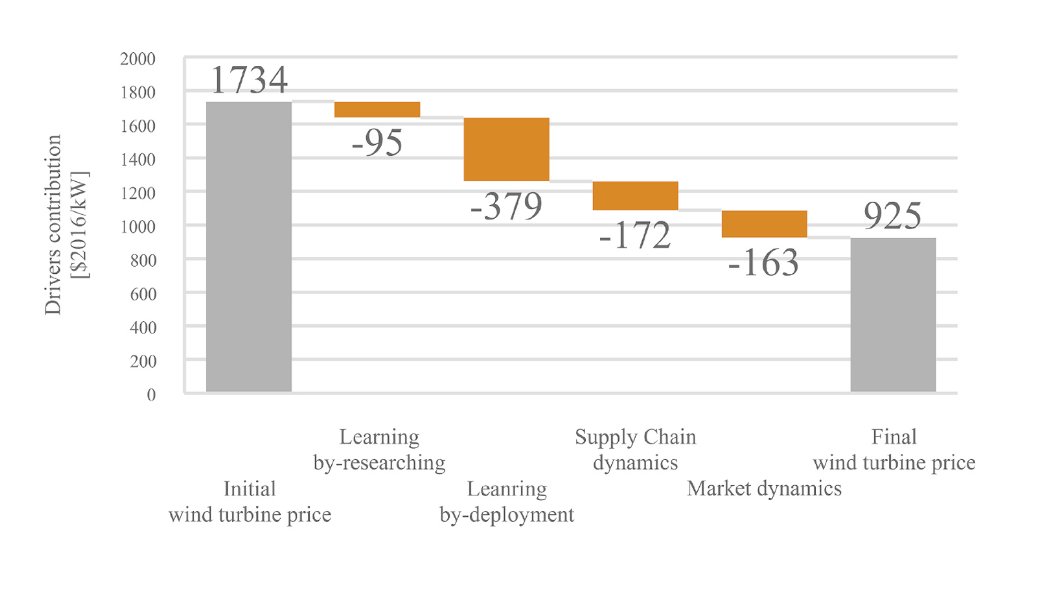
But lets cut to the results: by allocating cost drivers to different learning dynamics, we can see that 2008-17 learning by deployment was largest contributor to price reductions, with similar contributions from the 3 other categories 12/n

 Read on Twitter
