Please see the thread that follows for a description of key #cincinnati #covid19 data we post weekdays on the @UC_CCTST site. These data highlight a concerning picture, we must all do our part to control this pandemic. @CincyChildrens @hcollaborative https://www.cctst.org/covid19 ">https://www.cctst.org/covid19&q...
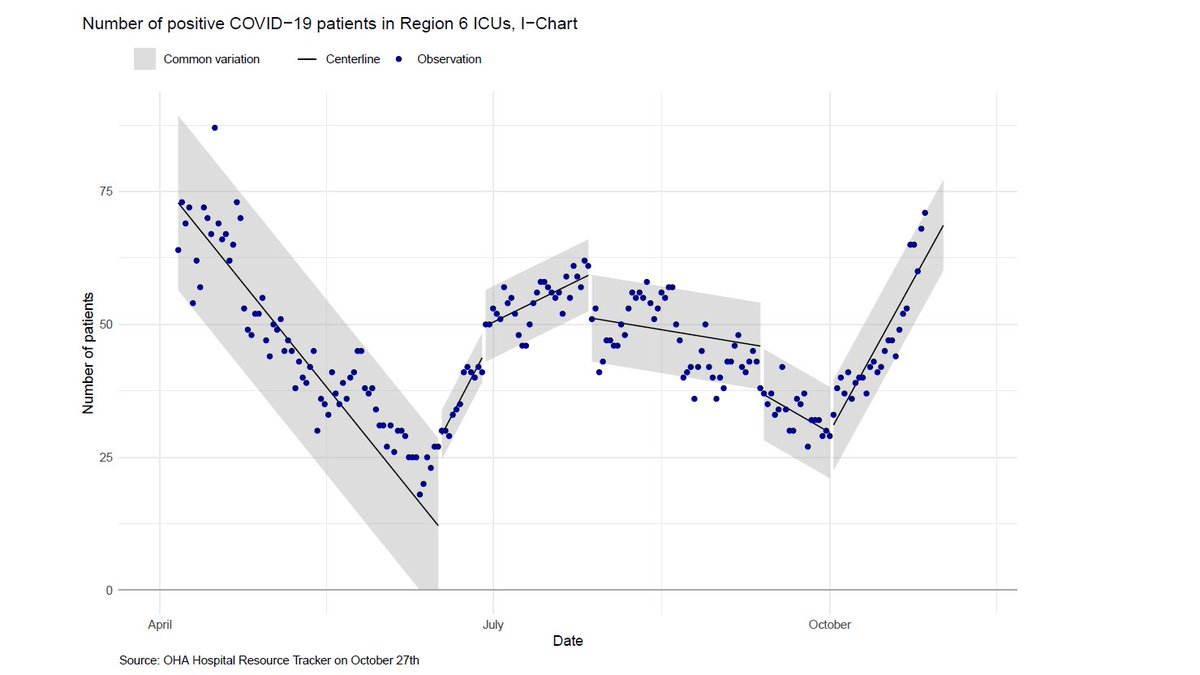
Chart 1 - this shows the number of #covid19 positive patients in ICU beds over time. Note the steep rise over the last several weeks corresponding with the surge we& #39;ve been seeing. People are positive. People are sick.
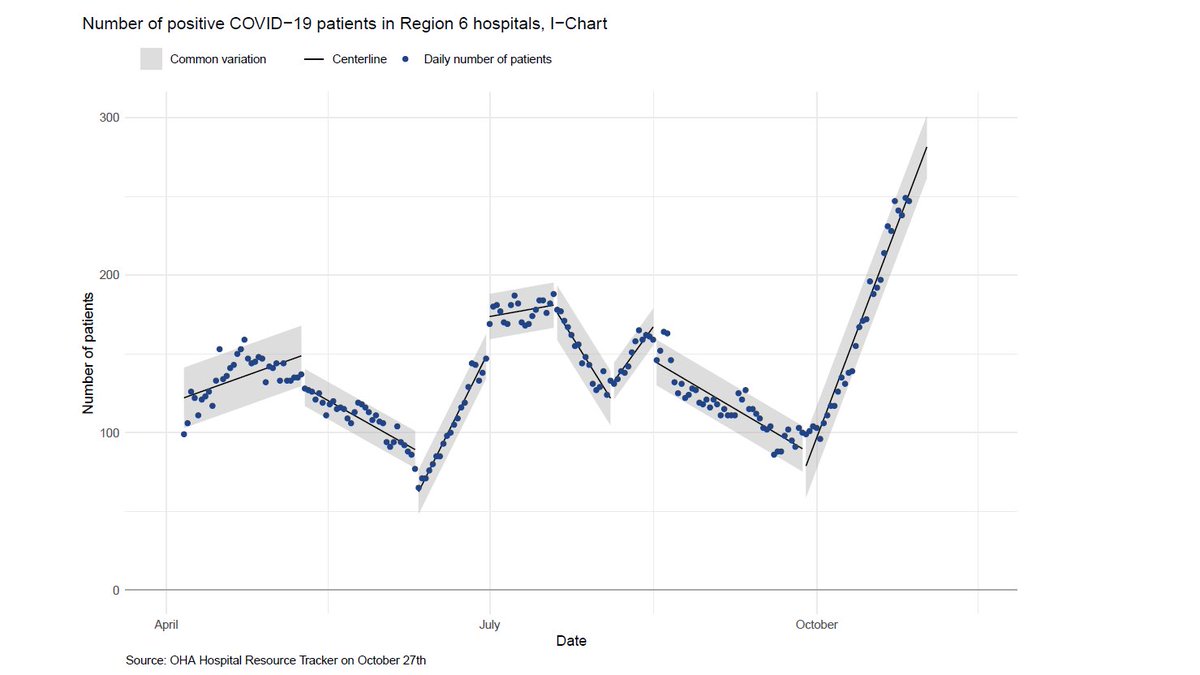
Chart 2 - similar to the ICU chart, there is a steep rise in #covid19 patients in general hospital beds, too. This is now at record numbers for the pandemic.
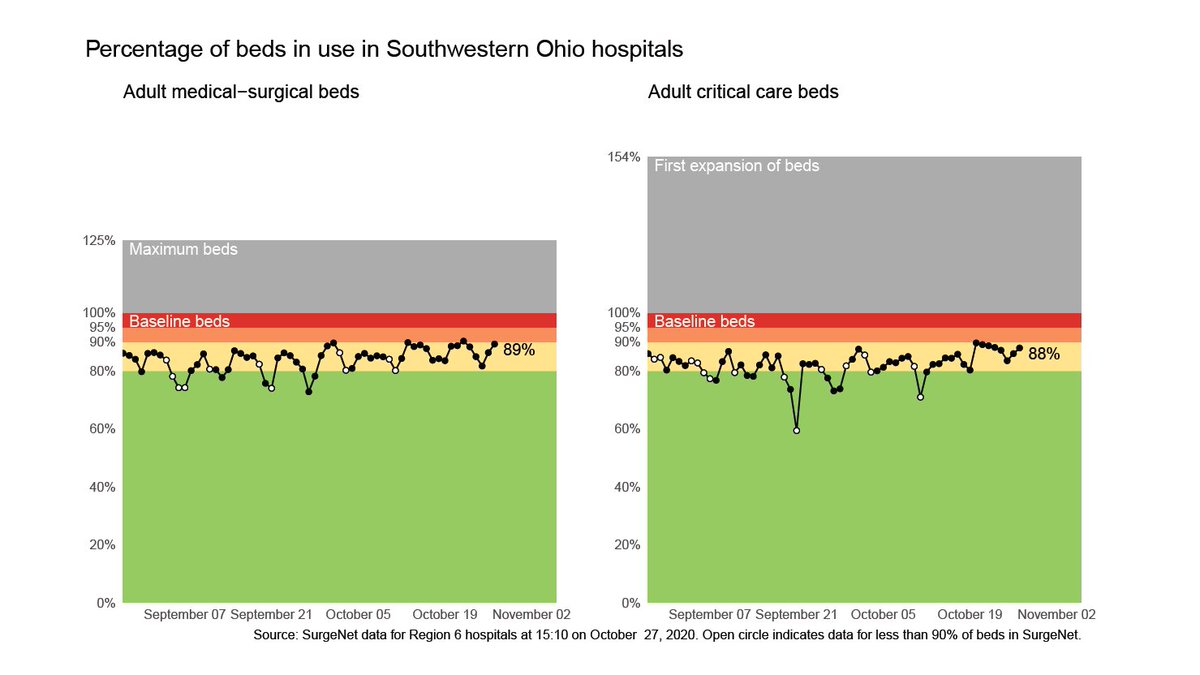
Chart 3 - This looks at occupancy in our regional hospitals. Over the last several days, 85-95% of hospital and ICU beds are filled. This is ok but we do not want to get much higher. We need beds available for those with #Covid19 as well as other illnesses.
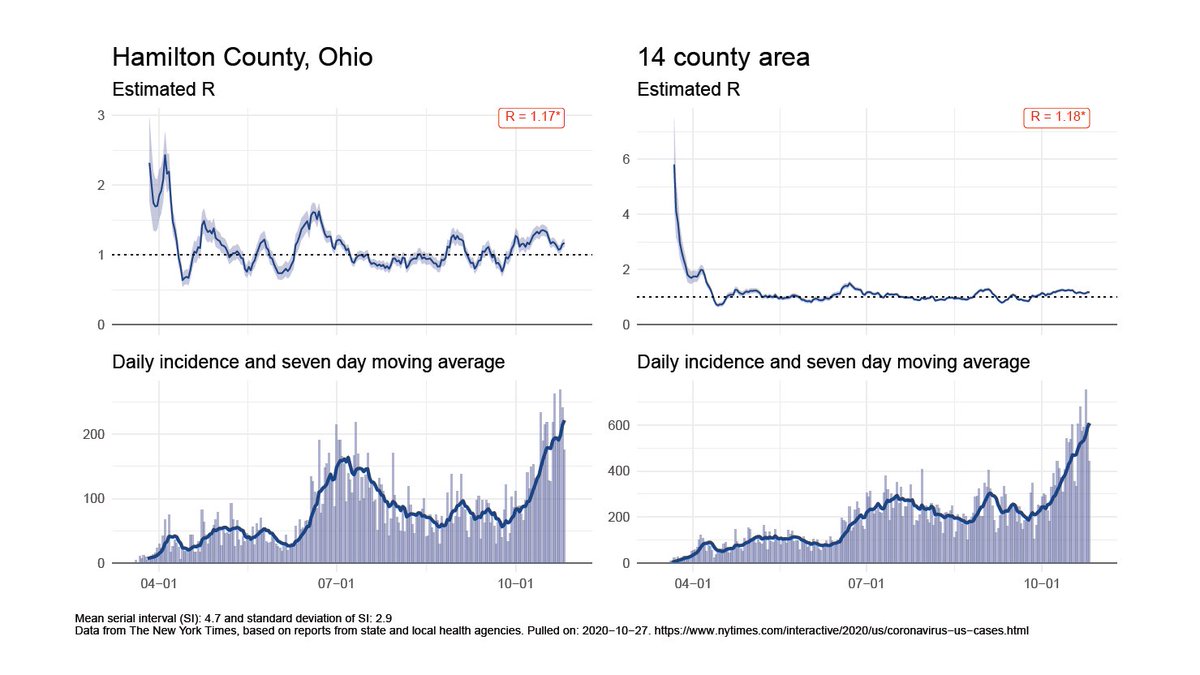
Chart 4 - This is R for Hamilton Cty and the region. R is the number 1 person infects before their course ends. We need R<1 for the pandemic to decay. Otherwise, it grows. We& #39;ve been >1 for nearly a month in #cincinnati, #ohio, and many parts of US. We are not rounding corner.
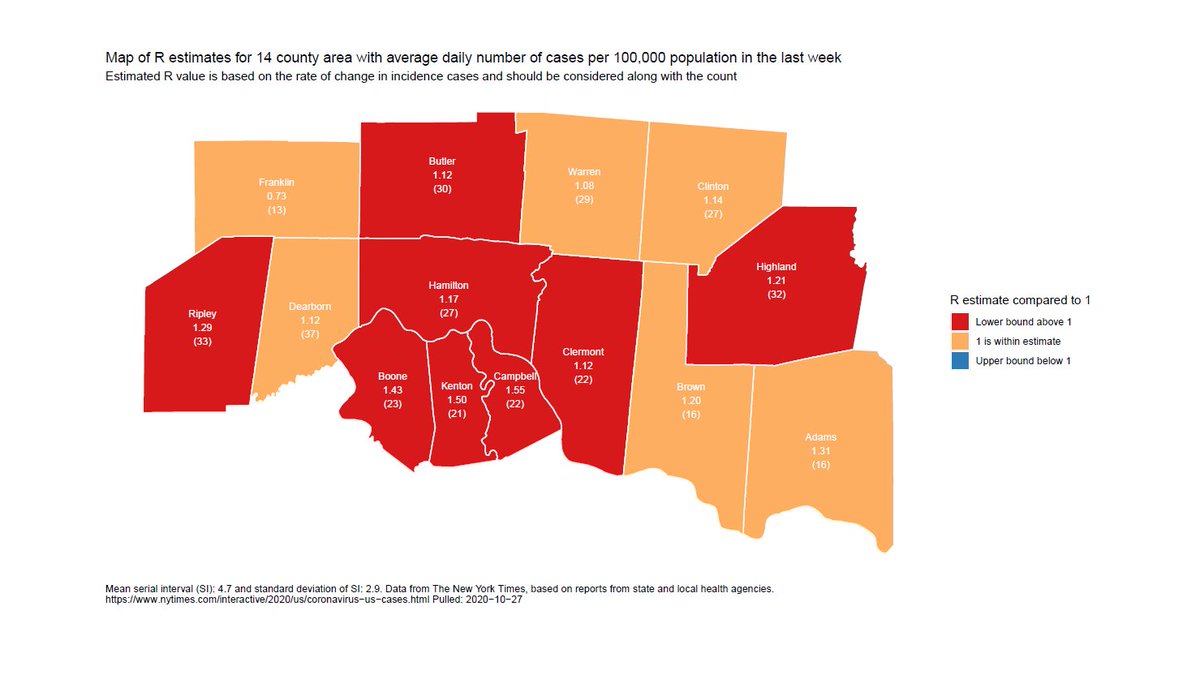
Chart 5 - this is map of R for our regional counties. Red counties are where R>1; yellow are where the estimate includes 1. Lots of red.
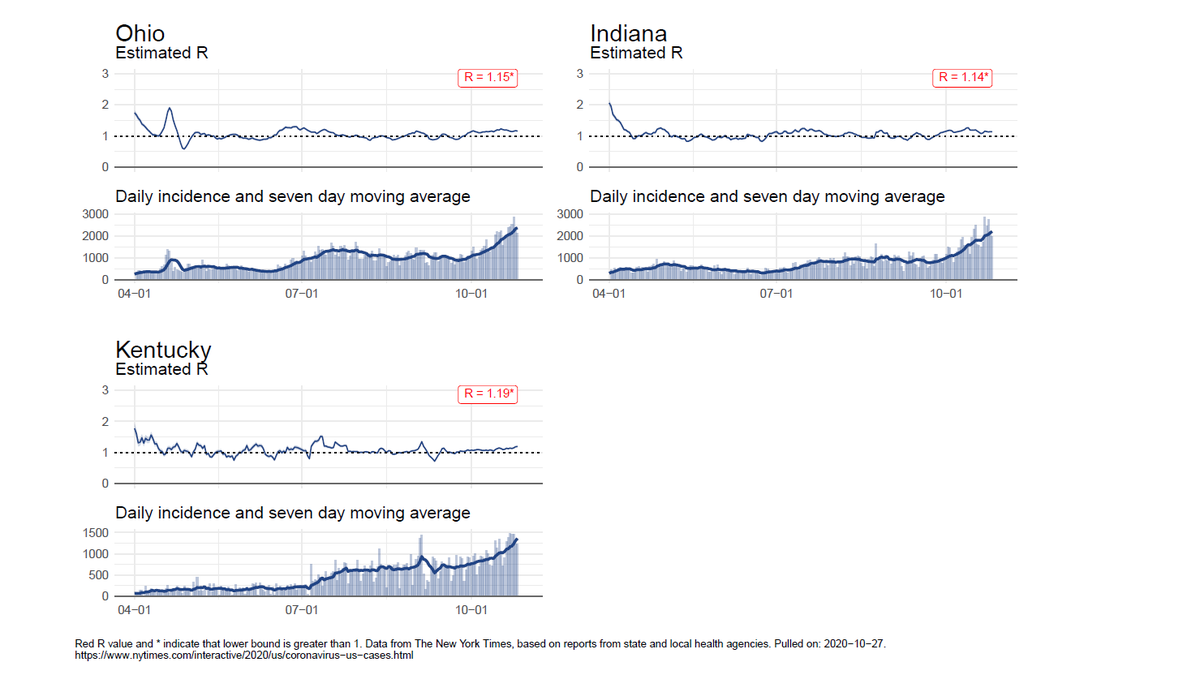
Chart 6 - state data for #Ohio, #indiana, and #kentucky. R >1 in each one indicative of active transmission.
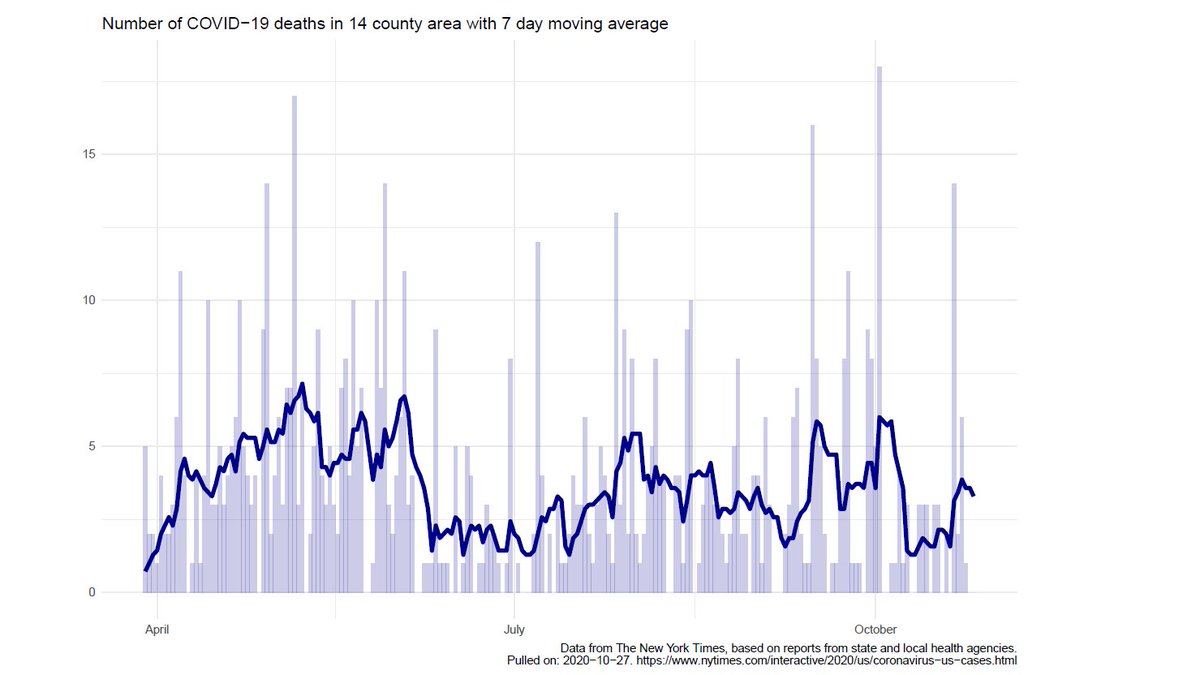
Chart 7 - Average daily deaths from #covid19 for our region. Variability day to day but still 3-5 deaths per day locally. Death is also a lagging indicator. This is likely to rise in the coming days-weeks.
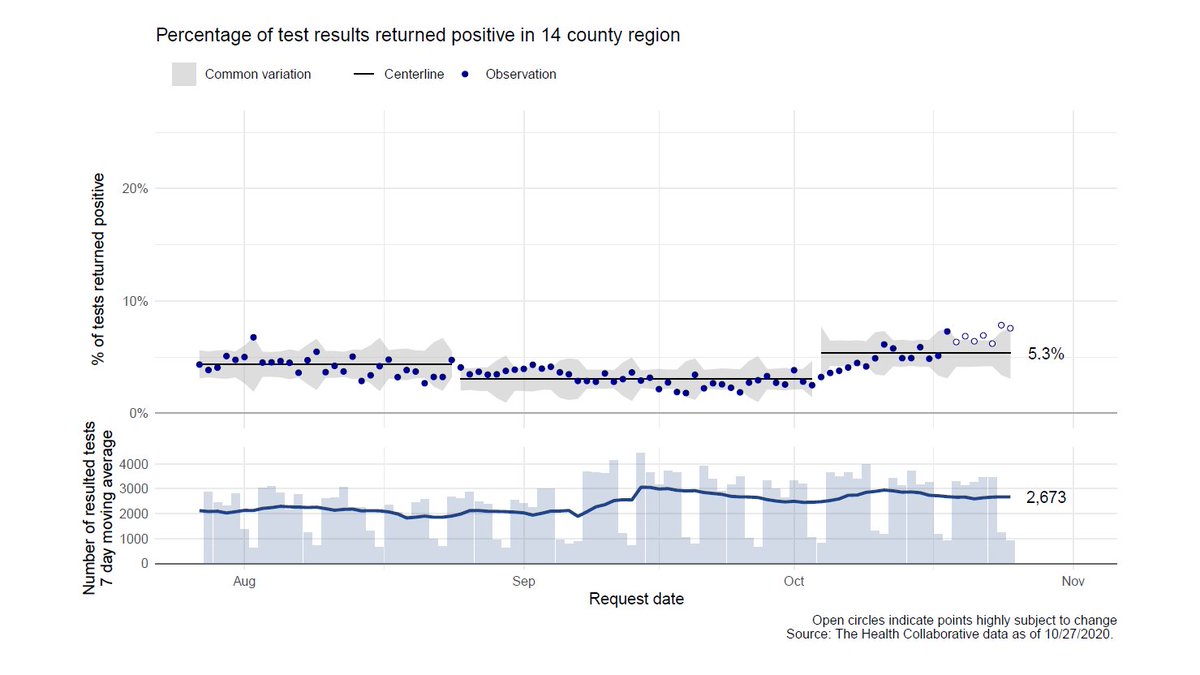
Chart 8 - Testing and % positive tests for our region. Top is % positive. We are now >5% at a level that is rising. We are testing more than we were earlier on but we can test still more. We are also seeing a higher % positive.
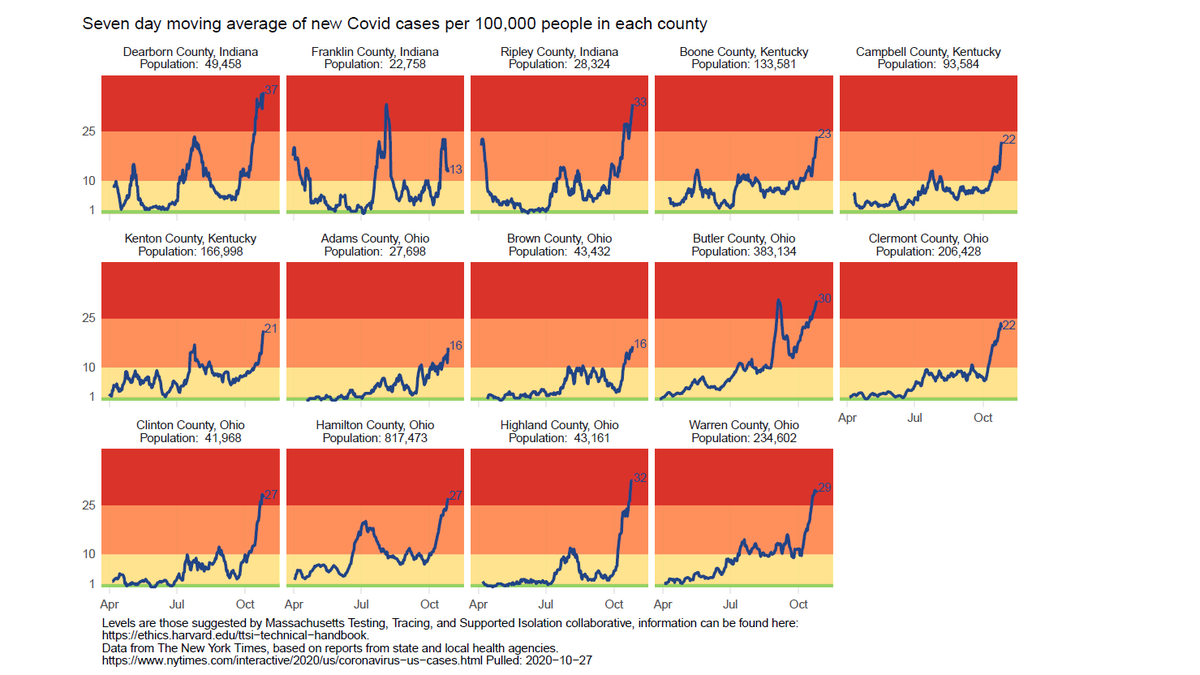
Chart 9 - Daily new cases by county measured per 100,000 people. Common elements across the 14 counties - steep rise putting us in concerning territory. Hamilton County& #39;s incidence is now 27 (for reference, Cleveland and Pittsburgh both ~10; Rochester ~6). We must do better!!
Last one in thread, if you& #39;ve made it this far. The numbers are alarming. We must remain vigilant, #WearAMaskPlease, avoid crowds, adhere to distancing guidelines, #WashYourHands  https://abs.twimg.com/hashflags... draggable="false" alt="">, cooperate with contact tracers, and get a #FluShot. The immediate next days and weeks are critical.

 Read on Twitter