I just dug into the @QuinnipiacPoll to understand how one highly-rated pollster changed its Likely Voter model from 2016 to 2020 in Pennsylvania.
The results are pretty interesting...
(Caveat: Polling nerds only. This is not a predictive thread, but one focused on methodology.)
The results are pretty interesting...
(Caveat: Polling nerds only. This is not a predictive thread, but one focused on methodology.)
Just to recap:
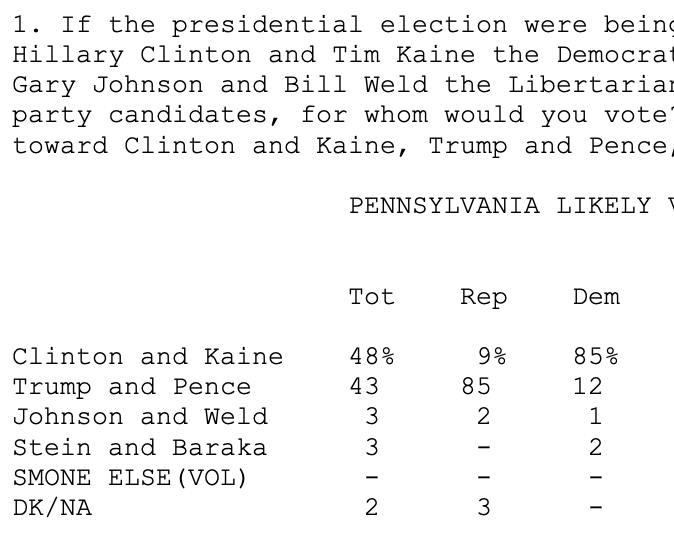
In 2016, QU had Clinton up by 5 in PA in their last poll (ending 7 days before election day).
https://poll.qu.edu/pennsylvania/release-detail?ReleaseID=2399
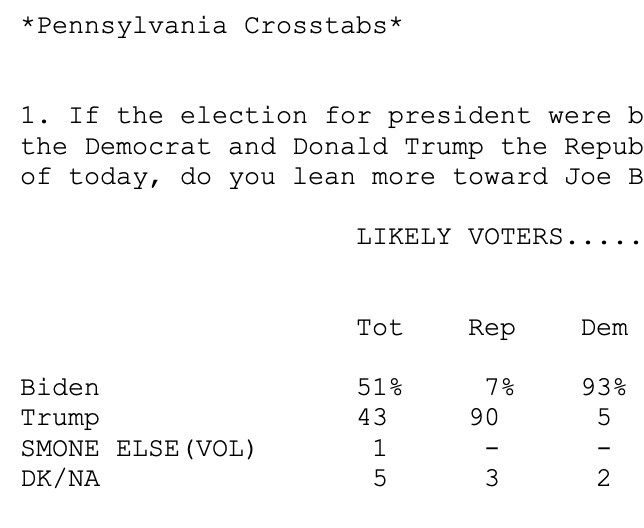
In">https://poll.qu.edu/pennsylva... 2020, QU has Biden up by 8 in PA in their most recent poll (ending 15 days before election day.) https://poll.qu.edu/pennsylvania/release-detail?ReleaseID=3680">https://poll.qu.edu/pennsylva...
Now onto the weighting...
In 2016, QU& #39;s LV model estimated that Whites with a college degree would comprise 39% of the final vote, a group Clinton led by 9pts.
Whites without a college degree would make up 42% of the final vote, a group Trump led by 19pts.
In 2016, QU& #39;s LV model estimated that Whites with a college degree would comprise 39% of the final vote, a group Clinton led by 9pts.
Whites without a college degree would make up 42% of the final vote, a group Trump led by 19pts.
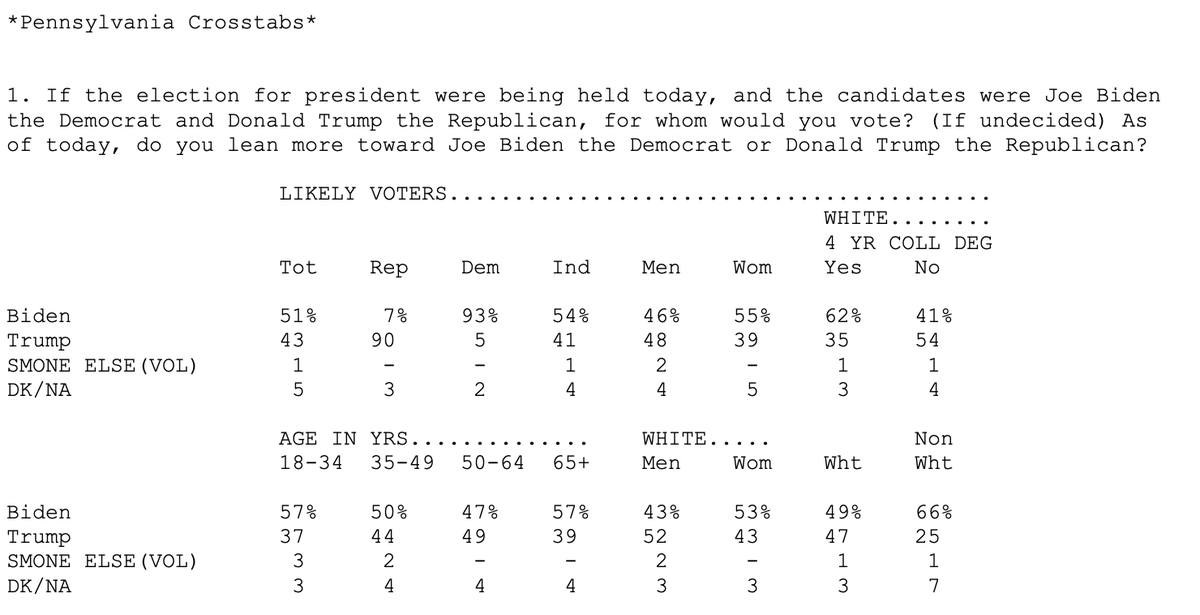
This year QU is not releasing the weights for these groups directly, but we can still estimate them from the cross tabs.
Sparing you the math...
Sparing you the math...
In 2020, QU& #39;s LV model estimates that Whites with a college degree will comprise 32% of the final vote (-7 vs & #39;16), a group Biden leads by 27pts (+18 vs & #39;16).
Whites without a college degree would make up 53% of the final vote (+11 vs & #39;16), a group Biden leads by 2pts (+21).
Whites without a college degree would make up 53% of the final vote (+11 vs & #39;16), a group Biden leads by 2pts (+21).
So, after a significant miss in 2016, QU made a major revision in their weighting by increasing the share of Whites without a college degree by 21 (!) percentage points.
It is notable that Biden still leads by a wide margin even with that unfavorable change in LV weighting in PA
It is notable that Biden still leads by a wide margin even with that unfavorable change in LV weighting in PA
Finally, I will note that this is just one poll. By all means, please consult a high quality polling average like the one at @FiveThirtyEight for a good picture of what& #39;s going on in PA.
This thread was just an exploration of how LV weighting models have changed since & #39;16.
This thread was just an exploration of how LV weighting models have changed since & #39;16.

 Read on Twitter


