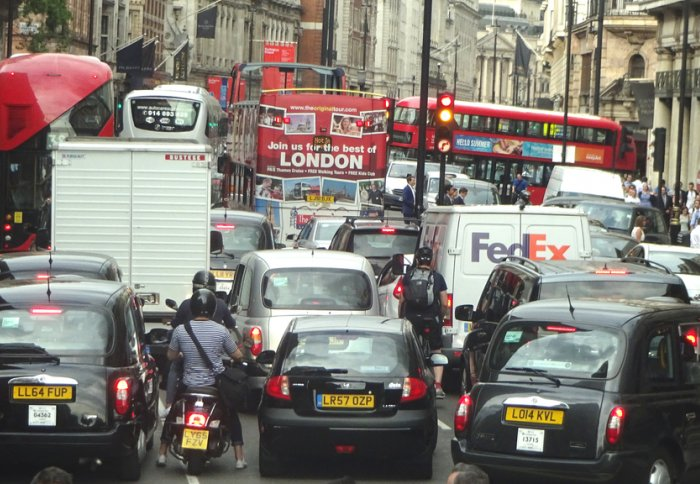
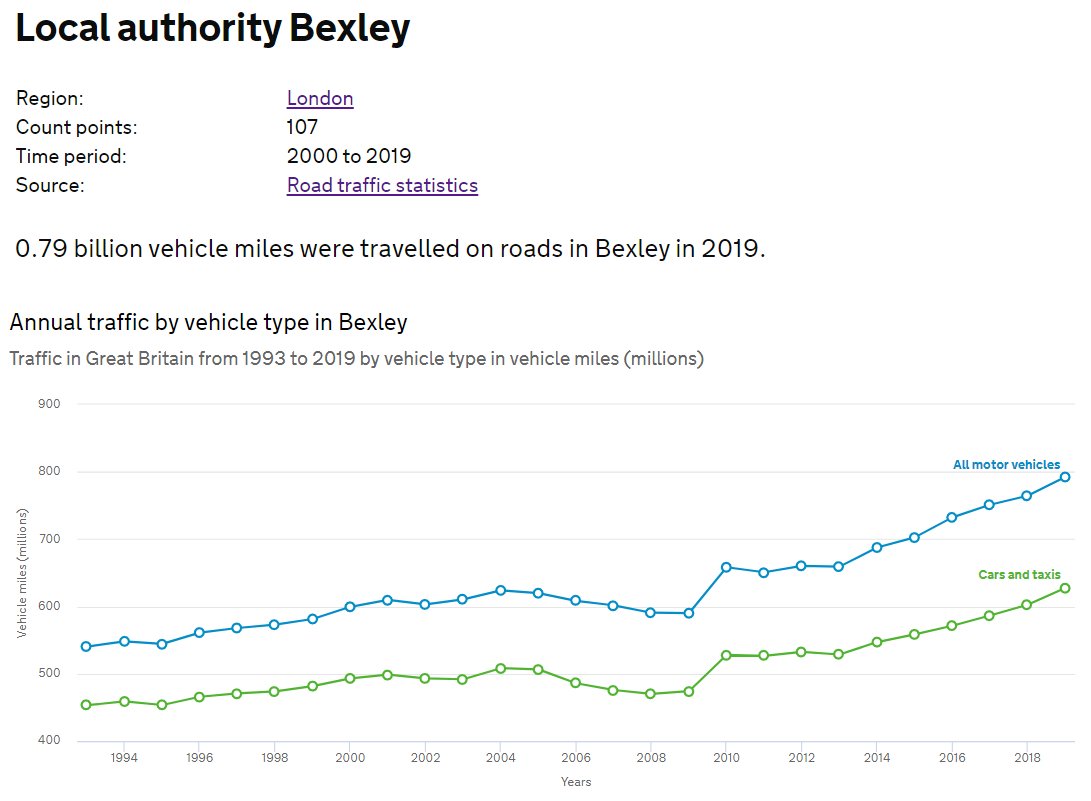
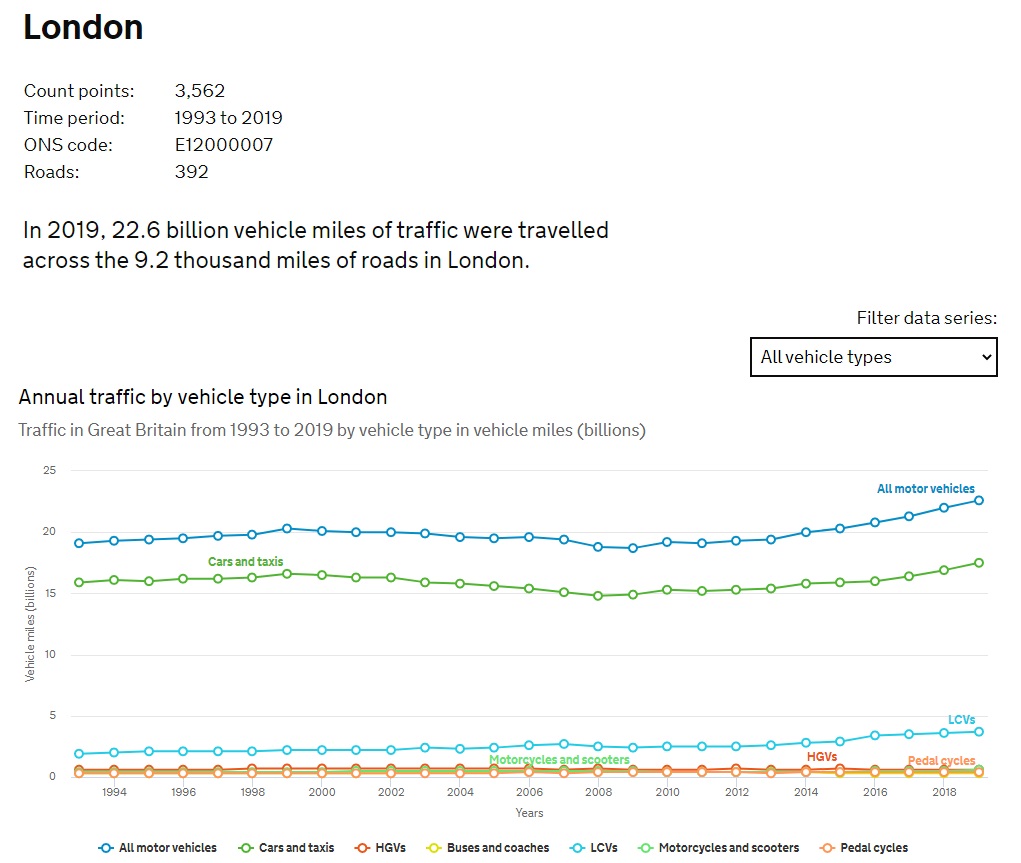
1/ You& #39;ll have recently come across claims that & #39; #LowTrafficNeighbourhoods cause congestion& #39;, so I thought it might be useful to show that the real cause of traffic jams on London& #39;s roads is the vast increase in the number of car journeys in recent years, in almost every borough.
2/ So, let& #39;s get started
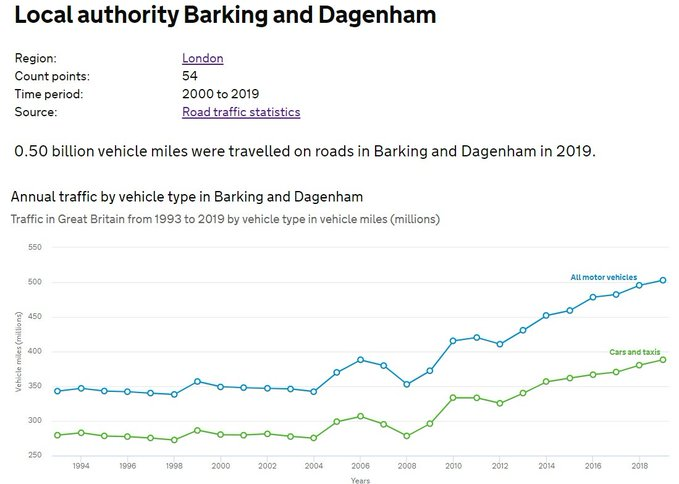
Between 2008 and 2019, the number of miles driven on Barking and Dagenham& #39;s roads increased by 150,000,000.
One hundred and fifty million miles.
Between 2008 and 2019, the number of miles driven on Barking and Dagenham& #39;s roads increased by 150,000,000.
One hundred and fifty million miles.
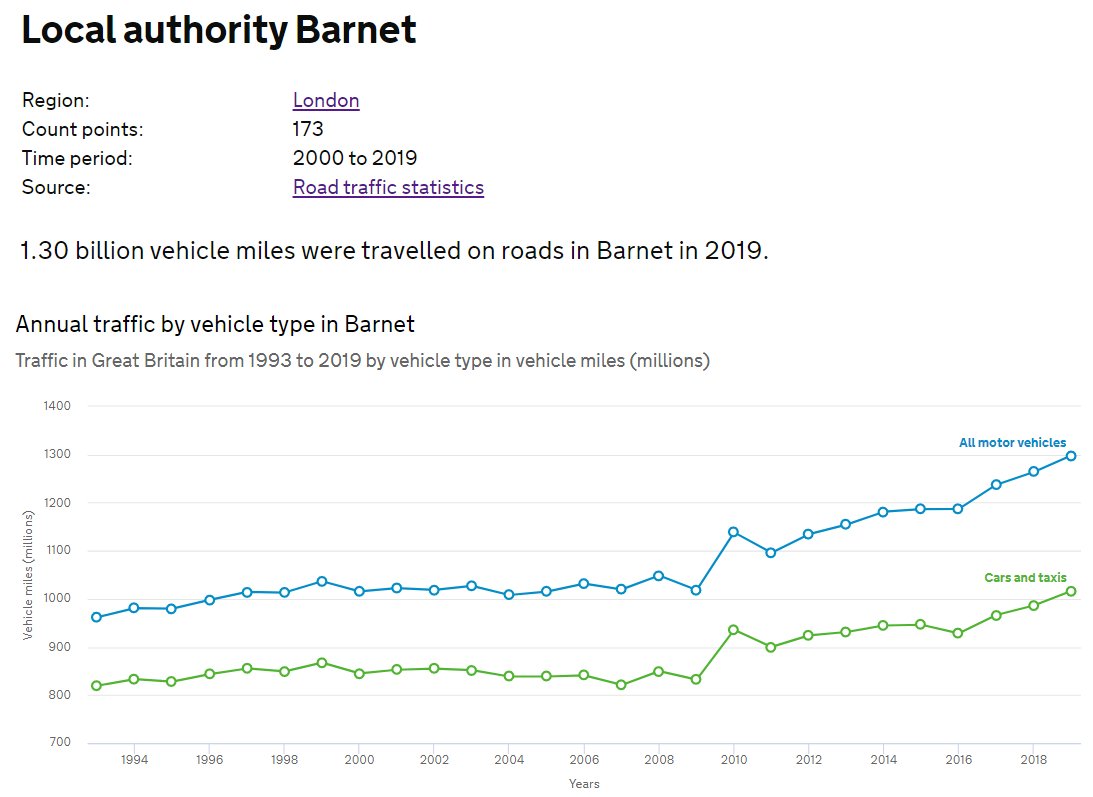
3/ Between 2009 and 2019, the number of miles driven on Barnet& #39;s roads increased by 280,000,000.
Two hundred and eighty million miles.
Two hundred and eighty million miles.
4/ Between 2009 and 2019, the number of miles driven on Barnet& #39;s roads increased by 202,000,000.
Two hundred and two million miles.
Two hundred and two million miles.
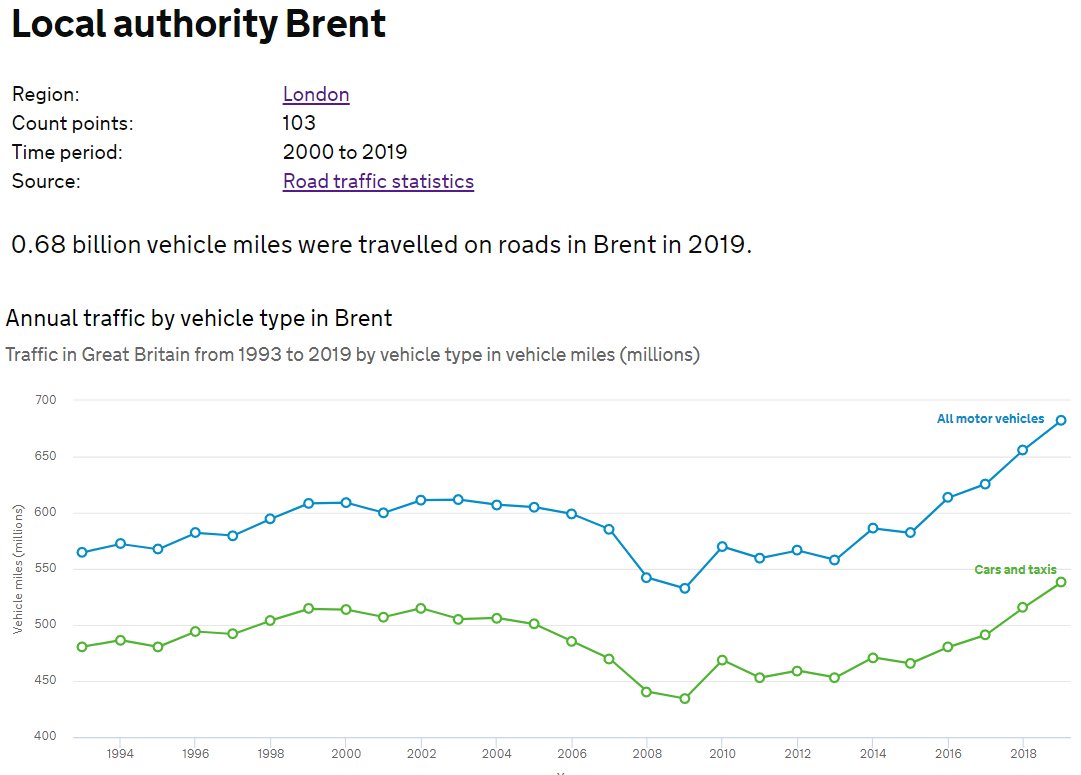
5/ Between 2009 and 2019, the number of miles driven on Brent& #39;s roads increased by 150,000,000.
One hundred and fifty million miles.
One hundred and fifty million miles.
6/ Between 2009 and 2019, the number of miles driven on Bromley& #39;s roads increased by 198,000,000.
One hundred and ninety-eight million miles.
One hundred and ninety-eight million miles.
7/ Between 2012 and 2019, the number of miles driven on Camden& #39;s roads increased by 15,000,000.
Fifteen million miles.
Fifteen million miles.
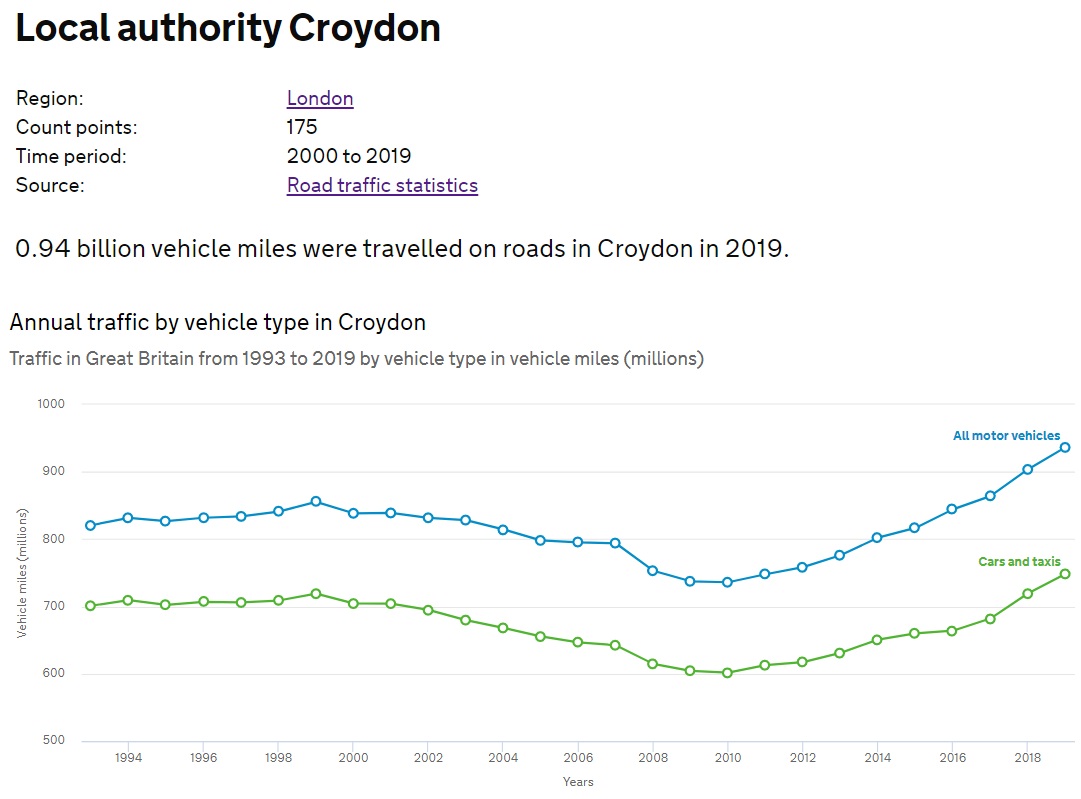
8/ Between 2010 and 2019, the number of miles driven on Croydon& #39;s roads increased by 200,000,000.
Two hundred million miles.
Two hundred million miles.
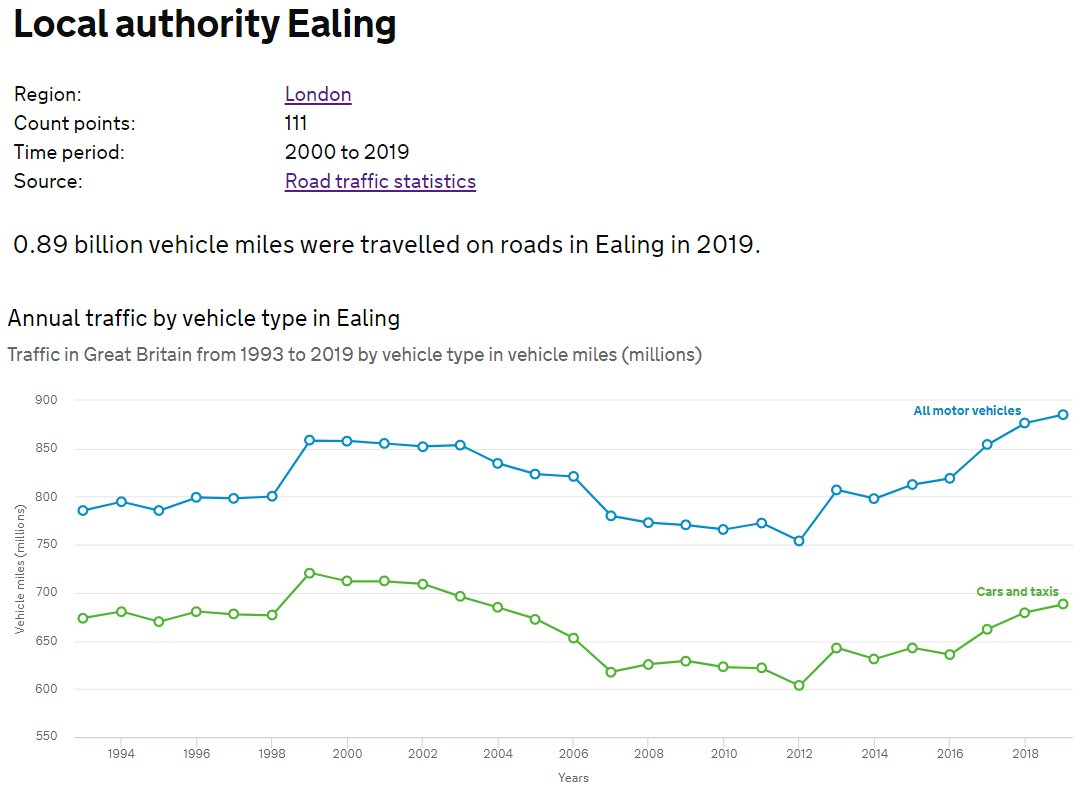
9/ Between 2012 and 2019, the number of miles driven on Ealing& #39;s roads increased by 130,000,000.
One hundred and thirty million miles.
One hundred and thirty million miles.
10/ Between 2008 and 2019, the number of miles driven on Enfield& #39;s roads increased by 313,000,000.
Three hundred and thirteen million miles.
Three hundred and thirteen million miles.
11/ Between 2009 and 2019, the number of miles driven on Greenwich& #39;s roads increased by 130,000,000.
One hundred and thirty million miles.
One hundred and thirty million miles.
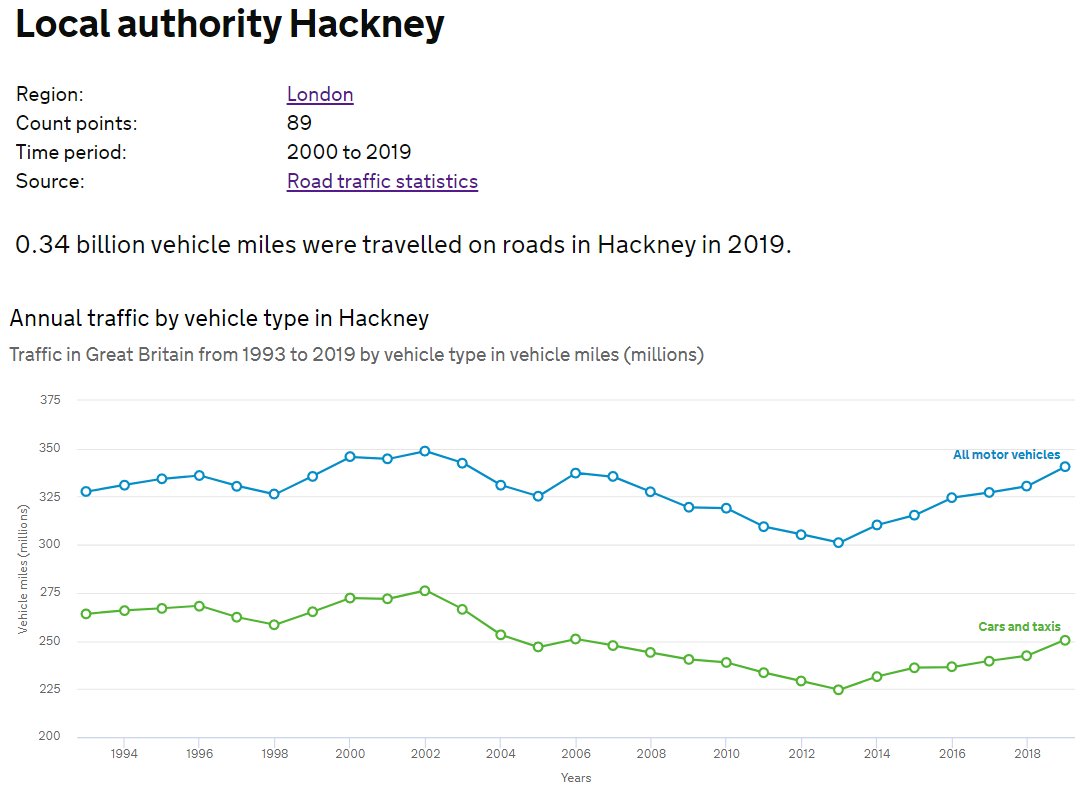
12/ Between 2013 and 2019, the number of miles driven on Hackney& #39;s roads increased by 40,000,000.
Forty million miles.
Forty million miles.
13/ Between 2012 and 2019, the number of miles driven on Hammersmith and Fulham& #39;s roads increased by 26,000,000.
Twenty-six million miles.
Twenty-six million miles.
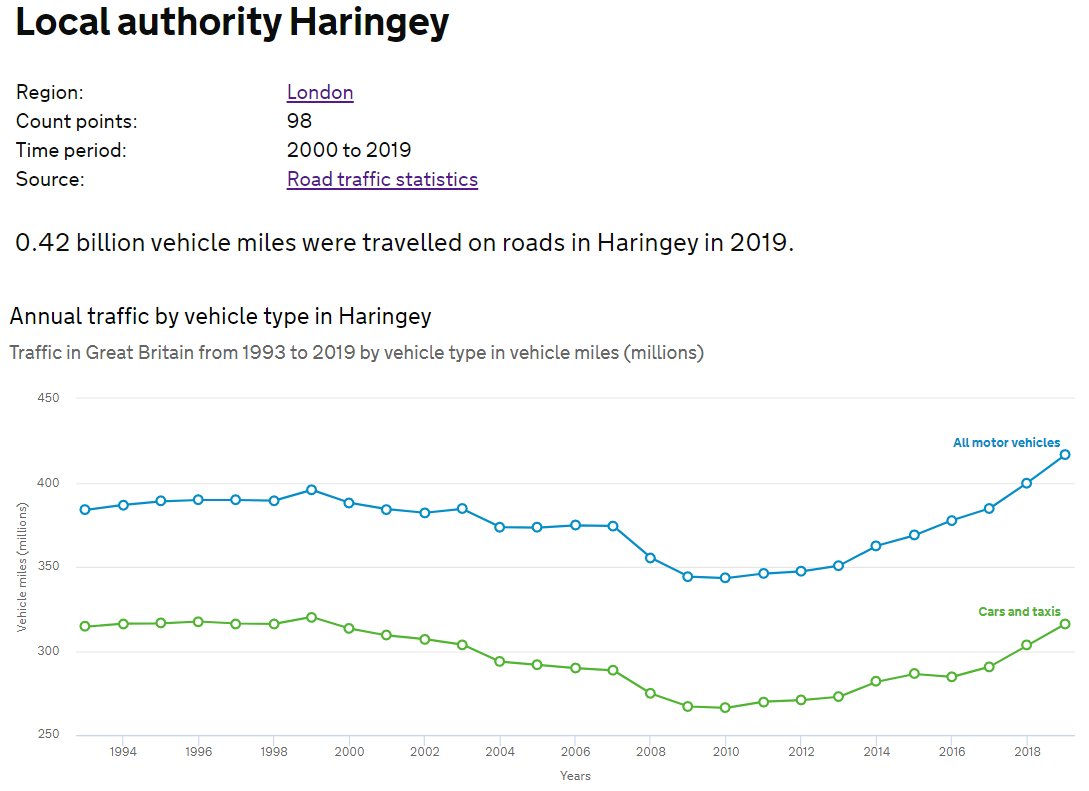
14/ Between 2010 and 2019, the number of miles driven on Haringey& #39;s roads increased by 73,000,000.
Seventy-three million miles.
Seventy-three million miles.
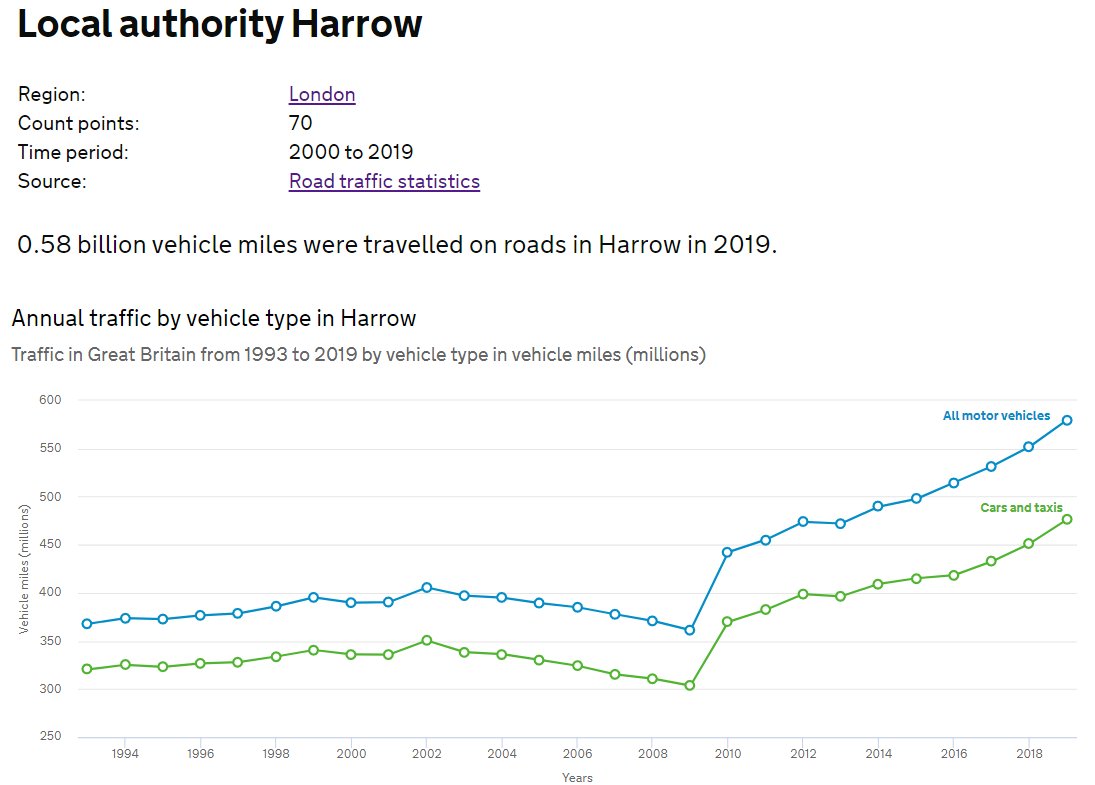
15/ Between 2009 and 2019, the number of miles driven on Harrow& #39;s roads increased by 219,000,000.
Two hundred and nineteen million miles.
Two hundred and nineteen million miles.
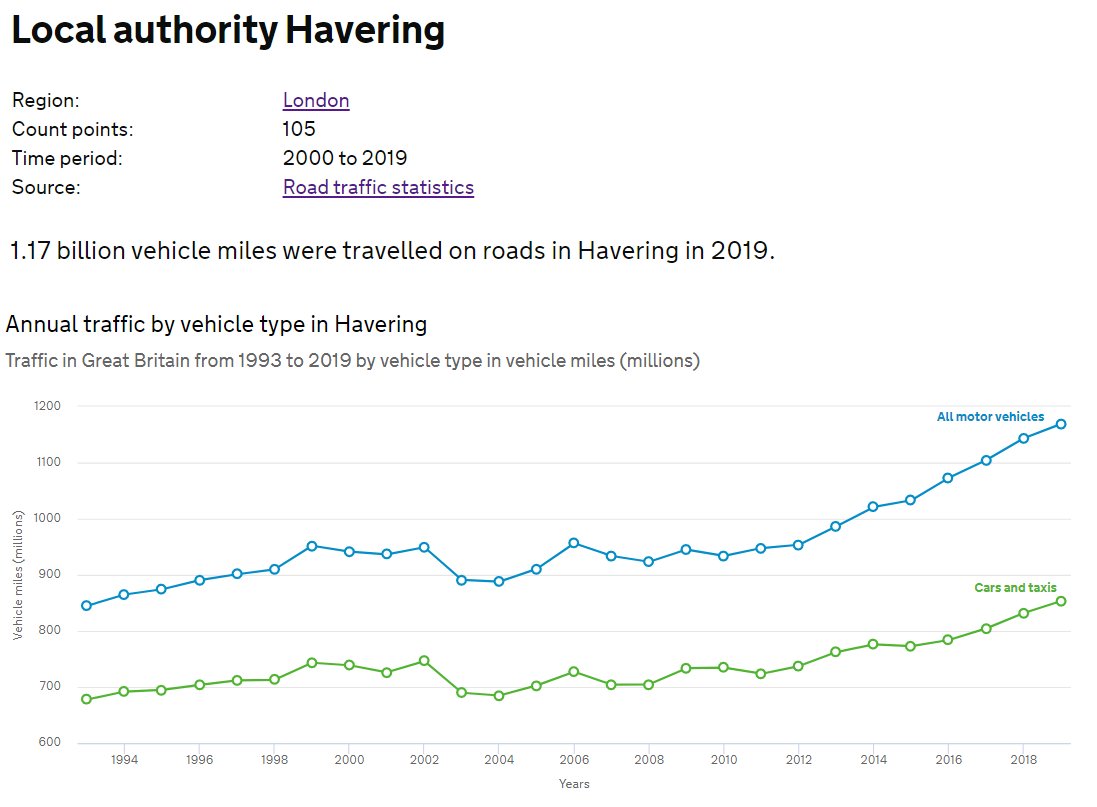
16/ Between 2008 and 2019, the number of miles driven on Havering& #39;s roads increased by 246,000,000.
Two hundred and forty-six million miles.
Two hundred and forty-six million miles.
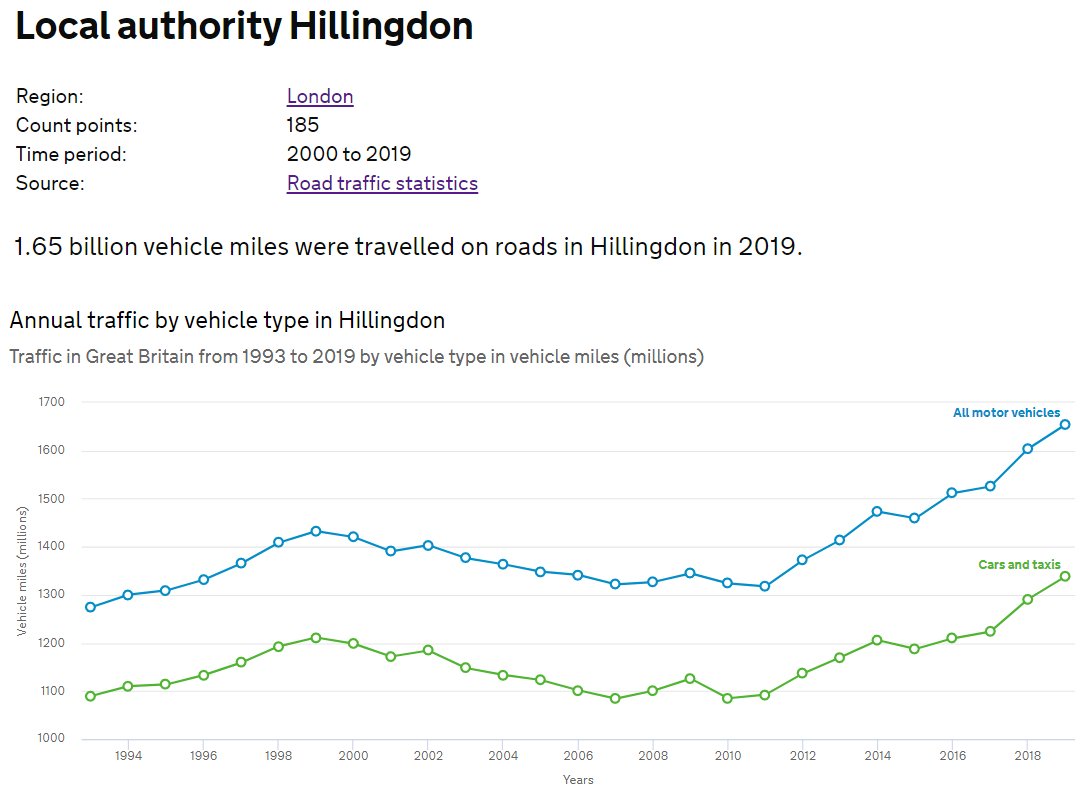
17/ Between 2011 and 2019, the number of miles driven on Hillingdon& #39;s roads increased by 336,000,000.
Three hundred and thirty-six million miles.
Three hundred and thirty-six million miles.
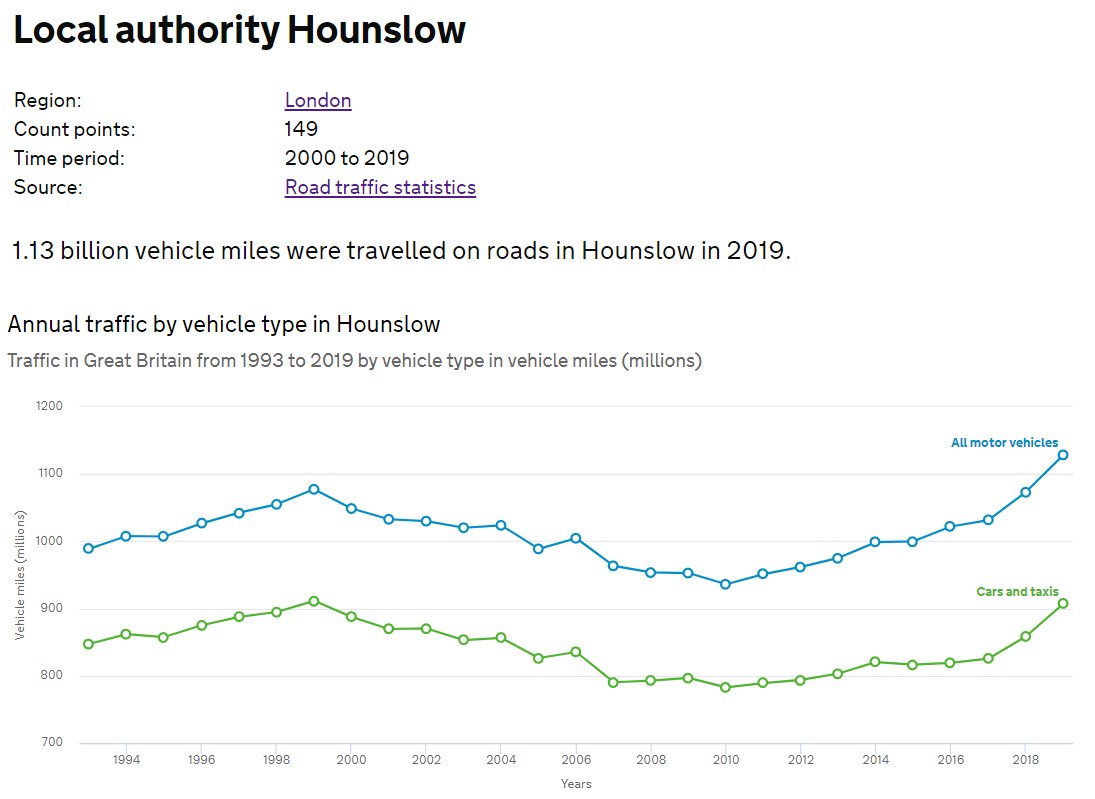
18/ Between 2010 and 2019, the number of miles driven on Hounslow& #39;s roads increased by 192,000,000.
One hundred and ninety-two million miles.
One hundred and ninety-two million miles.
19/ Between 2013 and 2019, the number of miles driven on Islington& #39;s roads increased by 24,000,000.
Twenty-four million miles.
Twenty-four million miles.
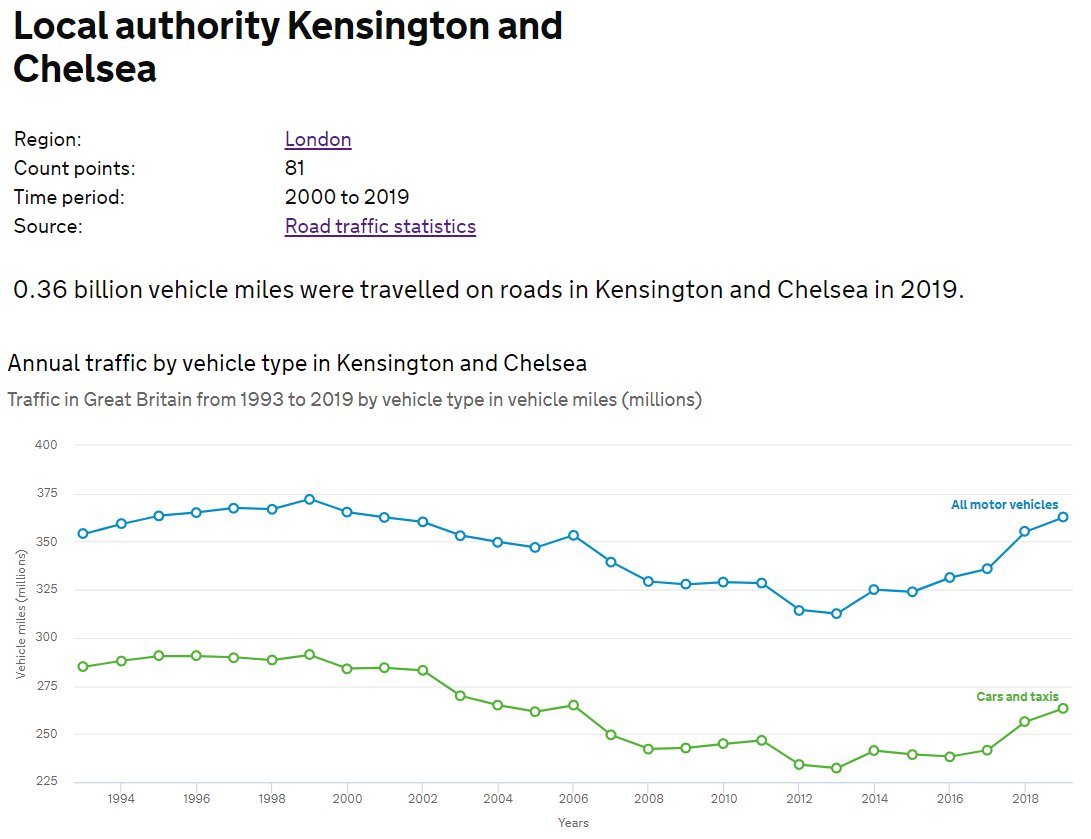
20/ Between 2013 and 2019, the number of miles driven on Kensington and Chelsea& #39;s roads increased by 50,000,000.
Fifty million miles.
Fifty million miles.
21/ Between 2011 and 2019, the number of miles driven on Kingston Upon Thames& #39; roads have increased by 97,000,000.
Ninety-seven million miles.
Ninety-seven million miles.
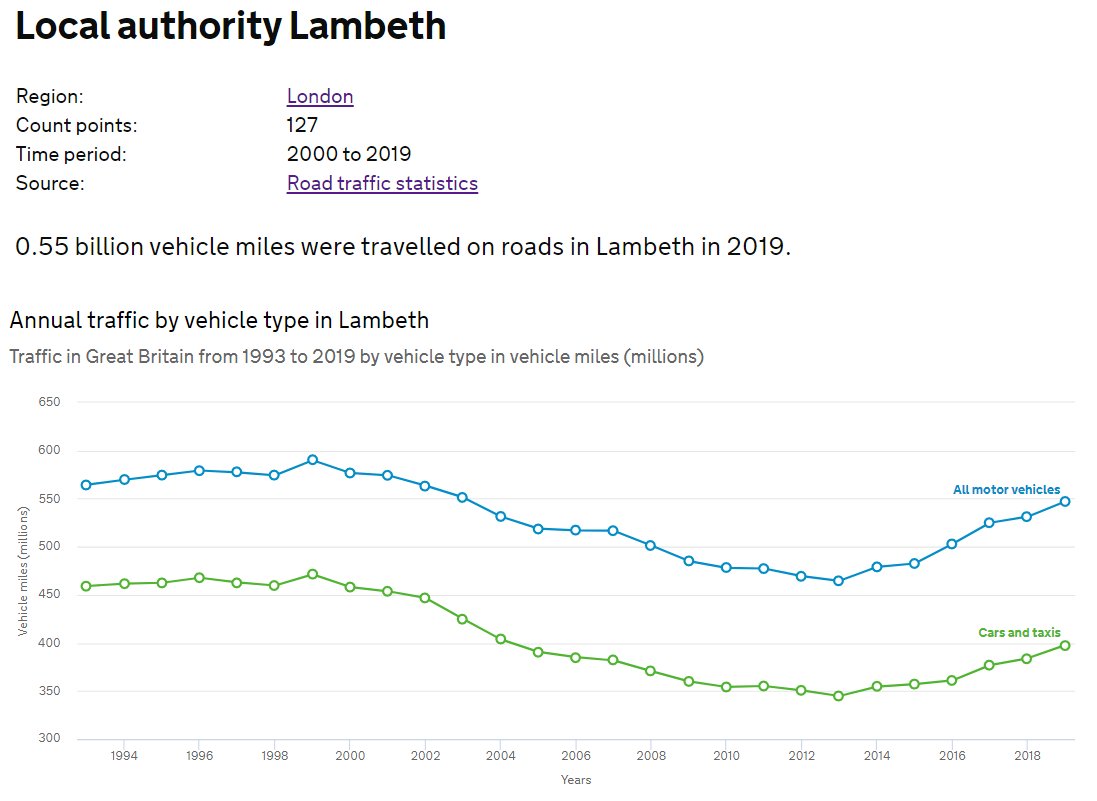
22/ Between 2013 and 2019, the number of miles driven on Lambeth& #39;s roads have increased by 83,000,000.
Eighty-three million miles.
Eighty-three million miles.
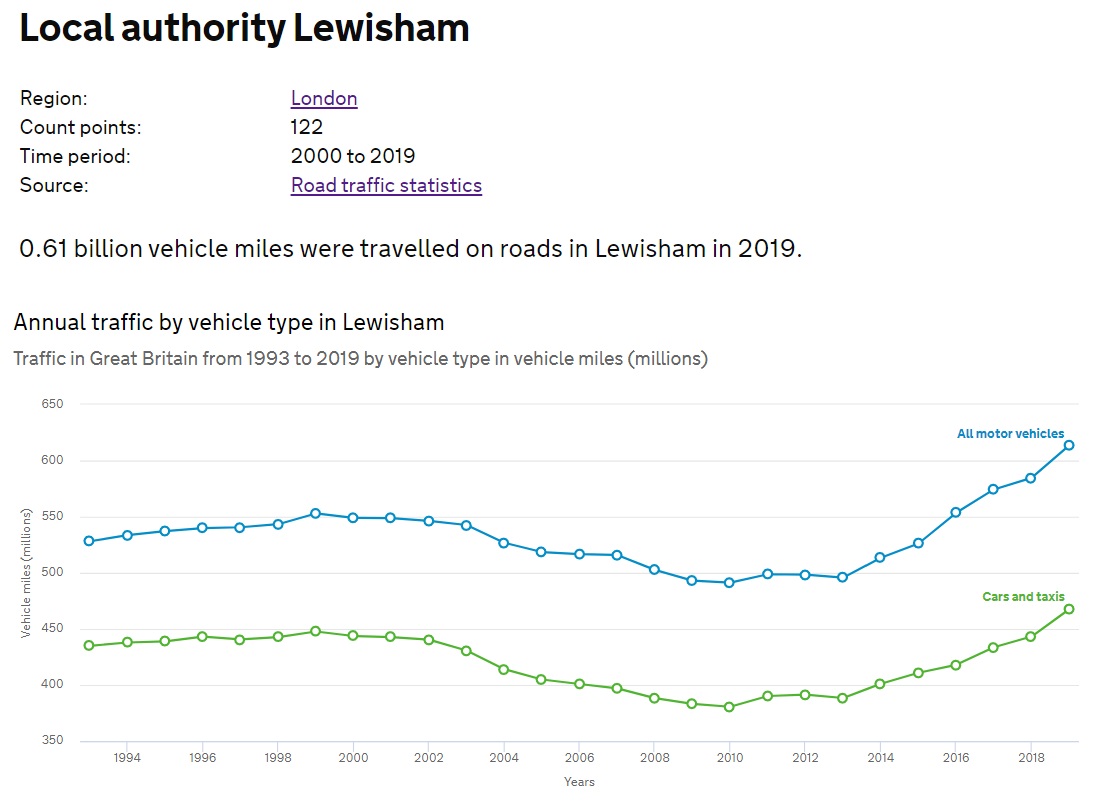
23/ Between 2013 and 2019, the number of miles driven on Lewisham& #39;s roads have increased by 118,000,000.
One hundred and eighteen million miles.
One hundred and eighteen million miles.
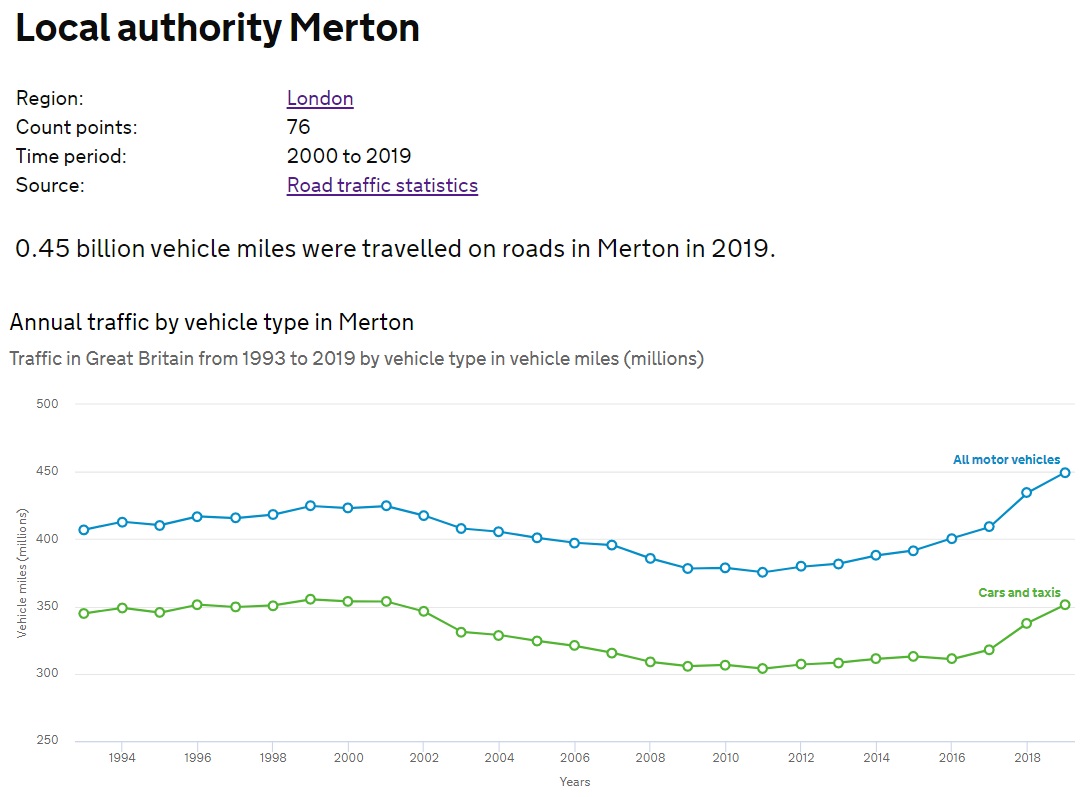
24/ Between 2011 and 2019, the number of miles driven on Merton& #39;s roads have increased by 74,000,000.
Seventy-four million miles.
Seventy-four million miles.
25/ Between 2013 and 2019, the number of miles driven on Newham& #39;s roads have increased by 127,000,000.
One hundred and twenty-seven million miles.
One hundred and twenty-seven million miles.
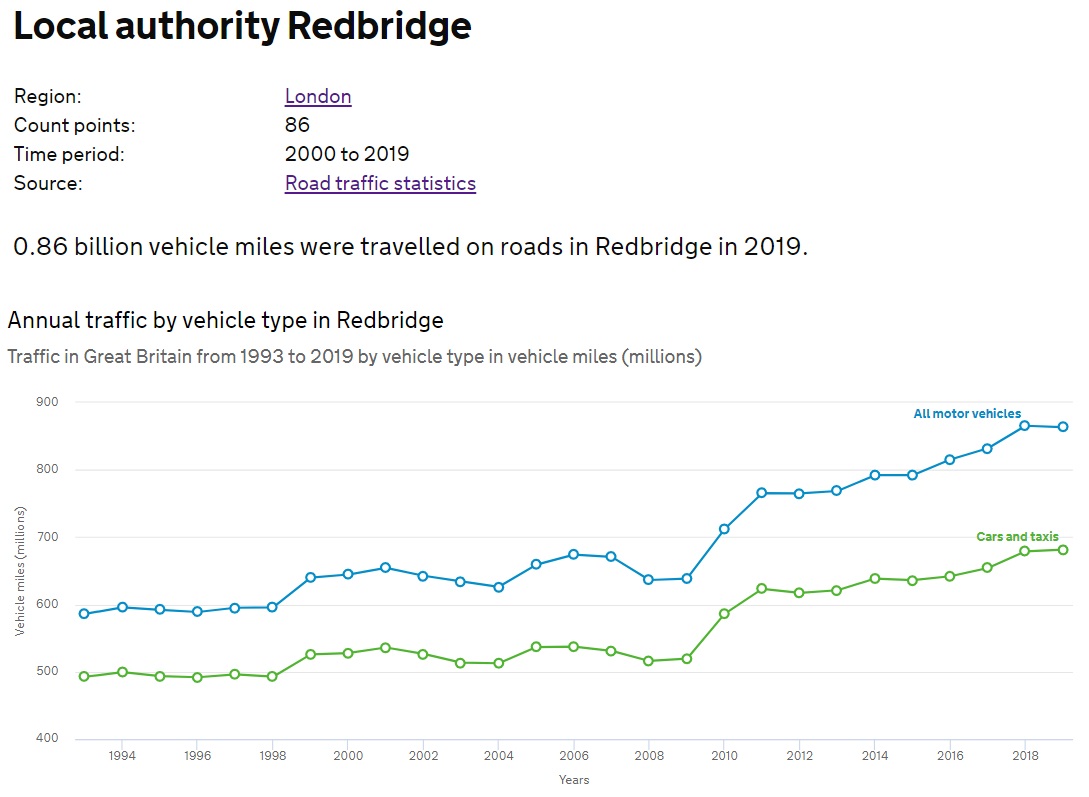
26/ Between 2008 and 2019, the number of miles driven on Redbridge& #39;s roads have increased by 227,000,000.
Two hundred and twenty-seven million miles.
Two hundred and twenty-seven million miles.
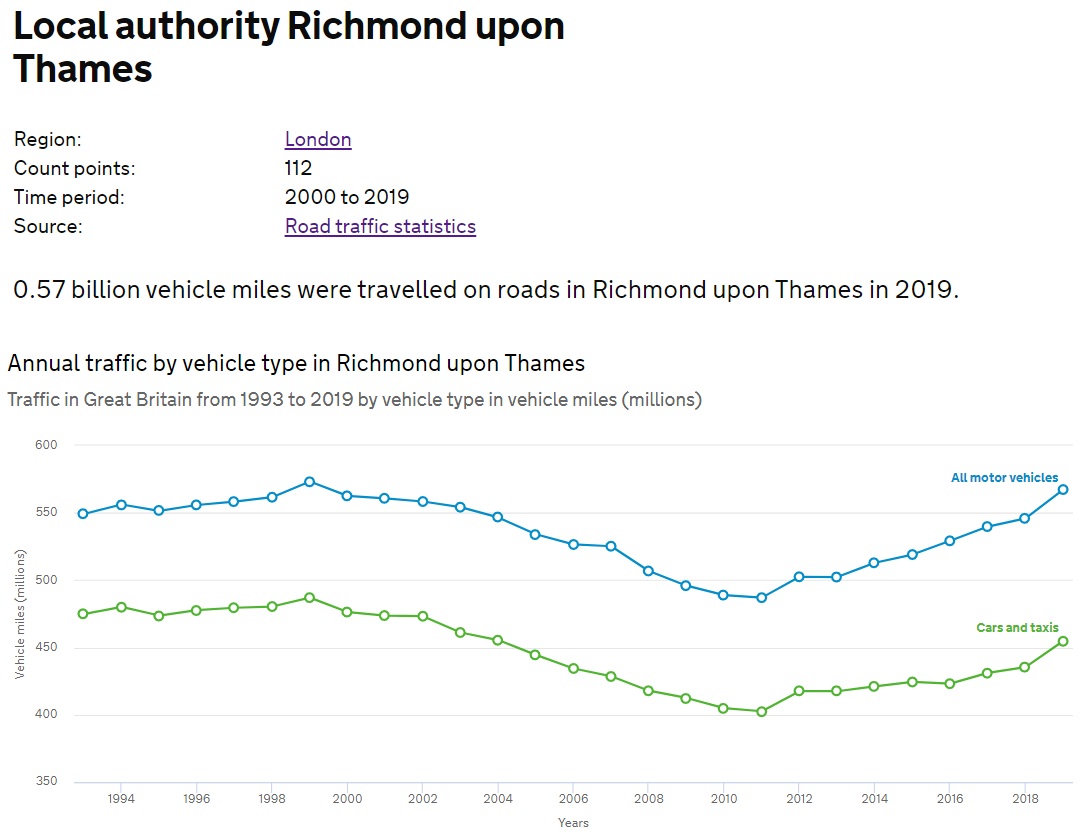
27/ Between 2008 and 2019, the number of miles driven on Richmond Upon Thames& #39; roads have increased by 80,000,000.
Eighty million miles.
Eighty million miles.
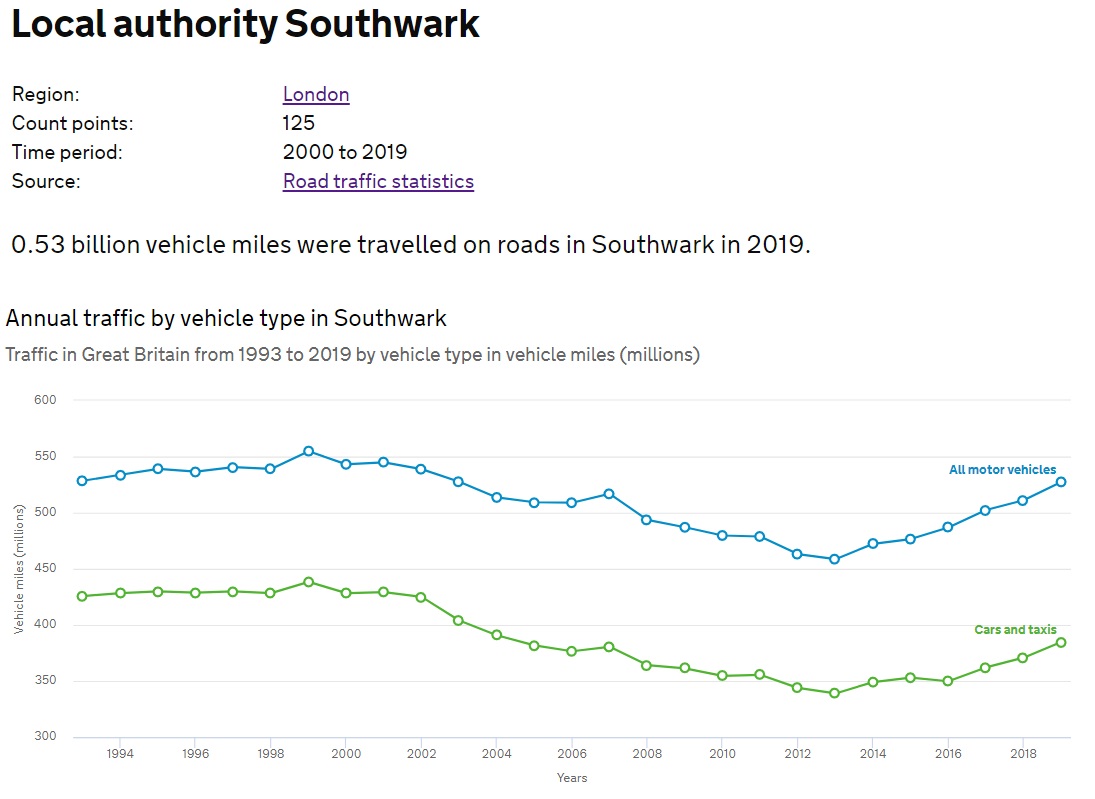
28/ Between 2013 and 2019, the number of miles driven on Southwark& #39;s roads have increased by 69,000,000.
Sixty-nine million miles.
Sixty-nine million miles.
29/ Between 2010 and 2019, the number of miles driven on Sutton& #39;s roads have increased by 114,000,000.
One hundred and fourteen million miles.
One hundred and fourteen million miles.
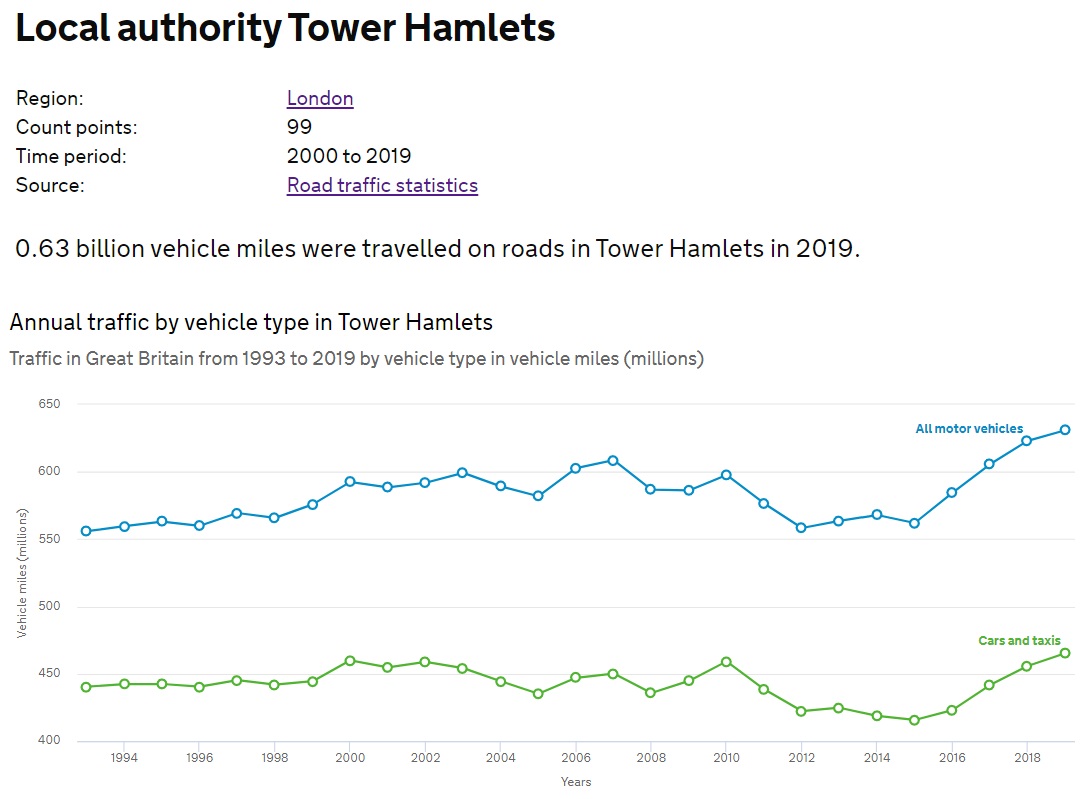
30/ Between 2012 and 2019, the number of miles driven on Tower Hamlets& #39; roads have increased by 73,000,000.
Seventy-three million miles.
Seventy-three million miles.
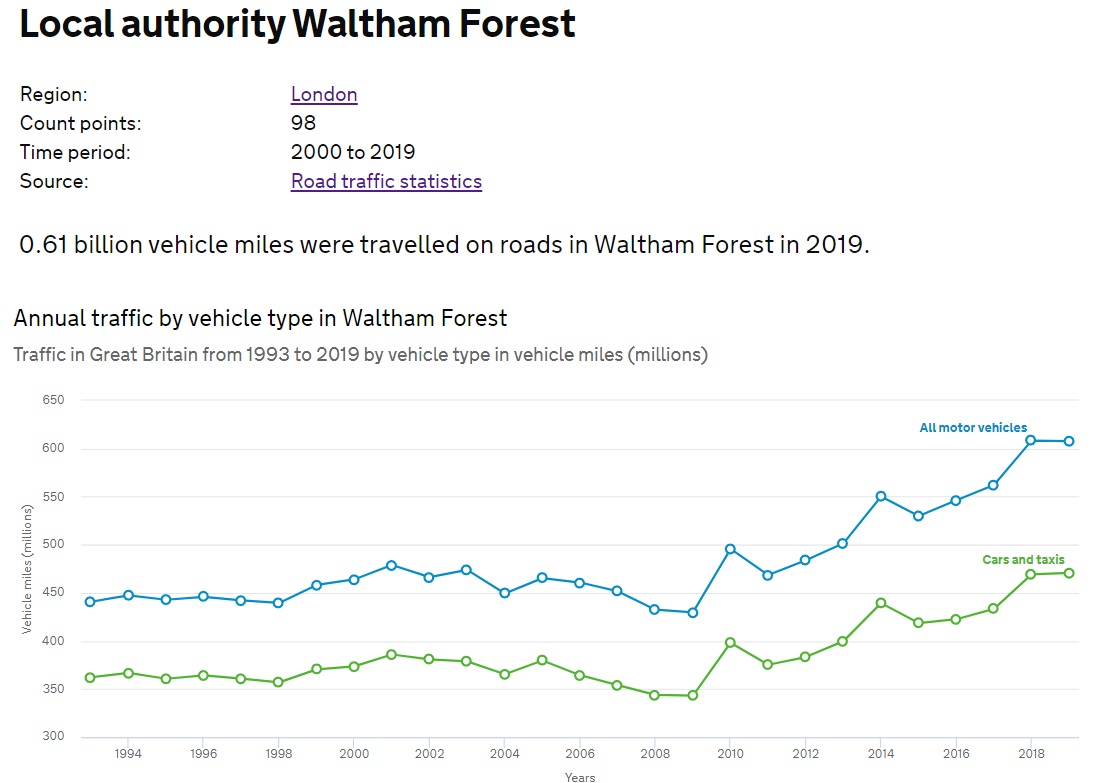
31/ Between 2009 and 2019, the number of miles driven on Waltham Forest& #39;s roads have increased by 178,000,000.
One hundred and seventy-eight million miles.
One hundred and seventy-eight million miles.
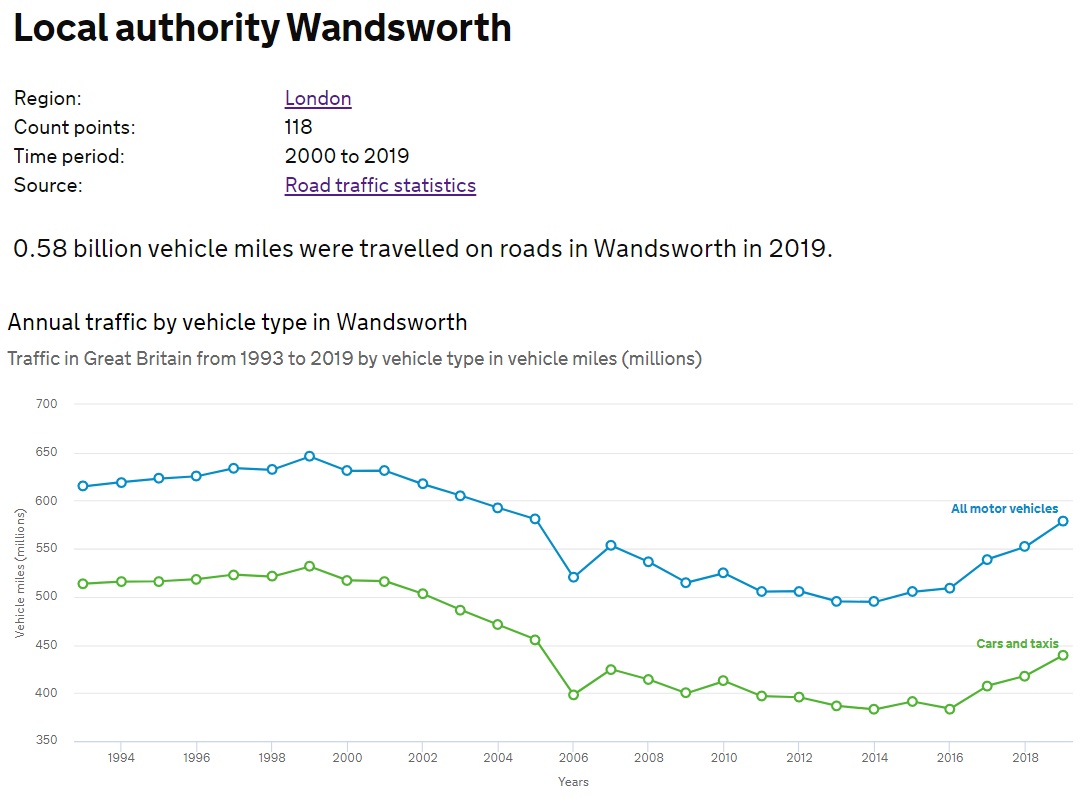
32/ Between 2014 and 2019, the number of miles driven on Wandsworth& #39;s roads have increased by 84,000,000.
Eighty-four million miles.
Eighty-four million miles.
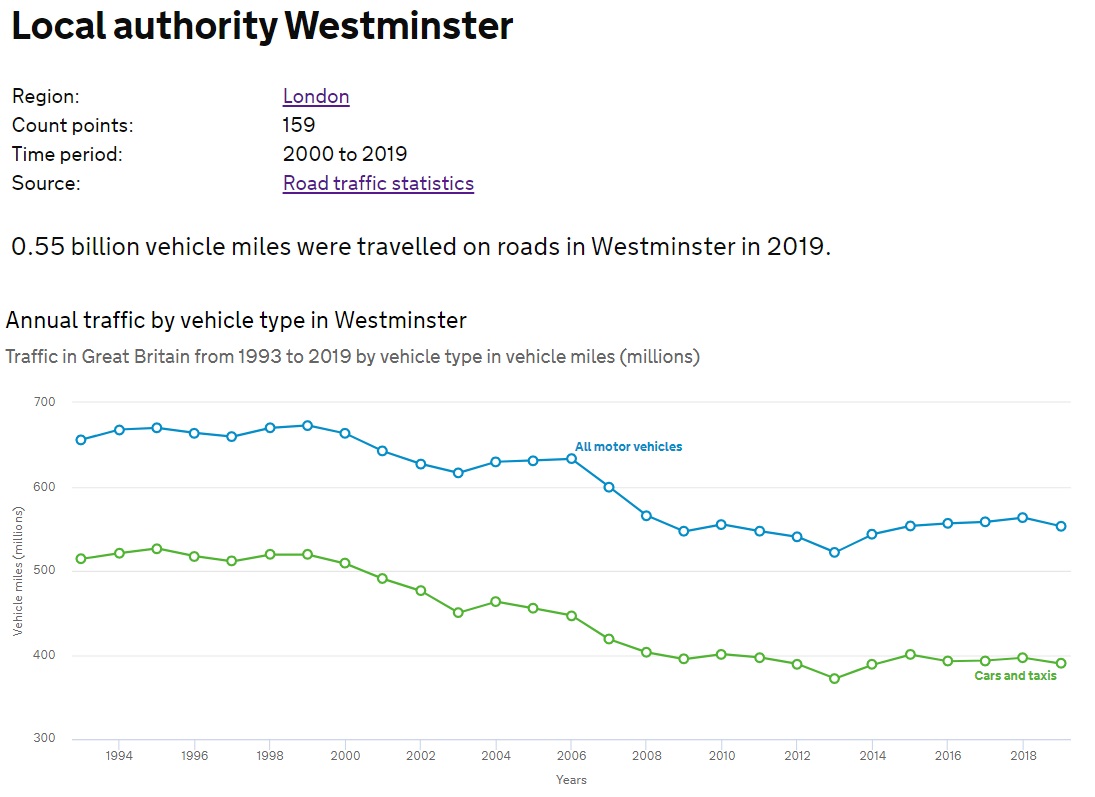
33/ Between 2013 and 2019, the number of miles driven on Westminster& #39;s roads have increased by 31,000,000.
Thirty-one million miles.
Thirty-one million miles.
34/ Between 2012 and 2019, the number of miles driven on the City of London& #39;s roads have increased by 4,000,000.
Four million miles.
Four million miles.
35/ Between 2009 and 2019, the number of miles driven on Greater London& #39;s roads have increased by 3,600,000,000.
Based on a conservative fuel consumption estimate of 11.1 miles per litre of fuel (via @racfoundation), this equates to an extra 324 million litres of fuel annually.
Based on a conservative fuel consumption estimate of 11.1 miles per litre of fuel (via @racfoundation), this equates to an extra 324 million litres of fuel annually.
36/ All the borough-level and London data in this thread is compiled by the Department for Transport and can be located here:
https://roadtraffic.dft.gov.uk/local-authorities
...and">https://roadtraffic.dft.gov.uk/local-aut... here
https://roadtraffic.dft.gov.uk/regions/6 ">https://roadtraffic.dft.gov.uk/regions/6...
https://roadtraffic.dft.gov.uk/local-authorities
...and">https://roadtraffic.dft.gov.uk/local-aut... here
https://roadtraffic.dft.gov.uk/regions/6 ">https://roadtraffic.dft.gov.uk/regions/6...

 Read on Twitter