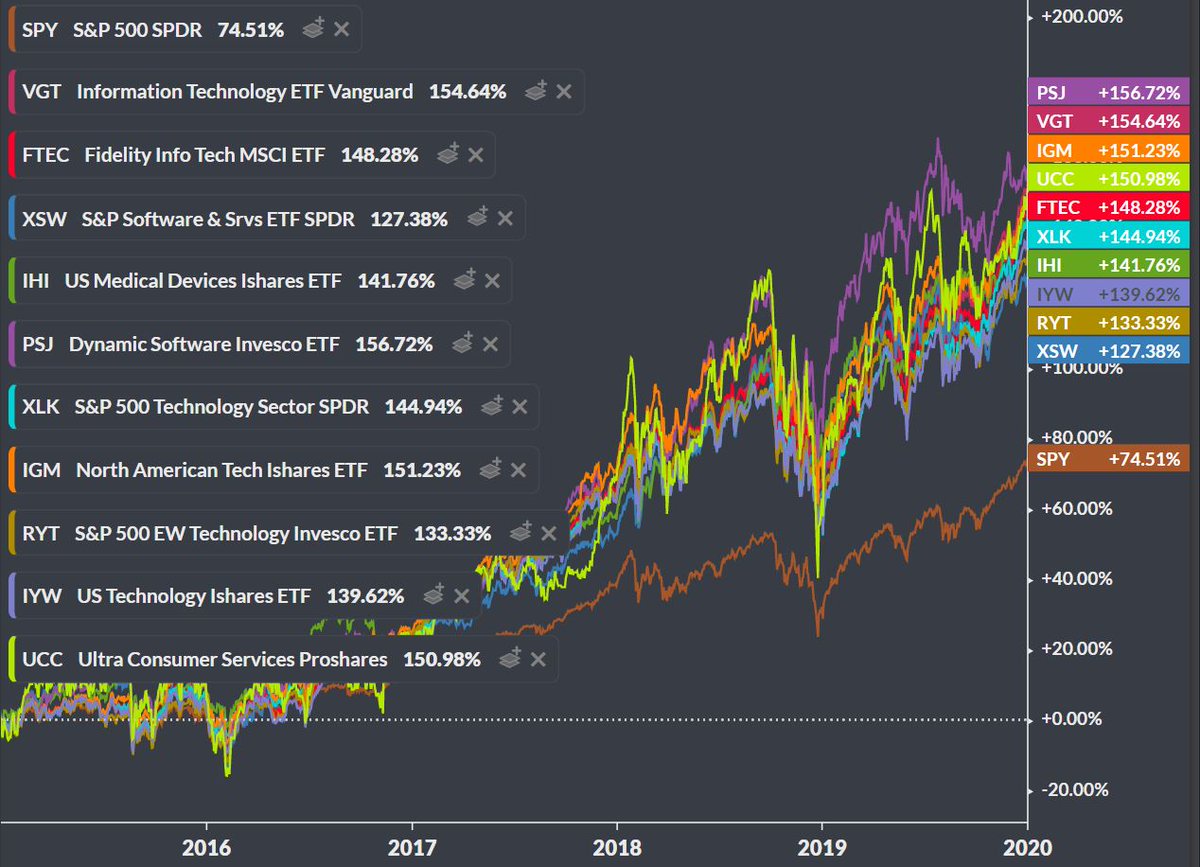
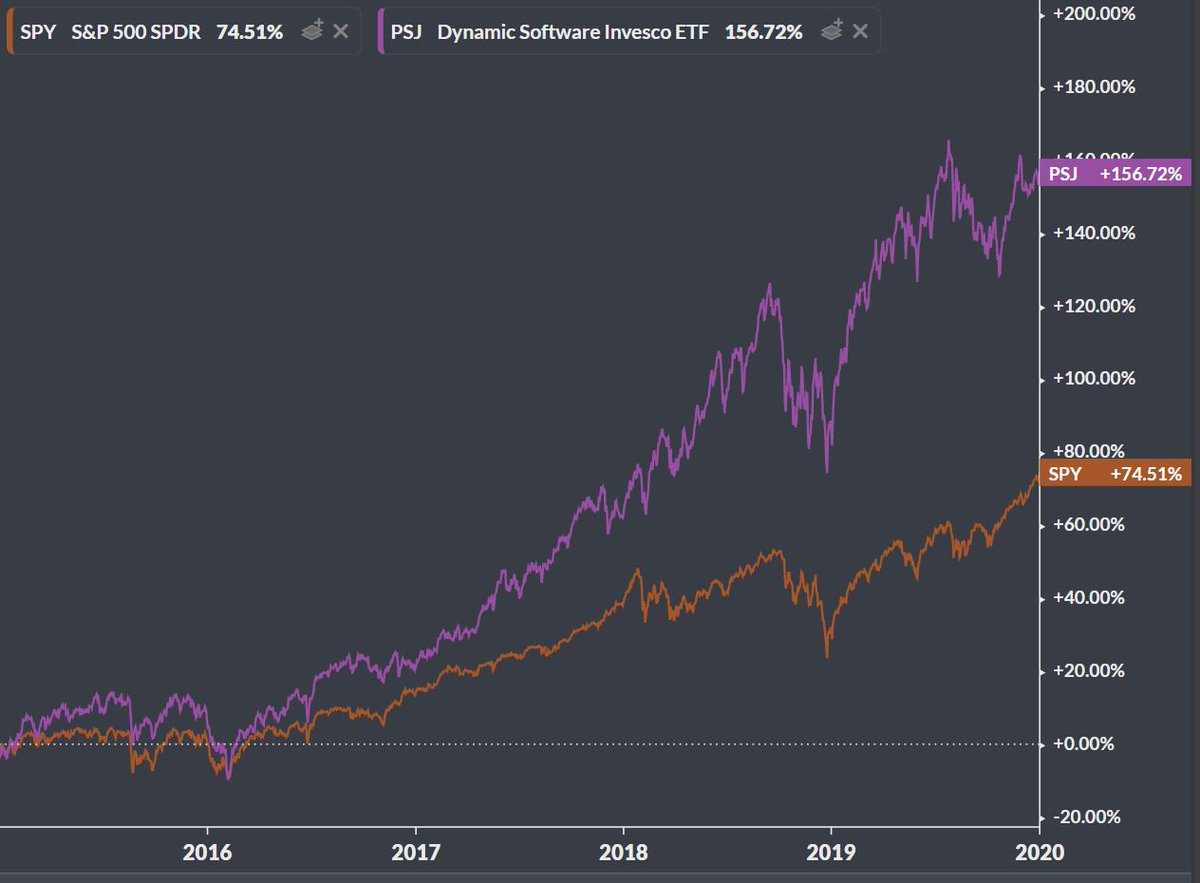
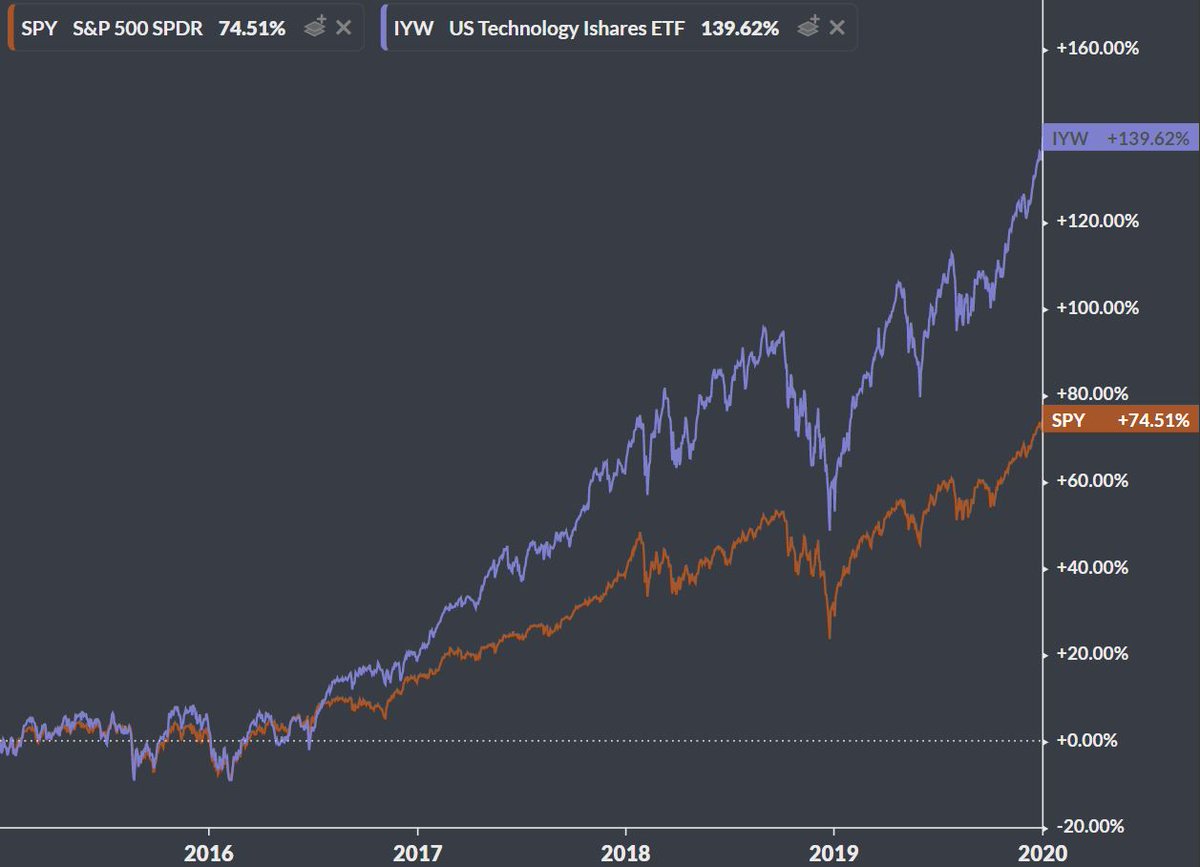
I looked at 1559 ETFs from 2015 - 2019. Surprisingly only the following amount outperformed the $SPY in a given year:
2015: 295, 19%
2016: 405, 26%
2017: 780, 50%
2018: 633, 41%
2019: 265, 17%
Only 10 outperformed in each of the 5 years.
Here is a thread of those
2015: 295, 19%
2016: 405, 26%
2017: 780, 50%
2018: 633, 41%
2019: 265, 17%
Only 10 outperformed in each of the 5 years.
Here is a thread of those
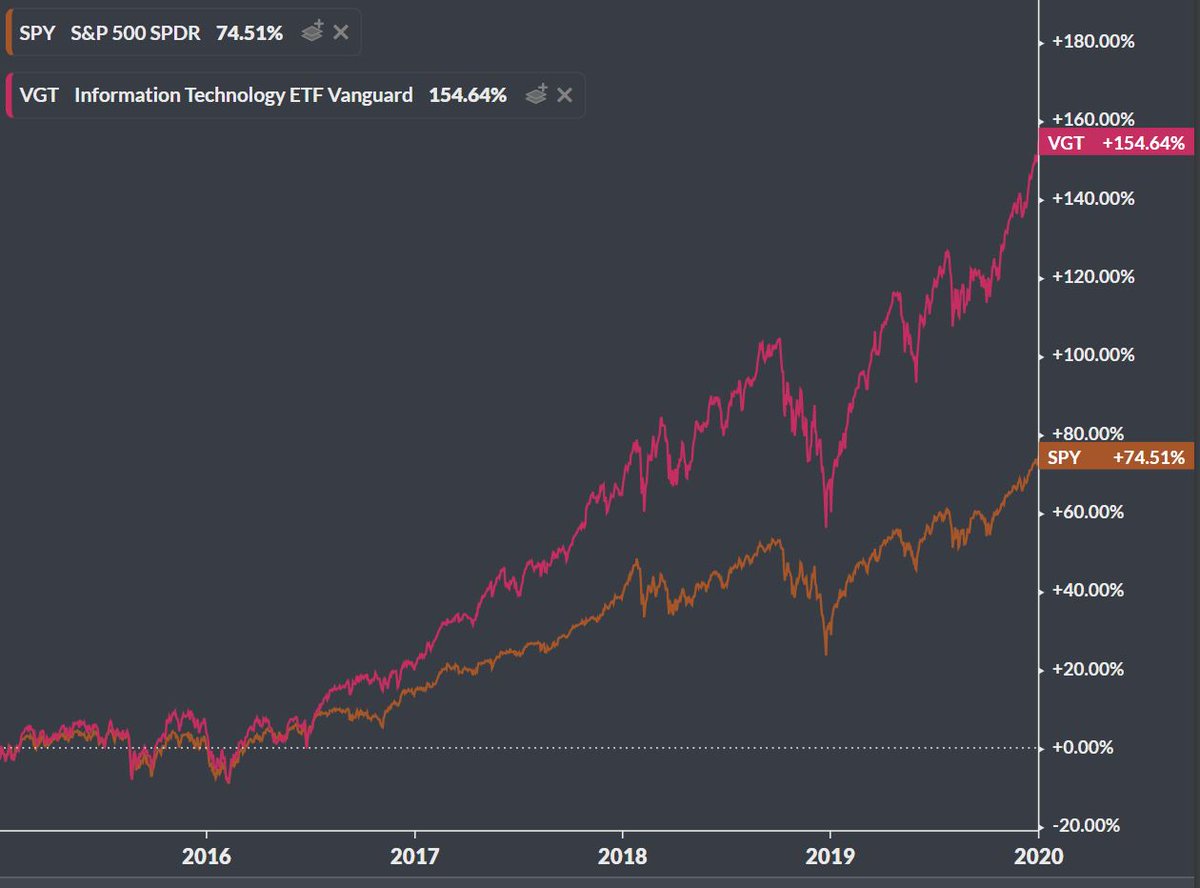
$VGT - Vanguard Information Technology ETF
Expense Ratio: 0.10%
327 Holdings
Largest Holding = $AAPL at 21.78%
Expense Ratio: 0.10%
327 Holdings
Largest Holding = $AAPL at 21.78%
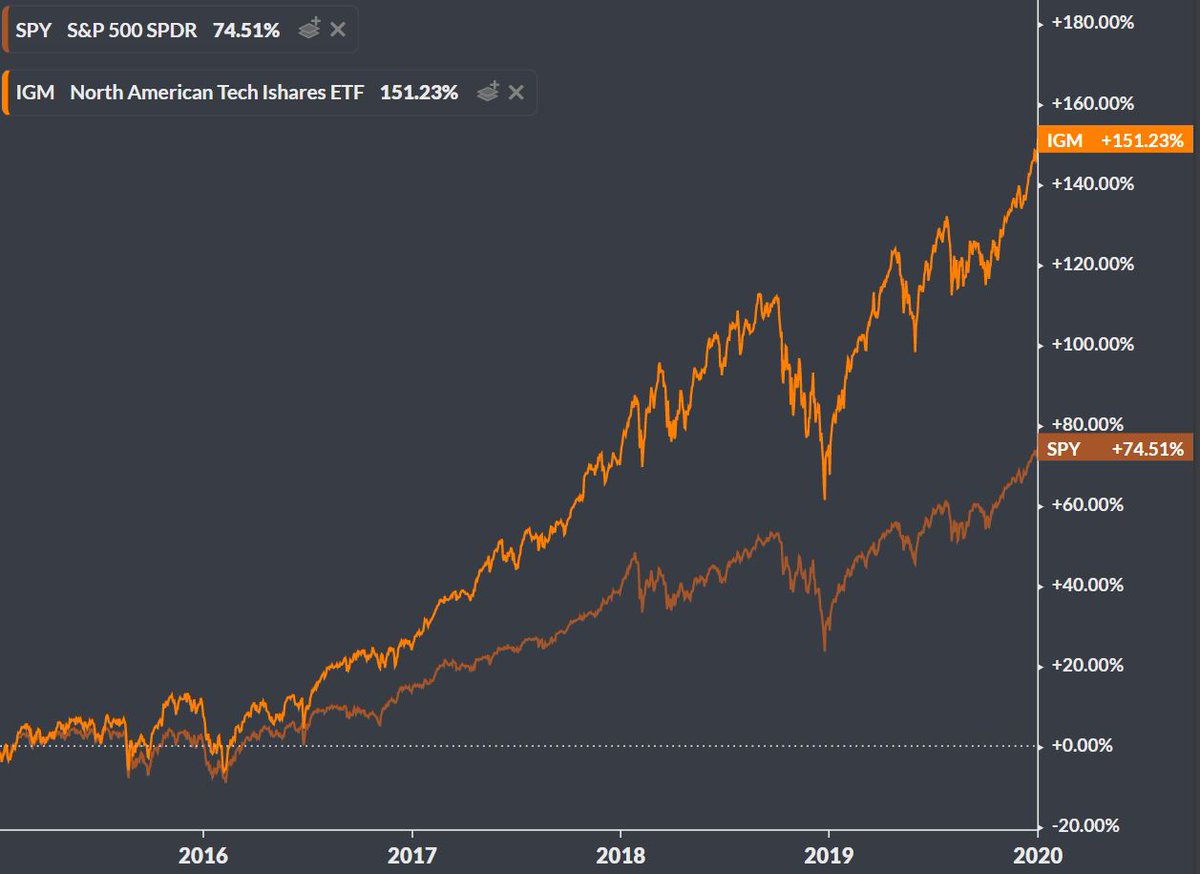
$IGM- iShares Expanded Tech Sector ETF
Expense Ratio: 0.46%
296 Holdings
Largest Holding = $MSFT at 8.44%
Expense Ratio: 0.46%
296 Holdings
Largest Holding = $MSFT at 8.44%
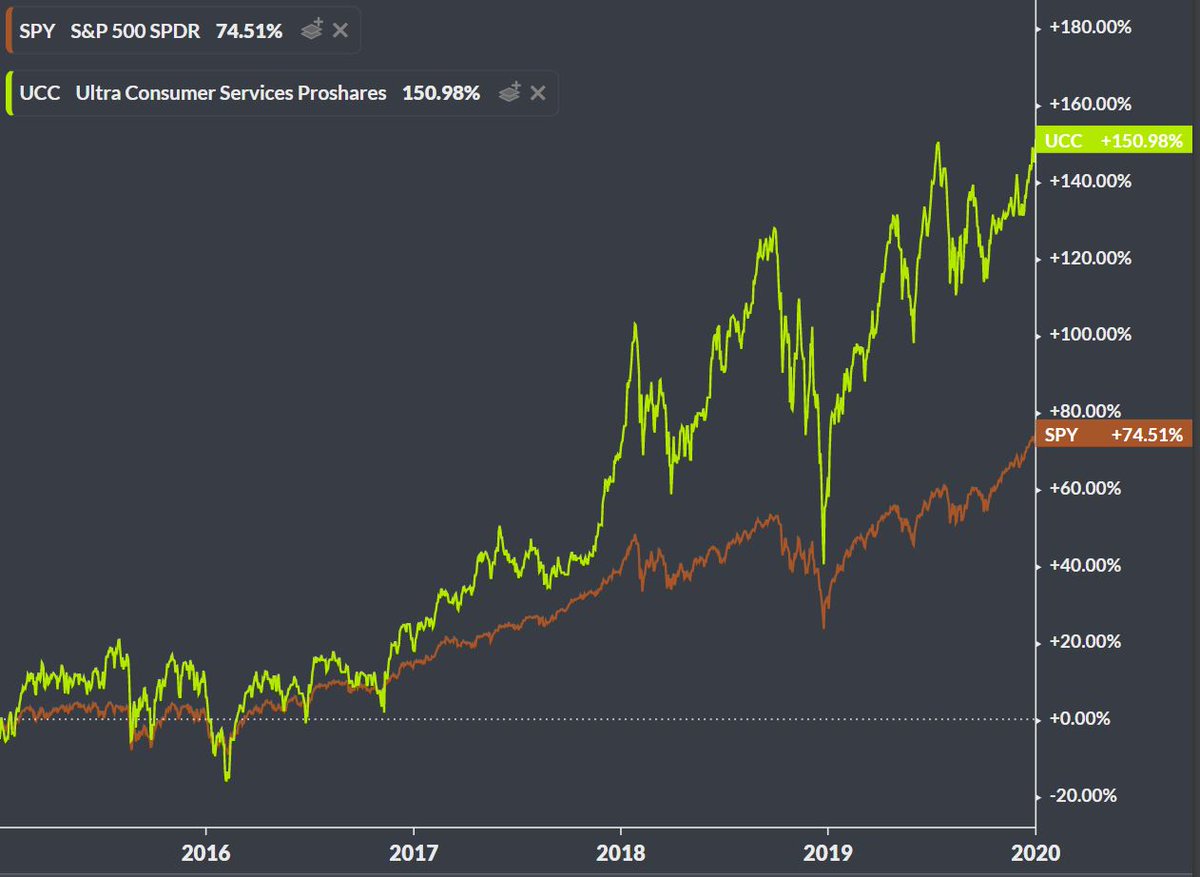
$UCC- ProShares Ultra Consumer Services
Expense Ratio: 0.95%
133 Holdings
Largest Holding = $AMZN at 28.59%
*This is a 2x daily leveraged ETF
Expense Ratio: 0.95%
133 Holdings
Largest Holding = $AMZN at 28.59%
*This is a 2x daily leveraged ETF
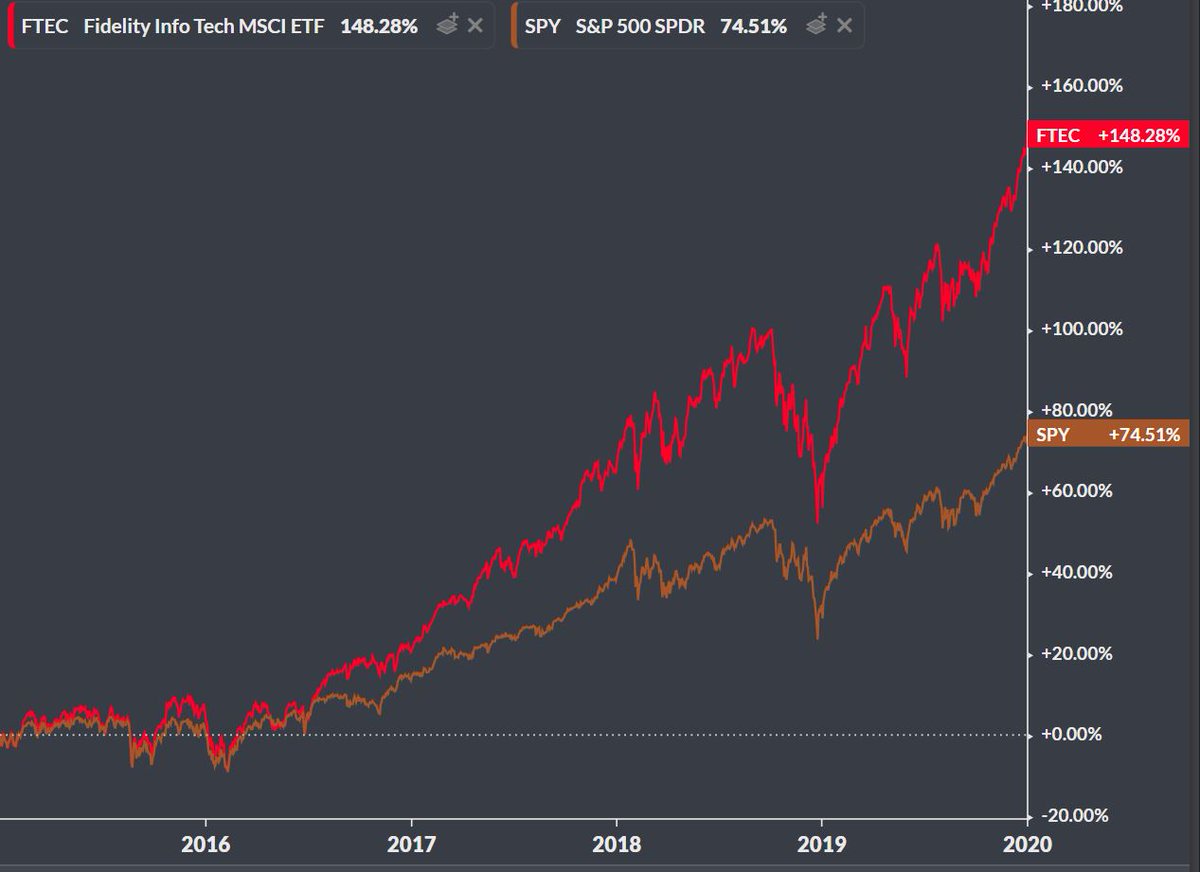
$FTEC- Fidelity MSCI Information Technology Index ETF
Expense Ratio: 0.08%
312 Holdings
Largest Holding = $AAPL at 21.76%
Expense Ratio: 0.08%
312 Holdings
Largest Holding = $AAPL at 21.76%
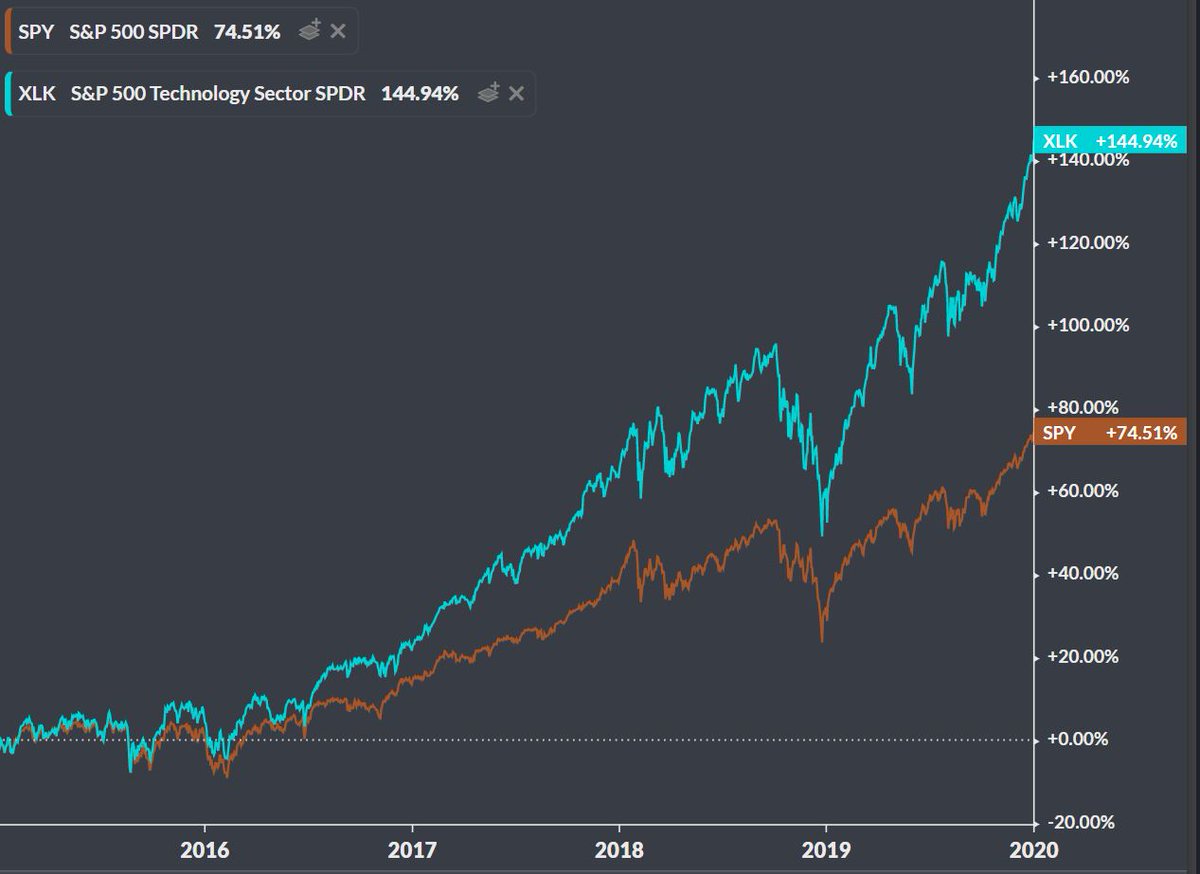
$XLK- Technology Select Sector SPDR Fund
Expense Ratio: 0.13%
73 Holdings
Largest Holding = $AAPL at 23.59%
Expense Ratio: 0.13%
73 Holdings
Largest Holding = $AAPL at 23.59%
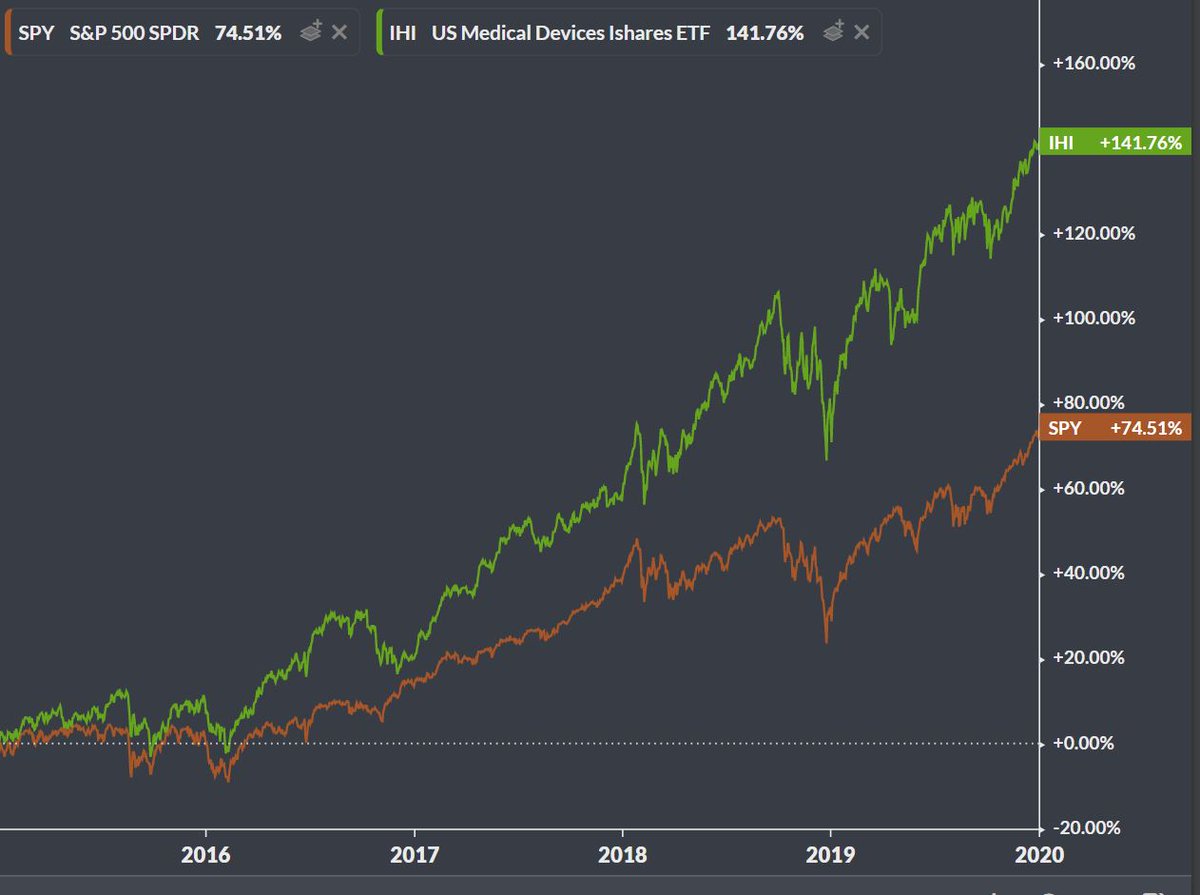
$IHI- iShares U.S. Medical Devices ETF
Expense Ratio: 0.43%
64 Holdings
Largest Holding = $ABT at 13.97%
Expense Ratio: 0.43%
64 Holdings
Largest Holding = $ABT at 13.97%
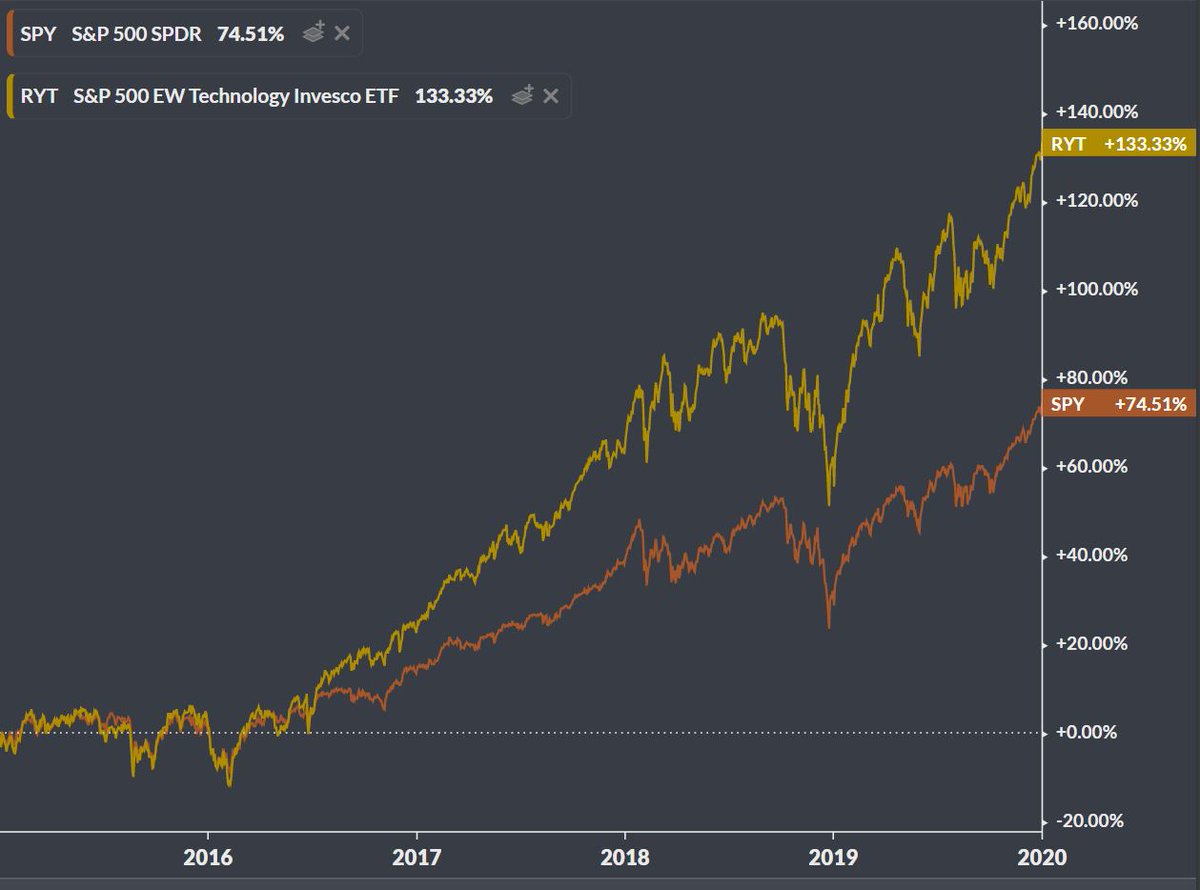
$RYT- Invesco S&P 500 Equal Weight Technology ETF
Expense Ratio: 0.40%
73 Holdings
Largest Holding = $LRCX at 1.54%
Expense Ratio: 0.40%
73 Holdings
Largest Holding = $LRCX at 1.54%
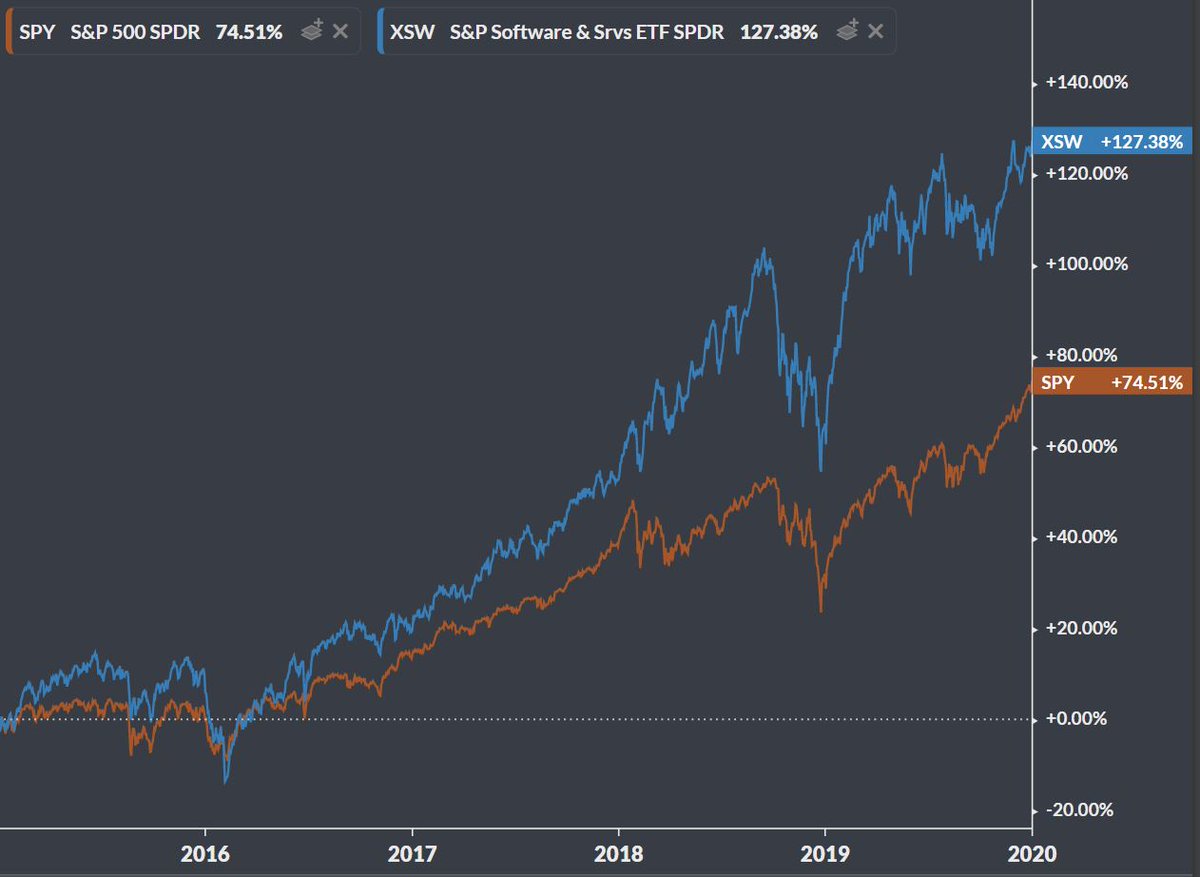
$XSW- SPDR S&P Software & Services ETF
Expense Ratio: 0.35%
170 Holdings
Largest Holding = $AVYA at 0.81%
Expense Ratio: 0.35%
170 Holdings
Largest Holding = $AVYA at 0.81%
If you liked this thread, I write a weekly email on Tech ETFs at
https://finlister.substack.com/ ">https://finlister.substack.com/">...
and will be releasing an ETF screening tool shortly.
https://finlister.substack.com/ ">https://finlister.substack.com/">...
and will be releasing an ETF screening tool shortly.

 Read on Twitter