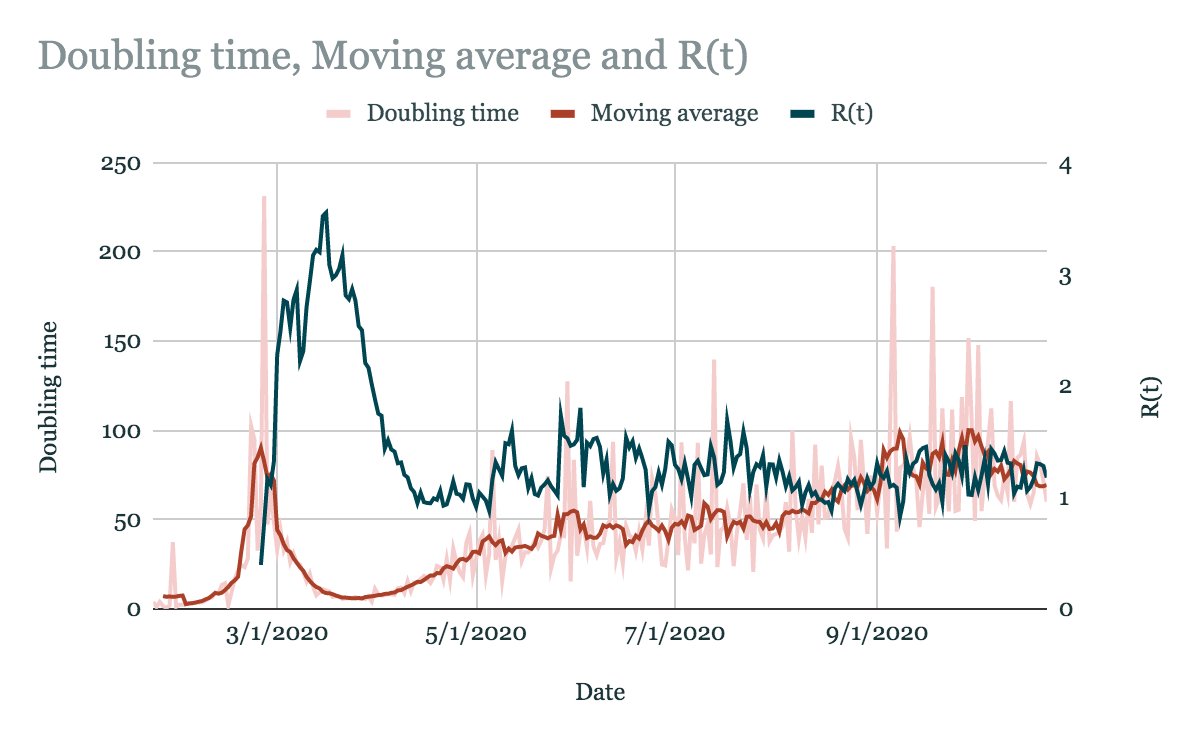
Global R(t) has been remarkably stable since the first wave. Here it is plotted against global doubling time. Will try to unpack this further when I get a chance but it’s a good news/bad news story: many infections ahead, but this isn’t open-ended.
“Moving average” = 7 day moving average for doubling time.
Just to unpack this a bit, there& #39;s a direct relationship between R and doubling time, inasmuch as R(t) is a function of growth rate, as is doubling time. Doubling time may just be a bit more intuitive.
We can see in the graph that both R and doubling time have actually changed little since April.
We are currently around 42 million COUNTED cases globally; let& #39;s say we& #39;re under-estimating infections by a factor of 20...probably about right. https://twitter.com/DFisman/status/1262141885986082817?s=20">https://twitter.com/DFisman/s...
We are currently around 42 million COUNTED cases globally; let& #39;s say we& #39;re under-estimating infections by a factor of 20...probably about right. https://twitter.com/DFisman/status/1262141885986082817?s=20">https://twitter.com/DFisman/s...

 Read on Twitter


