Schools + comments on some sources (THREAD)
This recent schools article makes some great points, and @apoorva_nyc is one of the top science journos on covid out there, but a few of the sources cited in this one have some issues, especially a few pages from govt websites. 1/22 https://twitter.com/apoorva_nyc/status/1319408652311285761">https://twitter.com/apoorva_n...
This recent schools article makes some great points, and @apoorva_nyc is one of the top science journos on covid out there, but a few of the sources cited in this one have some issues, especially a few pages from govt websites. 1/22 https://twitter.com/apoorva_nyc/status/1319408652311285761">https://twitter.com/apoorva_n...
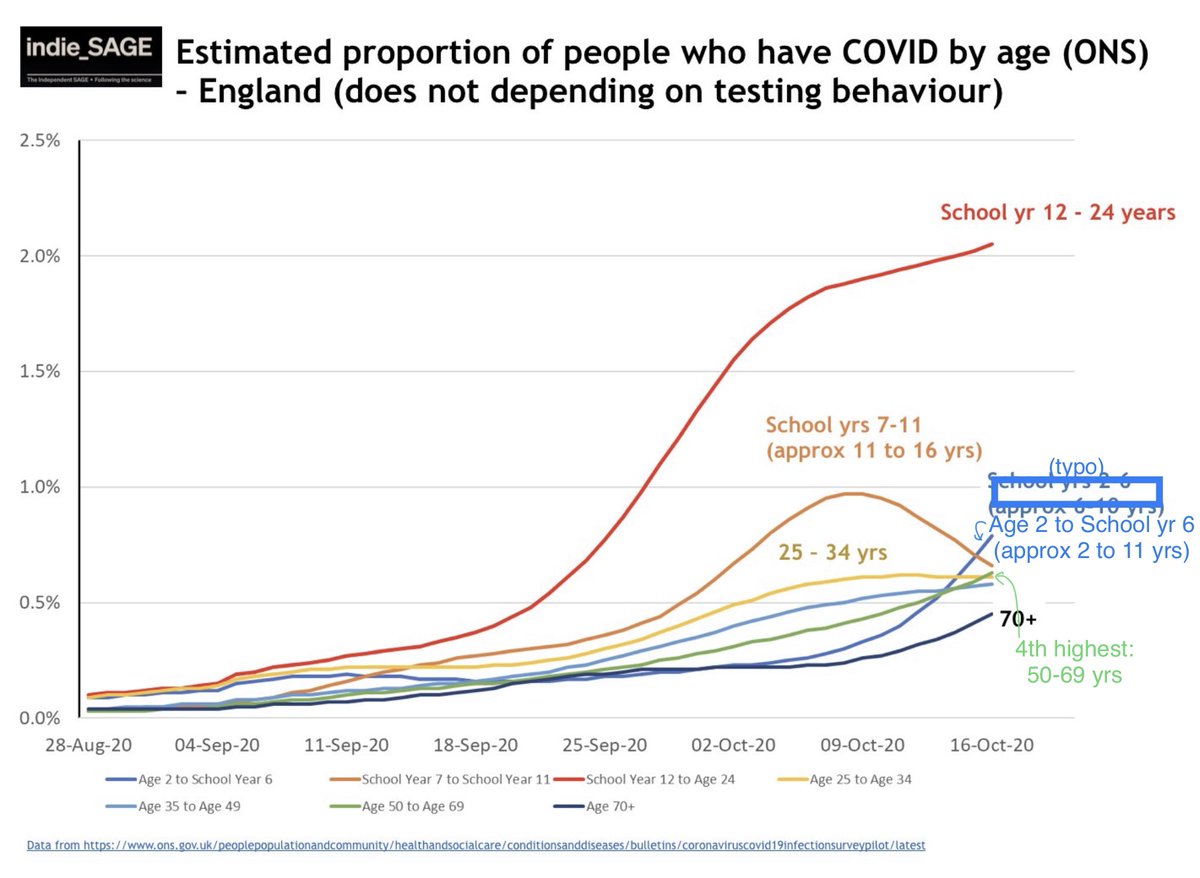
-UK link is outdated. For late Oct, random sampling estimates all 3 child age-groups more infected than any adult group. 2-11s are 2nd highest!
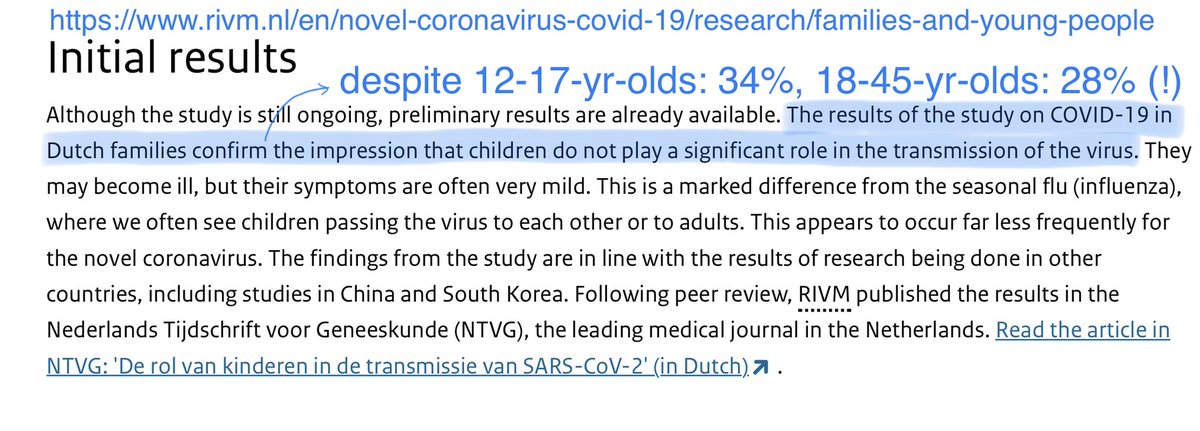
-The Netherlands govt website badly mischaracterises its study.
-Pediatrics childcare-worker study and NYC article need comment. 2/22
-The Netherlands govt website badly mischaracterises its study.
-Pediatrics childcare-worker study and NYC article need comment. 2/22
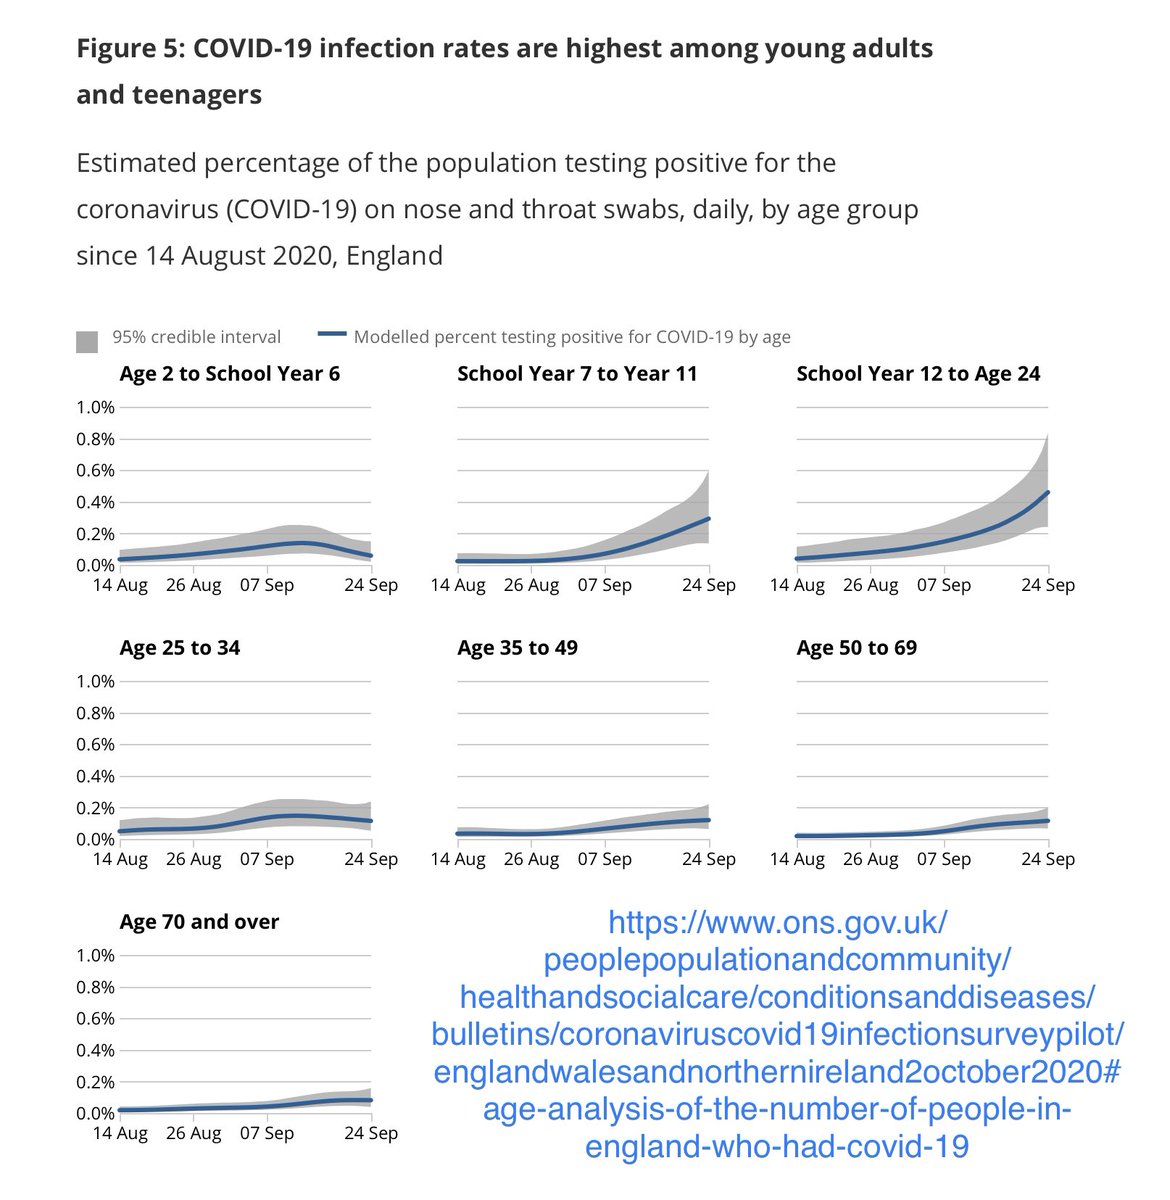
UK schools opened at start of September. No remote school, even for families with medical vulnerability. No temporary home schooling either.
The article’s linked UK govt webpage shows Sept infection https://abs.twimg.com/emoji/v2/... draggable="false" alt="⬆️" title="Pfeil nach oben" aria-label="Emoji: Pfeil nach oben"> for secondary-school and
  https://abs.twimg.com/emoji/v2/... draggable="false" alt="⬇️" title="Pfeil nach unten" aria-label="Emoji: Pfeil nach unten"> for primary-school and a few other groups. 3/22
The article’s linked UK govt webpage shows Sept infection
EXCEPT these graphs are outdated and later required serious revision.
As @ChrisGiles_ demonstrates, ONS modelling has a track record of underestimating growth for the end of the time period shown, and then later revising. See especially the green late-September dip. 4/22 https://twitter.com/chrisgiles_/status/1319620517796741120">https://twitter.com/chrisgile...
As @ChrisGiles_ demonstrates, ONS modelling has a track record of underestimating growth for the end of the time period shown, and then later revising. See especially the green late-September dip. 4/22 https://twitter.com/chrisgiles_/status/1319620517796741120">https://twitter.com/chrisgile...
. @IndependentSage graphed the latest ONS random-sampling results. Spreadsheet says by 16 Oct, the 4 highest-infection age groups were
16-24-yr-olds (2.05%), 2-11-yrs (.79%), 11-16-yrs (.66%), and 50-69-yrs (.63%).
Ie, 2-11’s 25% higher than the highest all-adult bucket! 5/22
16-24-yr-olds (2.05%), 2-11-yrs (.79%), 11-16-yrs (.66%), and 50-69-yrs (.63%).
Ie, 2-11’s 25% higher than the highest all-adult bucket! 5/22
Yes, ONS previously underestimated infection for final weeks, but prior underestimates were fairly uniform across age groups.
This large-N random sampling also reveals that UK symptom-based PCR testing has substantially under-reported child infection, relative to adults. 6/22
This large-N random sampling also reveals that UK symptom-based PCR testing has substantially under-reported child infection, relative to adults. 6/22
Why 2-11 > 11-16? Primary students get many colds. Avoiding testing cold-like symptoms and asymptomatic kids means many cases missed.
More 11-16 cases found with PCR. Many secondary schools home-isolated whole yr groups. Also, MASKS: many UK primary schools *forbid* masks. 7/22 https://twitter.com/sarahdrasmussen/status/1309437278218006528">https://twitter.com/sarahdras...
More 11-16 cases found with PCR. Many secondary schools home-isolated whole yr groups. Also, MASKS: many UK primary schools *forbid* masks. 7/22 https://twitter.com/sarahdrasmussen/status/1309437278218006528">https://twitter.com/sarahdras...
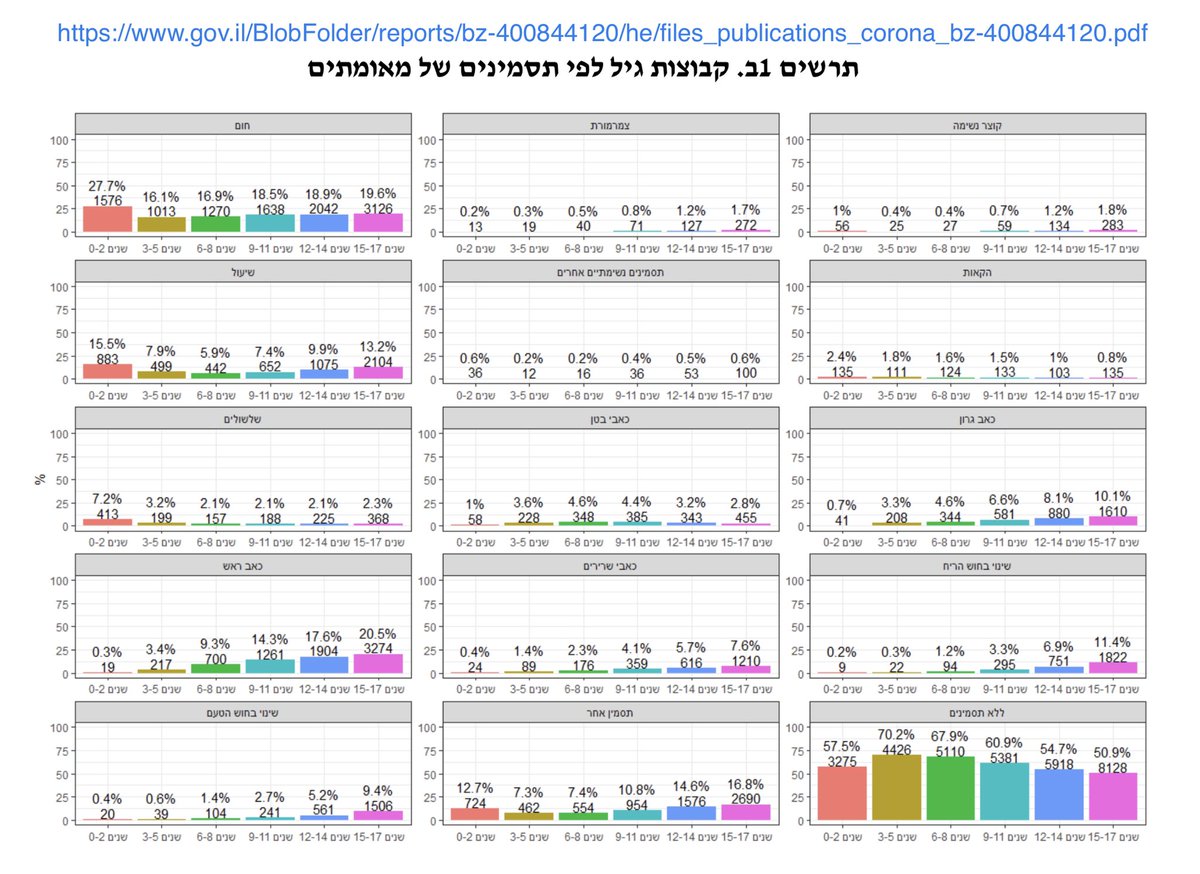
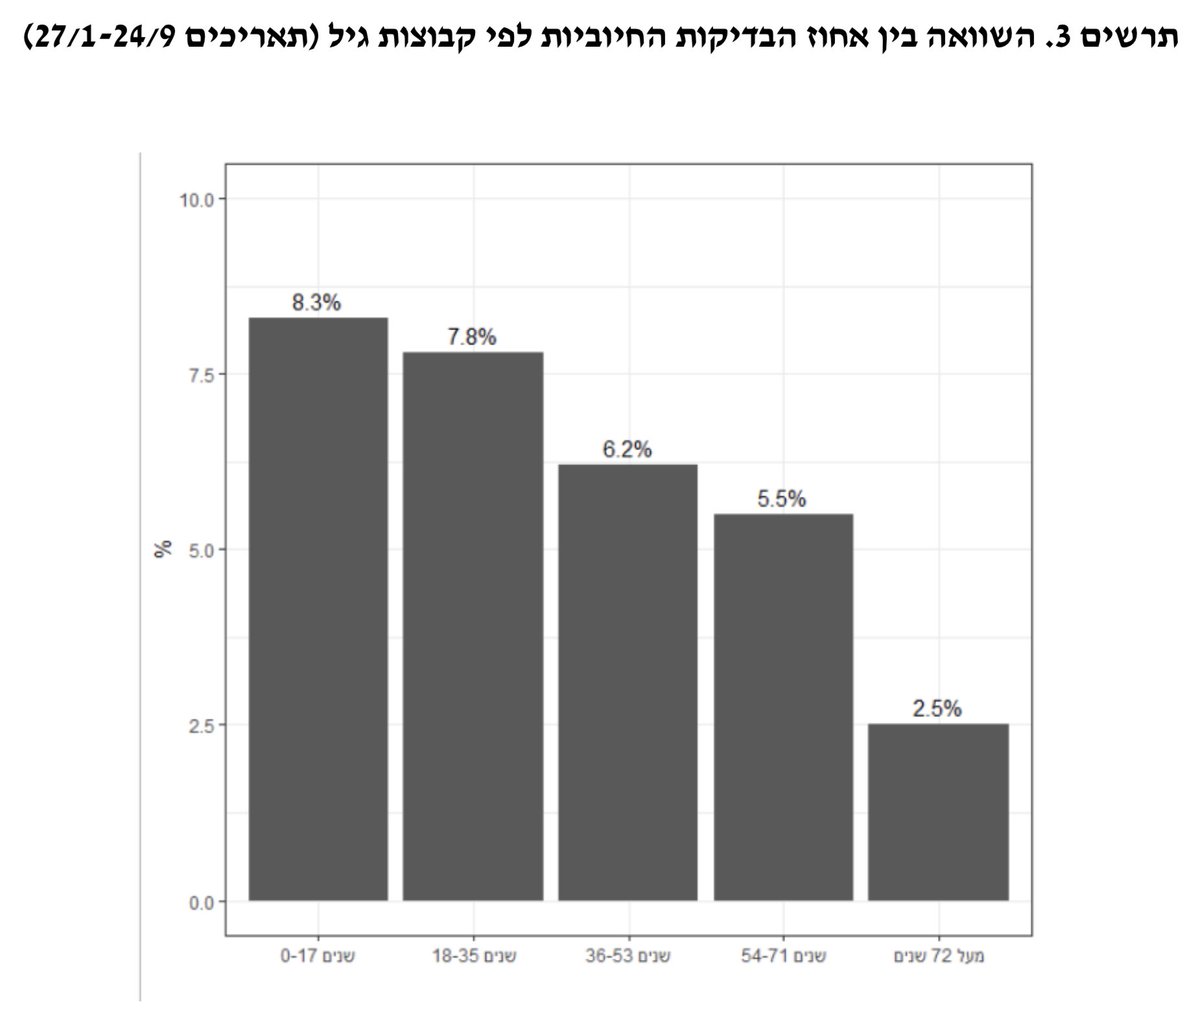
Kids dominating infection isn’t just a UK thing. It appears to be a “wide-spread testing in context of circulating kids” thing. Like Isreal’s Health ministry’s recent findings.
TOI says was based on >2 million tests, for a population of <9 million.
https://www.timesofisrael.com/health-ministry-report-finds-kids-more-likely-to-catch-virus-than-adults/">https://www.timesofisrael.com/health-mi... 8/22
TOI says was based on >2 million tests, for a population of <9 million.
https://www.timesofisrael.com/health-ministry-report-finds-kids-more-likely-to-catch-virus-than-adults/">https://www.timesofisrael.com/health-mi... 8/22
Next source: Netherlands govt webpage.
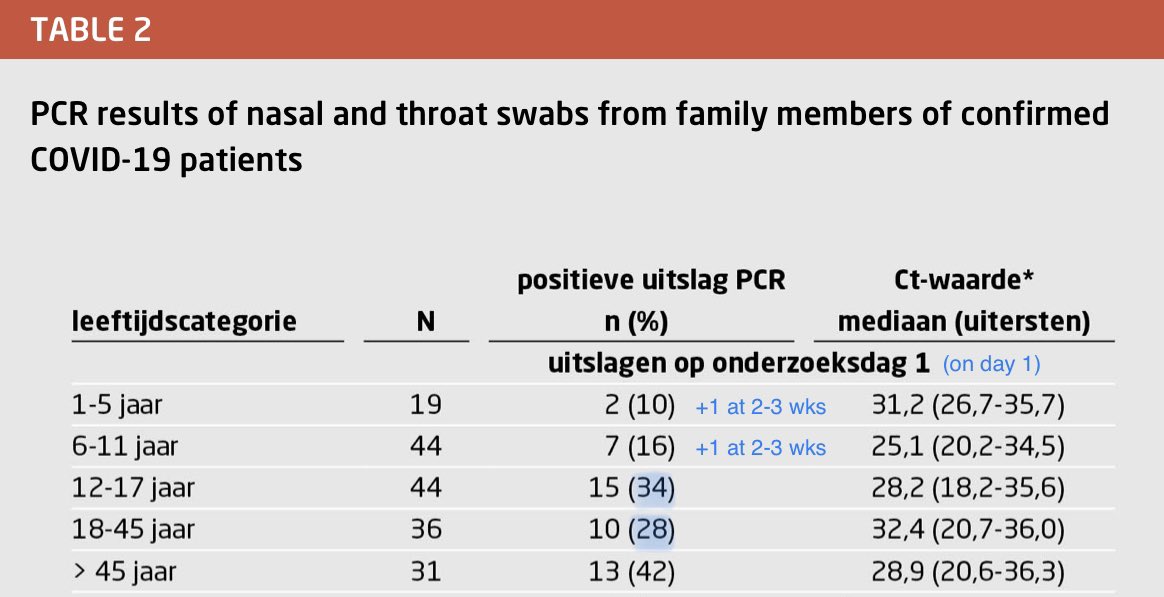
This page totally mischaracterises a small sample-size 54-household study of families of covid-infected patients.
In the actual study, 12-17-yr-old household contacts had a *higher* infection rate (34%) than 18-45-yr-olds (28%). 9/22
This page totally mischaracterises a small sample-size 54-household study of families of covid-infected patients.
In the actual study, 12-17-yr-old household contacts had a *higher* infection rate (34%) than 18-45-yr-olds (28%). 9/22
Total 18+ rate: (10+13/36+31)=34%, same as 12-17.
The only groups with new +ive PCR tests at 2-3 weeks were 1-5- and 6-11-yr-olds, with 1 new case each, totaling to 16% and 18%.
So overall, the 3 child hh contact grps had 57%, 64%, and 121% the infection rate of 18-45s. 10/22
The only groups with new +ive PCR tests at 2-3 weeks were 1-5- and 6-11-yr-olds, with 1 new case each, totaling to 16% and 18%.
So overall, the 3 child hh contact grps had 57%, 64%, and 121% the infection rate of 18-45s. 10/22
Next source: Pediatrics study on US childcare workers for mostly <6s.
This was a much better source: large sample size, good collection of contextual data...
But they failed to ask workers the most important question: what did you do for income if your center closed? 11/22
This was a much better source: large sample size, good collection of contextual data...
But they failed to ask workers the most important question: what did you do for income if your center closed? 11/22
Because unlike school teaching, infant childcare cannot be done remotely, and *many* childcare workers don’t have enough savings to go months with no income.
So what did they do instead for money—individual childcare in less regimented settings, food delivery?, what? 12/22
So what did they do instead for money—individual childcare in less regimented settings, food delivery?, what? 12/22
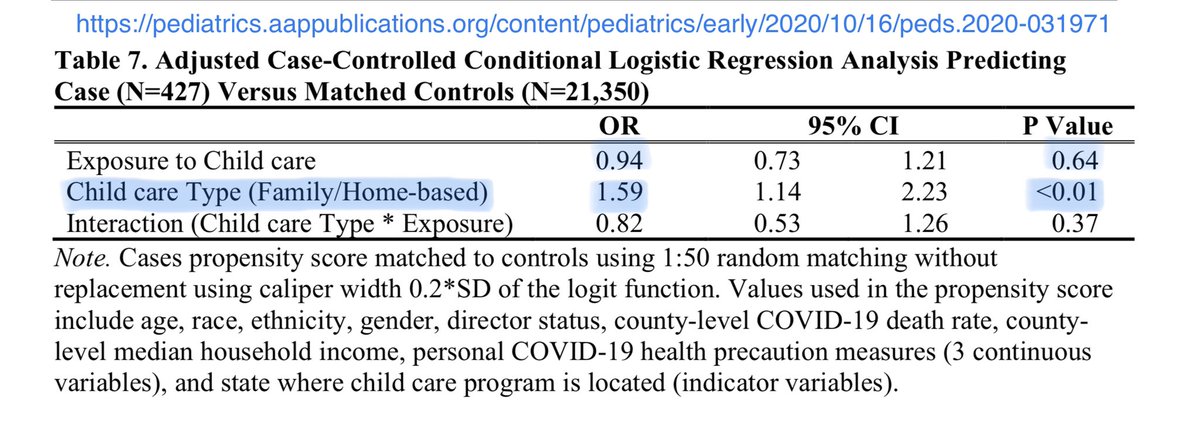
With P<.01, home-based childcare workers had a 59% higher infection risk than non-home-based. This notably was independent of whether officially required to be closed.
Home-based workers would likely have an easier time arranging unofficial childcare work for themselves. 13/22
Home-based workers would likely have an easier time arranging unofficial childcare work for themselves. 13/22
There were also paradoxical effects.
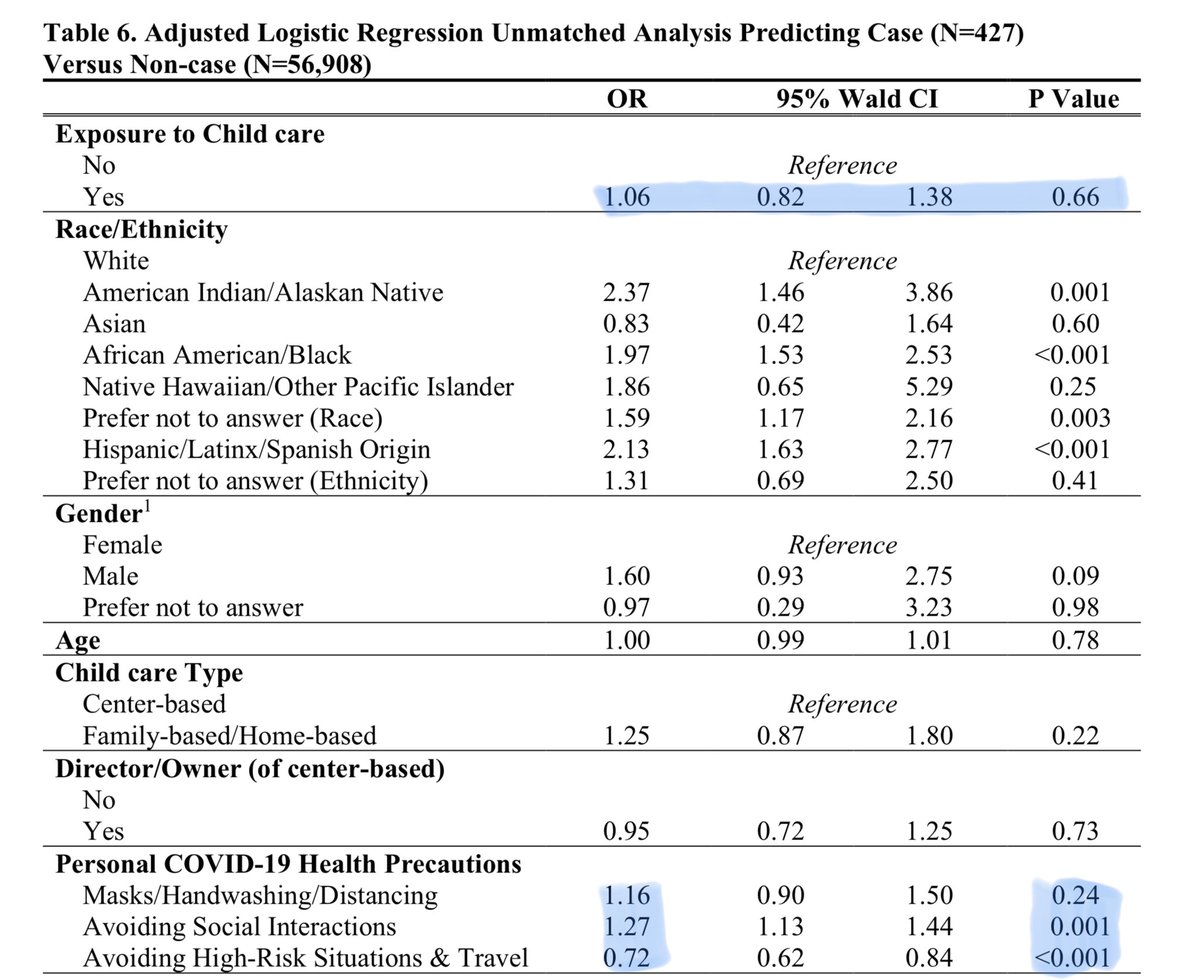
More masks/hand-washing/social-distancing in public meant a *higher* infection rate (OR 1.16, P=.24).
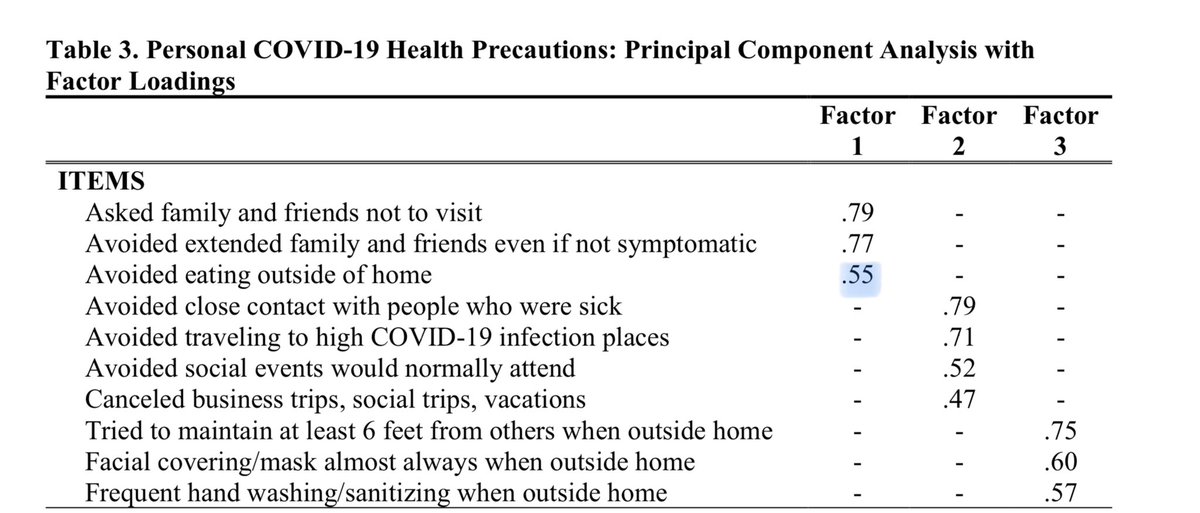
Granted P=.24, but for P=.001, avoiding friends + extended family, and (especially) avoiding eating out, meant 27% more infection. 14/22
More masks/hand-washing/social-distancing in public meant a *higher* infection rate (OR 1.16, P=.24).
Granted P=.24, but for P=.001, avoiding friends + extended family, and (especially) avoiding eating out, meant 27% more infection. 14/22
To explain this, authors guessed maybe higher vigilance occurred in higher-covid areas.
OTOH, maybe workers used more masks etc if forced to *work* in exposed settings. Less eating out could also have correlated with more financial vulnerability and greater need to work. 15/22
OTOH, maybe workers used more masks etc if forced to *work* in exposed settings. Less eating out could also have correlated with more financial vulnerability and greater need to work. 15/22
Valid comparisons require knowing what the control group did.
All this study shows is that whatever childcare workers did *after* they lost their official childcare job, that provided comparable infection exposure to what open childcare centers provided for other workers. 16/22
All this study shows is that whatever childcare workers did *after* they lost their official childcare job, that provided comparable infection exposure to what open childcare centers provided for other workers. 16/22
Next up: the NYC schools article.
Whereas the article reports 378 school cases found by targeted testing, random sampling of 16.3K staff and students found 28 cases.
BUT: what matters is how that compares to *community* levels. https://www.nytimes.com/2020/10/19/nyregion/schools-coronavirus.html">https://www.nytimes.com/2020/10/1... 17/22
Random sampling for the school week from 9 Oct (9+13-16, schools closed on 12th) found 28 cases out of 16.3K tests, or .17%.
Avg +ive targeted PCR tests for NYC then was 461/8.4 mil/day, or .038% +’s/pers/week.
To compare, we must rescale the latter % for missed cases. 18/22
Avg +ive targeted PCR tests for NYC then was 461/8.4 mil/day, or .038% +’s/pers/week.
To compare, we must rescale the latter % for missed cases. 18/22
In the UK that week, that rescale factor was .79%/.17% = 4.6. For NYC, that gives .038% x 4.6=.17%.
But UK has higher infection and only tests symptomatic. NYC tests anyone who wants, for free. So NYC likely <.17%. Just hard to guess how much less. NYC schools were .17%. 19/22
But UK has higher infection and only tests symptomatic. NYC tests anyone who wants, for free. So NYC likely <.17%. Just hard to guess how much less. NYC schools were .17%. 19/22
Back to @apoorva_nyc’s article.
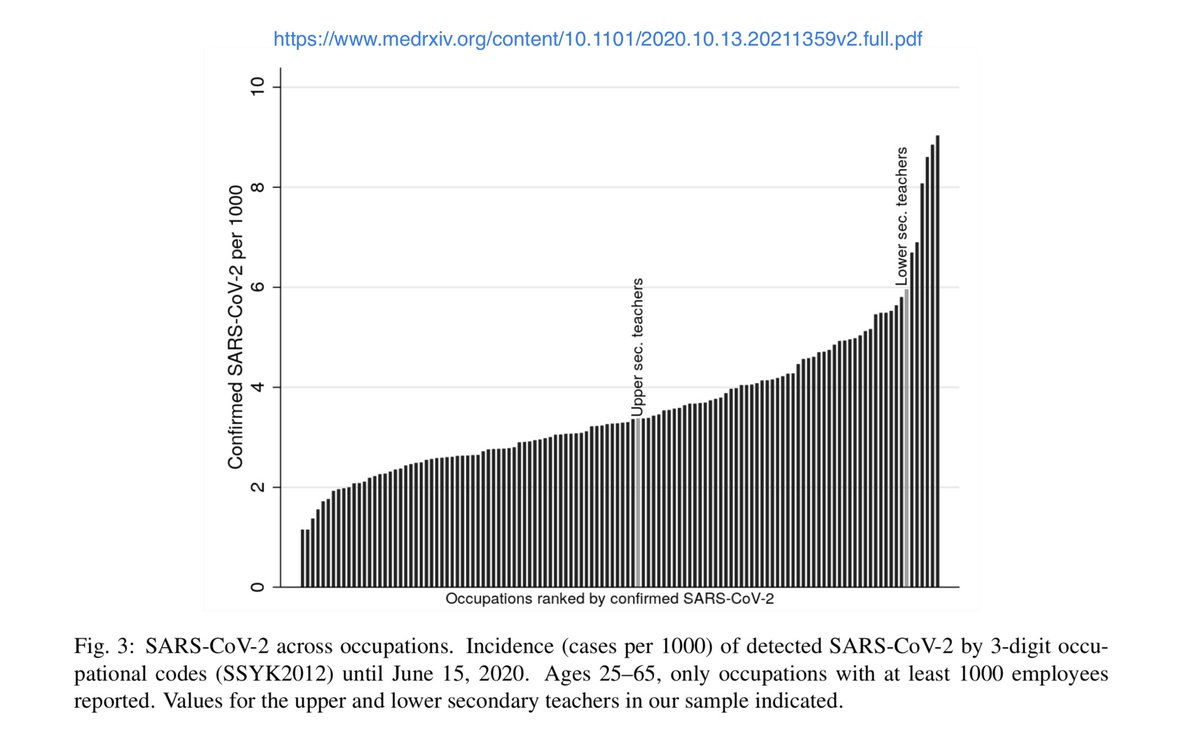
It made some great points, like how in Sweden, upper secondary schools closed in spring, and those remote teachers had median levels of infection. But teachers for lower secondaries (all in-person) were among the most-infected professions. 20/22
It made some great points, like how in Sweden, upper secondary schools closed in spring, and those remote teachers had median levels of infection. But teachers for lower secondaries (all in-person) were among the most-infected professions. 20/22
On the flip side, Boston recently stopped in-person schooling even for severely-disabled and highly socially vulnerable children.
That’s utterly ridiculous.
Surely they can find enough high-quality PPE and ventilated space to teach this tiny group.
https://www.boston.com/news/education/2020/10/21/boston-public-schools-suspending-all-in-person-learning">https://www.boston.com/news/educ... 21/22
That’s utterly ridiculous.
Surely they can find enough high-quality PPE and ventilated space to teach this tiny group.
https://www.boston.com/news/education/2020/10/21/boston-public-schools-suspending-all-in-person-learning">https://www.boston.com/news/educ... 21/22
This isn’t some all-or-nothing tug-of-war with winners and losers.
This is a world of communities with different infection levels, different cultures, different resources, and different individual needs.
Getting the balance right is hard.
It will take the best we can do. 22/22
This is a world of communities with different infection levels, different cultures, different resources, and different individual needs.
Getting the balance right is hard.
It will take the best we can do. 22/22

 Read on Twitter
 for secondary-school and https://abs.twimg.com/emoji/v2/... draggable="false" alt="⬇️" title="Pfeil nach unten" aria-label="Emoji: Pfeil nach unten"> for primary-school and a few other groups. 3/22" title="UK schools opened at start of September. No remote school, even for families with medical vulnerability. No temporary home schooling either.The article’s linked UK govt webpage shows Sept infection https://abs.twimg.com/emoji/v2/... draggable="false" alt="⬆️" title="Pfeil nach oben" aria-label="Emoji: Pfeil nach oben"> for secondary-school and https://abs.twimg.com/emoji/v2/... draggable="false" alt="⬇️" title="Pfeil nach unten" aria-label="Emoji: Pfeil nach unten"> for primary-school and a few other groups. 3/22" class="img-responsive" style="max-width:100%;"/>
