
 Read on Twitter
Weekly round up of useful / reliable English covid statistics:
1. Incidence
2. Care home outbreaks / admissions
3. Hospital / ICU admissions and deaths
4. Covid triage
5. Cases
6. Contact tracing
7. Mortality
8. ICU profile: ICNARC
#ahcveng
1. Incidence
2. Care home outbreaks / admissions
3. Hospital / ICU admissions and deaths
4. Covid triage
5. Cases
6. Contact tracing
7. Mortality
8. ICU profile: ICNARC
#ahcveng
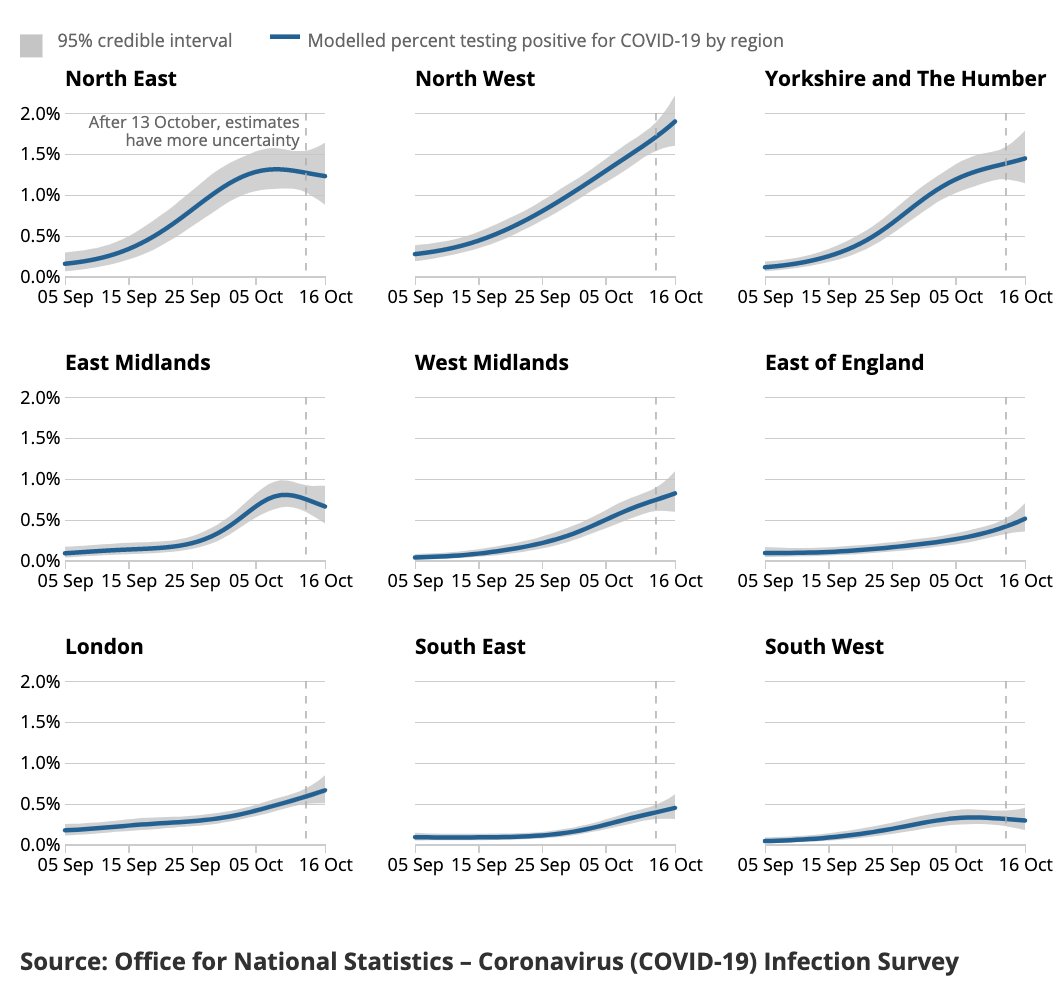
1. Incidence
ONS: Incidence now up to 35k per day, 0.9% overall; huge variance regionally and by age group, with young getting infected *much* faster than old (good news), and this is backed up by Zoe (KCL/CSS) data: ( https://twitter.com/timspector/status/1319191642910457857?s=20)
https://twitter.com/timspecto... href=" #age-analysis-of-the-number-of-people-in-england-who-had-covid-19">https://www.ons.gov.uk/peoplepopulationandcommunity/healthandsocialcare/conditionsanddiseases/bulletins/coronaviruscovid19infectionsurveypilot/23october2020 #age-analysis-of-the-number-of-people-in-england-who-had-covid-19">https://www.ons.gov.uk/peoplepop...
ONS: Incidence now up to 35k per day, 0.9% overall; huge variance regionally and by age group, with young getting infected *much* faster than old (good news), and this is backed up by Zoe (KCL/CSS) data: ( https://twitter.com/timspector/status/1319191642910457857?s=20)
 https://www.ons.gov.uk/peoplepop..." title="1. IncidenceONS: Incidence now up to 35k per day, 0.9% overall; huge variance regionally and by age group, with young getting infected *much* faster than old (good news), and this is backed up by Zoe (KCL/CSS) data: ( https://twitter.com/timspecto... href=" https://www.ons.gov.uk/peoplepopulationandcommunity/healthandsocialcare/conditionsanddiseases/bulletins/coronaviruscovid19infectionsurveypilot/23october2020 #age-analysis-of-the-number-of-people-in-england-who-had-covid-19">https://www.ons.gov.uk/peoplepop...">
 https://www.ons.gov.uk/peoplepop..." title="1. IncidenceONS: Incidence now up to 35k per day, 0.9% overall; huge variance regionally and by age group, with young getting infected *much* faster than old (good news), and this is backed up by Zoe (KCL/CSS) data: ( https://twitter.com/timspecto... href=" https://www.ons.gov.uk/peoplepopulationandcommunity/healthandsocialcare/conditionsanddiseases/bulletins/coronaviruscovid19infectionsurveypilot/23october2020 #age-analysis-of-the-number-of-people-in-england-who-had-covid-19">https://www.ons.gov.uk/peoplepop...">
 https://www.ons.gov.uk/peoplepop..." title="1. IncidenceONS: Incidence now up to 35k per day, 0.9% overall; huge variance regionally and by age group, with young getting infected *much* faster than old (good news), and this is backed up by Zoe (KCL/CSS) data: ( https://twitter.com/timspecto... href=" https://www.ons.gov.uk/peoplepopulationandcommunity/healthandsocialcare/conditionsanddiseases/bulletins/coronaviruscovid19infectionsurveypilot/23october2020 #age-analysis-of-the-number-of-people-in-england-who-had-covid-19">https://www.ons.gov.uk/peoplepop...">
 https://www.ons.gov.uk/peoplepop..." title="1. IncidenceONS: Incidence now up to 35k per day, 0.9% overall; huge variance regionally and by age group, with young getting infected *much* faster than old (good news), and this is backed up by Zoe (KCL/CSS) data: ( https://twitter.com/timspecto... href=" https://www.ons.gov.uk/peoplepopulationandcommunity/healthandsocialcare/conditionsanddiseases/bulletins/coronaviruscovid19infectionsurveypilot/23october2020 #age-analysis-of-the-number-of-people-in-england-who-had-covid-19">https://www.ons.gov.uk/peoplepop...">
2. Care home outbreaks / admissions
Care home outbreaks flat; still 3% of outbreaks. But admissions from care homes rising (so size of each outbreak bigger?)
*If* our interventions work, why are admissions from care homes growing at the same pace as elsewhere? https://abs.twimg.com/emoji/v2/... draggable="false" alt="🤔" title="Denkendes Gesicht" aria-label="Emoji: Denkendes Gesicht">
Care home outbreaks flat; still 3% of outbreaks. But admissions from care homes rising (so size of each outbreak bigger?)
*If* our interventions work, why are admissions from care homes growing at the same pace as elsewhere?
 " title="2. Care home outbreaks / admissionsCare home outbreaks flat; still 3% of outbreaks. But admissions from care homes rising (so size of each outbreak bigger?)*If* our interventions work, why are admissions from care homes growing at the same pace as elsewhere? https://abs.twimg.com/emoji/v2/... draggable="false" alt="🤔" title="Denkendes Gesicht" aria-label="Emoji: Denkendes Gesicht">">
 " title="2. Care home outbreaks / admissionsCare home outbreaks flat; still 3% of outbreaks. But admissions from care homes rising (so size of each outbreak bigger?)*If* our interventions work, why are admissions from care homes growing at the same pace as elsewhere? https://abs.twimg.com/emoji/v2/... draggable="false" alt="🤔" title="Denkendes Gesicht" aria-label="Emoji: Denkendes Gesicht">">
 " title="2. Care home outbreaks / admissionsCare home outbreaks flat; still 3% of outbreaks. But admissions from care homes rising (so size of each outbreak bigger?)*If* our interventions work, why are admissions from care homes growing at the same pace as elsewhere? https://abs.twimg.com/emoji/v2/... draggable="false" alt="🤔" title="Denkendes Gesicht" aria-label="Emoji: Denkendes Gesicht">">
3. Hospital admissions, ICU / hospital occupancy and hospital deaths
Huge regional variation, and v. different to 1st wave (pattern & velocity)
")
")
")
")
Huge regional variation, and v. different to 1st wave (pattern & velocity)
4. Covid triage
Key >70 data still not pointing to an incoming spike of hospital admissions.
Overall levels subsiding following back-to-school/college/uni spikes in younger age groups.
Data: https://digital.nhs.uk/data-and-information/publications/statistical/mi-potential-covid-19-symptoms-reported-through-nhs-pathways-and-111-online/latest">https://digital.nhs.uk/data-and-...
5. Cases
With change in season, every time cases look to have stabilised they kick up again: https://coronavirus.data.gov.uk/cases?areaType=nation&areaName=England
See">https://coronavirus.data.gov.uk/cases... surveillance report for region/age variation: https://assets.publishing.service.gov.uk/government/uploads/system/uploads/attachment_data/file/928766/Weekly_Flu_and_COVID-19_report_w43_FINAL.pdf
For">https://assets.publishing.service.gov.uk/governmen... granular data I recommend following these charts: https://twitter.com/RP131/status/1320033961251393537?s=20">https://twitter.com/RP131/sta...
6. Contact tracing
I& #39;m currently isolating, my thoughts on the experience as a punter here!: https://twitter.com/AlistairHaimes/status/1319954284268617728?s=20
The">https://twitter.com/AlistairH... summary: it& #39;s farcical.
Contact tracing is better left to the patient, the infrastructure could swivel to cluster tracing: https://www.theatlantic.com/health/archive/2020/09/k-overlooked-variable-driving-pandemic/616548/">https://www.theatlantic.com/health/ar...
7. Mortality
*Currently* no excess mortality in 2nd wave, according to ONS (mortality year-to-date at 2009 levels) and PHE.
Deaths in 2020 are as far above trend as 2019 was below: "dry tinder" (sorry). Chart from
https://twitter.com/ActuaryByDay/status/1319678543073300480
https://twitter.com/ActuaryBy... href=" #death-occurrences-in-september-2020-and-year-to-date">https://www.ons.gov.uk/peoplepopulationandcommunity/birthsdeathsandmarriages/deaths/bulletins/monthlymortalityanalysisenglandandwales/september2020 #death-occurrences-in-september-2020-and-year-to-date">https://www.ons.gov.uk/peoplepop...
*Currently* no excess mortality in 2nd wave, according to ONS (mortality year-to-date at 2009 levels) and PHE.
Deaths in 2020 are as far above trend as 2019 was below: "dry tinder" (sorry). Chart from
https://twitter.com/ActuaryByDay/status/1319678543073300480
 https://www.ons.gov.uk/peoplepop..." title="7. Mortality*Currently* no excess mortality in 2nd wave, according to ONS (mortality year-to-date at 2009 levels) and PHE.Deaths in 2020 are as far above trend as 2019 was below: "dry tinder" (sorry). Chart from https://twitter.com/ActuaryBy... href=" https://www.ons.gov.uk/peoplepopulationandcommunity/birthsdeathsandmarriages/deaths/bulletins/monthlymortalityanalysisenglandandwales/september2020 #death-occurrences-in-september-2020-and-year-to-date">https://www.ons.gov.uk/peoplepop...">
 https://www.ons.gov.uk/peoplepop..." title="7. Mortality*Currently* no excess mortality in 2nd wave, according to ONS (mortality year-to-date at 2009 levels) and PHE.Deaths in 2020 are as far above trend as 2019 was below: "dry tinder" (sorry). Chart from https://twitter.com/ActuaryBy... href=" https://www.ons.gov.uk/peoplepopulationandcommunity/birthsdeathsandmarriages/deaths/bulletins/monthlymortalityanalysisenglandandwales/september2020 #death-occurrences-in-september-2020-and-year-to-date">https://www.ons.gov.uk/peoplepop...">
 https://www.ons.gov.uk/peoplepop..." title="7. Mortality*Currently* no excess mortality in 2nd wave, according to ONS (mortality year-to-date at 2009 levels) and PHE.Deaths in 2020 are as far above trend as 2019 was below: "dry tinder" (sorry). Chart from https://twitter.com/ActuaryBy... href=" https://www.ons.gov.uk/peoplepopulationandcommunity/birthsdeathsandmarriages/deaths/bulletins/monthlymortalityanalysisenglandandwales/september2020 #death-occurrences-in-september-2020-and-year-to-date">https://www.ons.gov.uk/peoplepop...">
 https://www.ons.gov.uk/peoplepop..." title="7. Mortality*Currently* no excess mortality in 2nd wave, according to ONS (mortality year-to-date at 2009 levels) and PHE.Deaths in 2020 are as far above trend as 2019 was below: "dry tinder" (sorry). Chart from https://twitter.com/ActuaryBy... href=" https://www.ons.gov.uk/peoplepopulationandcommunity/birthsdeathsandmarriages/deaths/bulletins/monthlymortalityanalysisenglandandwales/september2020 #death-occurrences-in-september-2020-and-year-to-date">https://www.ons.gov.uk/peoplepop...">
Chris Whitty ( @CMO_England) was clear from the start that excess deaths are *the* key metric.
If so, the difference 1st to 2nd wave is stark. In fact, 2nd wave isn& #39;t showing up in excess deaths (yet).
(Data: https://assets.publishing.service.gov.uk/government/uploads/system/uploads/attachment_data/file/928752/Weekly_Influenza_and_COVID19_report_data_W43.xlsx)">https://assets.publishing.service.gov.uk/governmen...
 was clear from the start that excess deaths are *the* key metric.If so, the difference 1st to 2nd wave is stark. In fact, 2nd wave isn& #39;t showing up in excess deaths (yet).(Data: https://assets.publishing.service.gov.uk/governmen...")
If so, the difference 1st to 2nd wave is stark. In fact, 2nd wave isn& #39;t showing up in excess deaths (yet).
(Data: https://assets.publishing.service.gov.uk/government/uploads/system/uploads/attachment_data/file/928752/Weekly_Influenza_and_COVID19_report_data_W43.xlsx)">https://assets.publishing.service.gov.uk/governmen...
8. ICU profile: ICNARC
Update to @ICNARC report on ICU: https://www.icnarc.org/Our-Audit/Audits/Cmp/Reports
2nd">https://www.icnarc.org/Our-Audit... wave VERY different: trajectory, geography (London immunity), treatment & outcomes (drugs + ventilation protocol =https://abs.twimg.com/emoji/v2/... draggable="false" alt="🔼" title="Nach oben zeigendes Dreieck" aria-label="Emoji: Nach oben zeigendes Dreieck"> survival, shorter stay)
Slower admissions + shorter stay = more capacity.
Update to @ICNARC report on ICU: https://www.icnarc.org/Our-Audit/Audits/Cmp/Reports
2nd">https://www.icnarc.org/Our-Audit... wave VERY different: trajectory, geography (London immunity), treatment & outcomes (drugs + ventilation protocol =
Slower admissions + shorter stay = more capacity.
 survival, shorter stay)Slower admissions + shorter stay = more capacity." title="8. ICU profile: ICNARCUpdate to @ICNARC report on ICU: https://www.icnarc.org/Our-Audit... wave VERY different: trajectory, geography (London immunity), treatment & outcomes (drugs + ventilation protocol = https://abs.twimg.com/emoji/v2/... draggable="false" alt="🔼" title="Nach oben zeigendes Dreieck" aria-label="Emoji: Nach oben zeigendes Dreieck"> survival, shorter stay)Slower admissions + shorter stay = more capacity.">
 survival, shorter stay)Slower admissions + shorter stay = more capacity." title="8. ICU profile: ICNARCUpdate to @ICNARC report on ICU: https://www.icnarc.org/Our-Audit... wave VERY different: trajectory, geography (London immunity), treatment & outcomes (drugs + ventilation protocol = https://abs.twimg.com/emoji/v2/... draggable="false" alt="🔼" title="Nach oben zeigendes Dreieck" aria-label="Emoji: Nach oben zeigendes Dreieck"> survival, shorter stay)Slower admissions + shorter stay = more capacity.">
 survival, shorter stay)Slower admissions + shorter stay = more capacity." title="8. ICU profile: ICNARCUpdate to @ICNARC report on ICU: https://www.icnarc.org/Our-Audit... wave VERY different: trajectory, geography (London immunity), treatment & outcomes (drugs + ventilation protocol = https://abs.twimg.com/emoji/v2/... draggable="false" alt="🔼" title="Nach oben zeigendes Dreieck" aria-label="Emoji: Nach oben zeigendes Dreieck"> survival, shorter stay)Slower admissions + shorter stay = more capacity.">
 survival, shorter stay)Slower admissions + shorter stay = more capacity." title="8. ICU profile: ICNARCUpdate to @ICNARC report on ICU: https://www.icnarc.org/Our-Audit... wave VERY different: trajectory, geography (London immunity), treatment & outcomes (drugs + ventilation protocol = https://abs.twimg.com/emoji/v2/... draggable="false" alt="🔼" title="Nach oben zeigendes Dreieck" aria-label="Emoji: Nach oben zeigendes Dreieck"> survival, shorter stay)Slower admissions + shorter stay = more capacity.">


