I think the below modelling output provides a useful illustration of how to evaluate forecasts. A short thread... 1/ https://twitter.com/globalhlthtwit/status/1303011885348990976?s=20">https://twitter.com/globalhlt...
First, let& #39;s be clear about difference between a & #39;scenario& #39; and & #39;forecast& #39;. Scenarios explore specific & #39;what if& #39; questions, e.g. & #39;What if we don& #39;t introduce any control measures?& #39; - Below are some examples from the March Imperial UK modelling report ( https://www.imperial.ac.uk/mrc-global-infectious-disease-analysis/covid-19/report-9-impact-of-npis-on-covid-19/).">https://www.imperial.ac.uk/mrc-globa... 2/
In contrast, epidemic forecasts provide an answer to the question & #39;What do we think is most likely to happen?& #39; More on scenarios vs forecasts here: https://www.washingtonpost.com/outlook/2020/09/15/scientists-want-predict-covid-19s-long-term-trajectory-heres-why-they-cant/">https://www.washingtonpost.com/outlook/2... 3/
The authors of the above & #39;24-37 deaths at peak& #39; model have previous referred to it having predictive accuracy ( https://blogs.bmj.com/bmj/2020/09/24/karl-friston-how-should-we-respond-to-an-upsurge-in-covid-19-cases/),">https://blogs.bmj.com/bmj/2020/... so I think it& #39;s fair to judge it accordingly. There are three main metrics we can use to do so... 4/
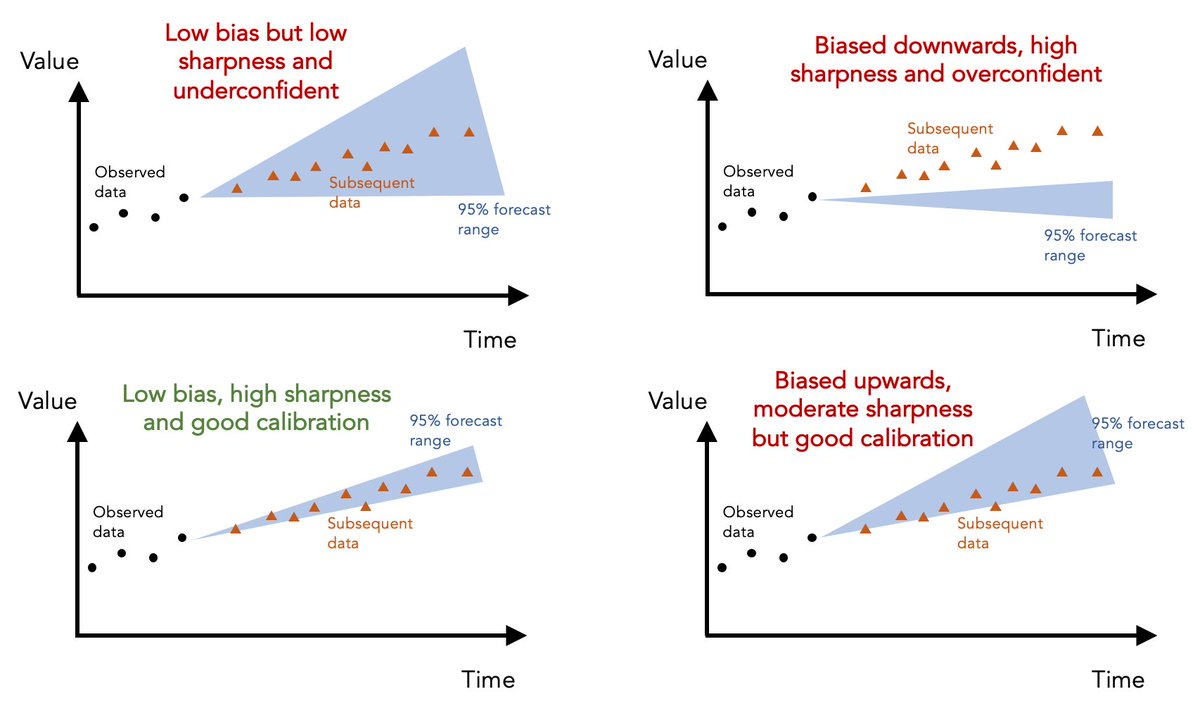
First, & #39;calibration& #39; measures ability of model to correctly identify its own uncertainty in making predictions. Basically, is it under- or overconfident? E.g. if model says particular range of values is & #39;95% likely& #39;, we& #39;d expect 95% of subsequent data to fall within this range 5/
Given 7 day average for daily deaths in UK has fallen outside above model& #39;s 95% prediction range of 24-37 for several weeks, it& #39;s clear that the above model was overconfident in its predictions... 6/
The second metric is & #39;sharpness& #39;, i.e. the ability of model to generate predictions within narrow range of possible outcomes. Basically, a model that says & #39;value will be between 0 and 10000& #39; isn& #39;t as useful as a well-calibrated model that can generate more precise predictions. 7/
The above model makes & #39;sharp& #39; predictions (i.e. within a narrow range) but the lack of calibration suggests this sharpness is coming at the expense of insufficient uncertainty. 8/
The third metric is & #39;bias& #39; - is the model systematically over- or underpredicting the true values? In this case, above model seems biased downwards, generating predictions that routinely fall below the subsequent data. 9/
Although I& #39;ve used above model as an illustrative example, the same ideas can be applied to any epidemic forecast. Here are some examples of different hypothetical forecasts and how they perform on these different metrics... 10/
If you& #39;re interested in reading more about forecast evaluation, here& #39;s a paper we published on these issues last year: https://journals.plos.org/ploscompbiol/article?id=10.1371/journal.pcbi.1006785.">https://journals.plos.org/ploscompb... And a nice review with more technical details: https://www.annualreviews.org/doi/10.1146/annurev-statistics-062713-085831">https://www.annualreviews.org/doi/10.11... 11/11

 Read on Twitter


