After last week’s thread on efficacy stopping in RCT’s explaining that i) trials that stop early for efficacy tend to slightly overestimate treatment effect but ii) this does not mean any given trial that stopped early for efficacy is “more likely to be a false positive” result…
...I had an inclination to do some similar simulations from a fully Bayesian trial design perspective. I’ll put enough detail here that it’s not strictly necessary to read the previous thread, but first you might consider reading this for some background: https://twitter.com/ADAlthousePhD/status/1317085928171708417?s=20">https://twitter.com/ADAlthous...
Also note the same disclaimer as last week’s thread: a) I’m not the world’s leading expert on this topic (though I know some that are closer & encourage them to comment…) and b) people should feel free expand on select points if they’re inclined.
I’ll use the same basic parameters as last week’s example: trial that plans to recruit max N=1000, with 40% mortality in control group, suppose that intervention reduces risk of mortality to 30% (therefore the “true” treatment effect is about OR=0.65).
Today, I will present results for both a frequentist and Bayesian approach (using a Normal(0,1) prior on the log OR for the Bayesian analyses).
Remember, the frequentist interim analyses are “for illustration only” (you wouldn’t actually be testing every 100 patients). We will use an O’Brien Fleming approach with 1 efficacy test at 500 patients, stopping if p<0.0054 favoring treatment, otherwise proceeding to N=1000.
This is the same example I used last week, which showed that *in trials that stopped early for efficacy* the median OR was about 0.53 (ranging from 0.32 to about 0.59) in that run of simulations.
I am curious to see what the distribution of estimates looks like in fully Bayesian trials that stop early, since some claim that the prior automatically discounts estimates at all interim analyses and thereby will not share this tendency to overestimate the treatment effect...
...if the trial stops early due to efficacy. I also know that some Bayesians will argue there is no such thing as “stopping early” – that fully Bayesian trials are designed to look until exactly the right amount of information is collected to answer the question – but…
...in the real world there& #39;s still usually going to be a "max N" specified even for trials that say they will continuously look until efficacy or futility threshold is crossed.
For the purposes of this example, suppose the max N (that the sponsor was willing to pay for, perhaps) is N=1000. We’ll look every 100 patients and stop if the posterior probability of a positive treatment effect: Pr(OR<1), is greater than 0.975 at that interim analysis.
Note: I am aware that the “frequentist vs Bayesian” comparison here is not using alpha-spending rules for a frequentist that really parallel this Bayesian design. A frequentist could, of course, also use an interim look every 100 patients and adjust thresholds accordingly
That’s pretty rare in practice (to do that many interims in a frequentist design), but you’re welcome to do your own tangent on this thread if you want this to be the case.
I am also aware that this Bayesian design is more permissive with respect to Type I Error than the frequentist design with overall alpha-level of 0.05 for the trial. I think that matters. Some argue that it doesn’t.
(If you’re curious, a Bayesian trial that looks every 100 patients, stopping at any interim analysis where Pr(OR<1)>=0.975 with a max N=1000 and event rate of 40% in both groups would conclude success about 8-9% of the time, if my simulations are correct)
That said, I was mostly curious to see what the numbers look like for the point estimate, as @f2harrell claims “the interim posterior mean/median/mode are automatically discounted if stop early for efficacy”
I wanted to check this claim by simulation to see the distribution of OR’s for trials that stop early for efficacy lands right on the “true” OR, or if it (like the frequentist approach) will tend to overestimate when stopping early for efficacy
Last couple of reminders before we get started about what I’ll be showing here.
Throughout this thread, I will show a series of plots of the odds ratio as it would be computed every 100 patients with known outcome data (shown on the y-axis). The number of patients included in each analysis will be shown on the x-axis.
For reference, I’ll draw a horizontal dashed line at OR=0.65, which is about the “true” effect for an intervention that changes outcomes from 40% mortality in control patients to 30% for patients that receive the intervention.
The horizontal line is the *actual* treatment effect. Simulated trials that end up with point estimates above the line are *underestimating* the true treatment effect; simulated trials that end up with point estimates below the line are *overestimating* the true treatment effect
In general, we would expect the point estimate(s) to converge on the blue line with more and more patients. If we could enroll an infinite number of patients with these characteristics, the point estimate would be 0.65.
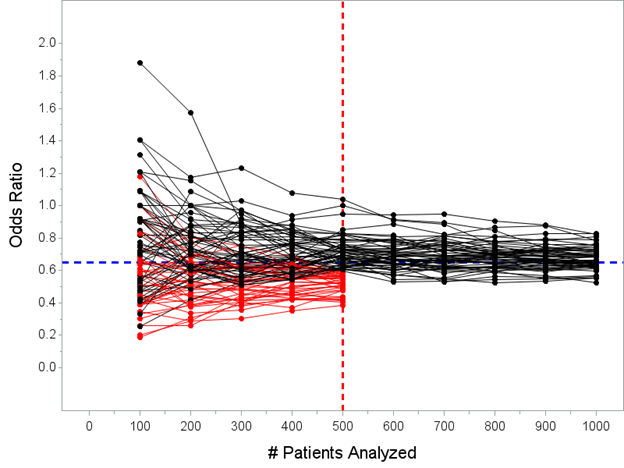
Frequentist result(s) first: here are 100 hypothetical trials described above, showing the OR computed every 100 patients until enrolling N=1000 unless efficacy threshold was crossed at N=500 interim. I’ve highlighted the trials that would stop at the N=500 analysis in red.
In today’s simulation, 40 of the 100 trials would have stopped early at the N=500 interim analysis. The median estimated OR for the 40 trials that stopped early for success under this decision rule is 0.53 with a range 0.32 to 0.59.
Remember, the *true* treatment effect in this example is OR=0.65, “proving” that “the point estimate from trials stopped early for efficacy will tend to overestimate the true treatment effect” is an accurate statement.
Again, this makes sense: we only allow trials that are particularly impressive to stop early, such that even if the data are presently overestimating the true treatment effect, it would be extremely unlikely to conclude that there is no effect if the trial proceeds to N=1000.
OK, now let’s go to the Bayesian side of things. Remember, the fully Bayesian trial will look every 100 patients and stop whenever Pr(OR<1) >= 0.975 up to a max N=1000.
Actually, first, I want to do a separate little test: instead of “every 100 patients” let’s first suppose that the Bayesian trial looks only once, at N=500, and stops if Prob(OR<1)>=0.975 at that look, otherwise it continues to N=1000.
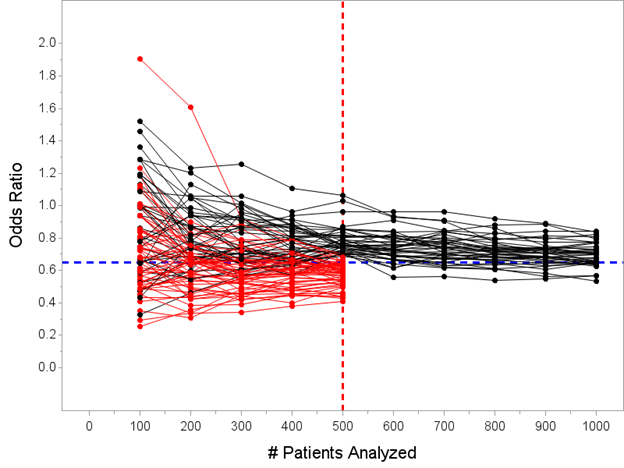
Here’s a plot of the posterior mean OR every 100 patients in this scenario. 59 of the 100 trials would stop at the N=500 interim under that decision rule.
The median of the posterior mean OR’s for the 59 trials that stopped early for success under this decision rule is 0.59 with a range 0.41 to 0.71.
Again, the *true* effect is OR=0.65, so the point estimate from trials stopped early for efficacy does still slightly overestimate the true treatment effect in Bayesian world, though the prior does reduce the degree to which this happens relative to the frequentist approach.
(Also note that using a prior with a smaller variance than my Normal(0,1) would shrink this further)
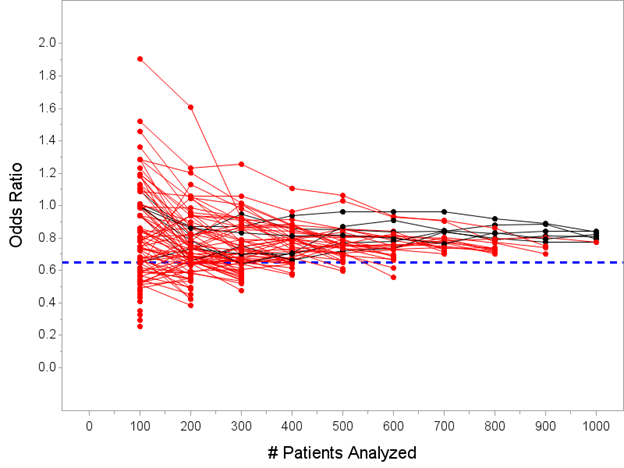
OK, now let’s look at the posterior mean OR using the “every 100 patients” approach instead of just one look at N=500. In that setting, 94 of the 100 studies would stop before reaching N=1000 and conclude efficacy.
Aside: I worry a bit that people will incorrectly interpret this last bit of information in a couple of ways, namely that Bayesian trials offer a huge advantage because they’re far more likely to declare efficacy faster.
That’s true(ish), but the specific scenario I’ve set up here is not a fair “Bayes-vs-frequentist” comparison because the frequentist design I floated is a very conservative about early looks while this particular Bayesian trial is fairly aggressive
(some would argue too aggressive given the increased Type I Error rate this design would have).
That’s why I also wanted to throw in the comparison between a frequentist estimate and a Bayesian estimate where both are only allowed to stop at N=500
That’s why I also wanted to throw in the comparison between a frequentist estimate and a Bayesian estimate where both are only allowed to stop at N=500
(one may also point out that the stopping rule of p<0.0054 for the frequentist versus Prob>0.975 for the Bayesian are not exactly equivalent, quit hassling me)
OK, anyways, here’s the plot of the posterior mean of the OR computed every 100 patients, with trials stopping if Pr(OR<1)>=0.975 at any interim.
The median estimated OR for the 94 trials that stopped for success before N=1000 under this decision rule is 0.61 with a range 0.25 to 0.77. Recall from above, the *true* effect is OR=0.65. Still looks like we are ever-so-slightly overestimating the true treatment effect…
Summing up: the main point I wanted to explore was the claim that the estimated treatment effect (posterior mean) in a Bayesian design is automatically discounted so it will not tend to overestimate the treatment effect when stopped for efficacy at an interim analysis
This seems…partly false? It’s true that the degree to which treatment effect is overestimated is a *bit less* (depends on strength of the prior) than it would be in the frequentist design, but it still looks like there’s a slight tendency to overestimate with early stopping?

 Read on Twitter


