Happy to present a new report (in Dutch), in which we estimate the capacity of households to finance renovation investments.
TLDR: financing constraints are unfortunately a huge barrier that cannot simply be solved by providing some more subsidies or free loans. (1/n)
TLDR: financing constraints are unfortunately a huge barrier that cannot simply be solved by providing some more subsidies or free loans. (1/n)
First, what is the challenge? We need to thoroughly renovate about 90% of existing buildings from top to bottom, to reach the current long-term policy goals for the buildings sector. (2/n)
Some people argue (mostly erroneously) that it& #39;s financially attractive for households (hh& #39;s) to make these investments, claiming that they pay for themselves through lower energy bills.
Even if this would be true, hh& #39;s need to be able to *finance* the investments (3/n)
Even if this would be true, hh& #39;s need to be able to *finance* the investments (3/n)
So the Q arises: to which degree can hh& #39;s finance the renovations necessary to upgrade their homes to the "2050-proof" lvl? Geotemporally, we only tried to answer this Q for hh& #39;s in Flanders, under current circumstances (not in a future with different policies in place) (4/n)
To answer the question, we need to know two things: (A) how much will the renovations cost and (B) what is the maximum amount of money that each hh could conceivably gather, by depleting their savings account and taking out the largest possible loan from the bank. (5/n)
For (A), we used a database of a few thousand home-owning hh& #39;s (which answered a questionnaire in 2018), describing their home in terms of its size, insulation, heating system, etc. etc.
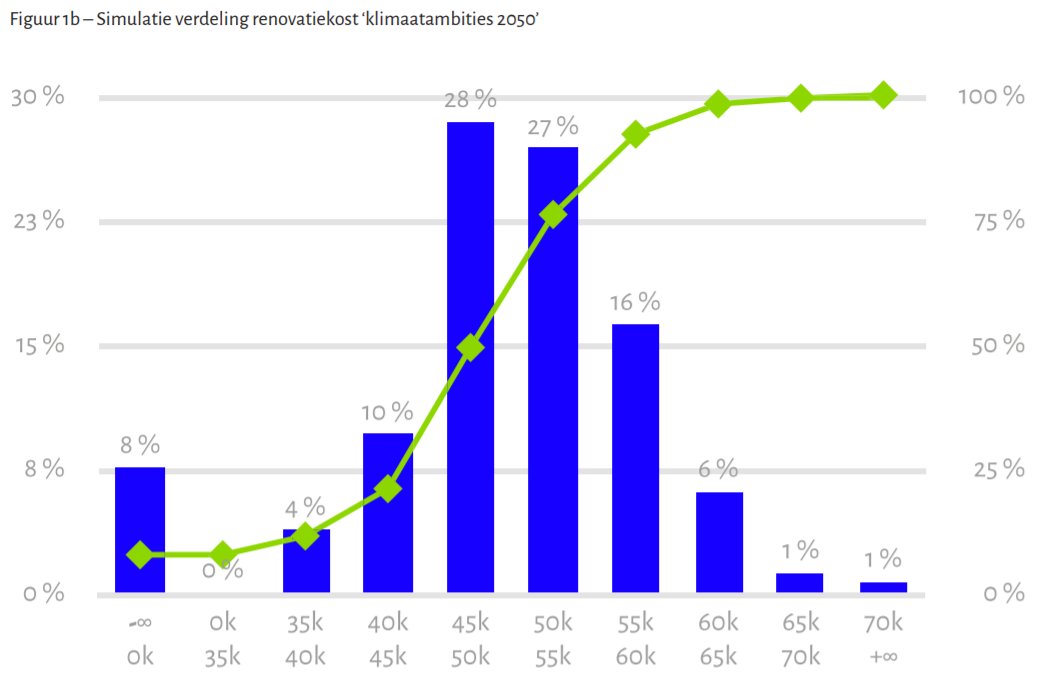
This allowed us to roughly estimate the following distribution of renovation costs. (6/n)
This allowed us to roughly estimate the following distribution of renovation costs. (6/n)
These numbers are conservative (i.e. they are probably too low). They reflect the most boring possible renovation: strictly doing what is necessary to adhere to the "2050 proof" energy lvl. In practice, hh& #39;s want to simultaneously make all kinds of changes to their homes. (7/n)
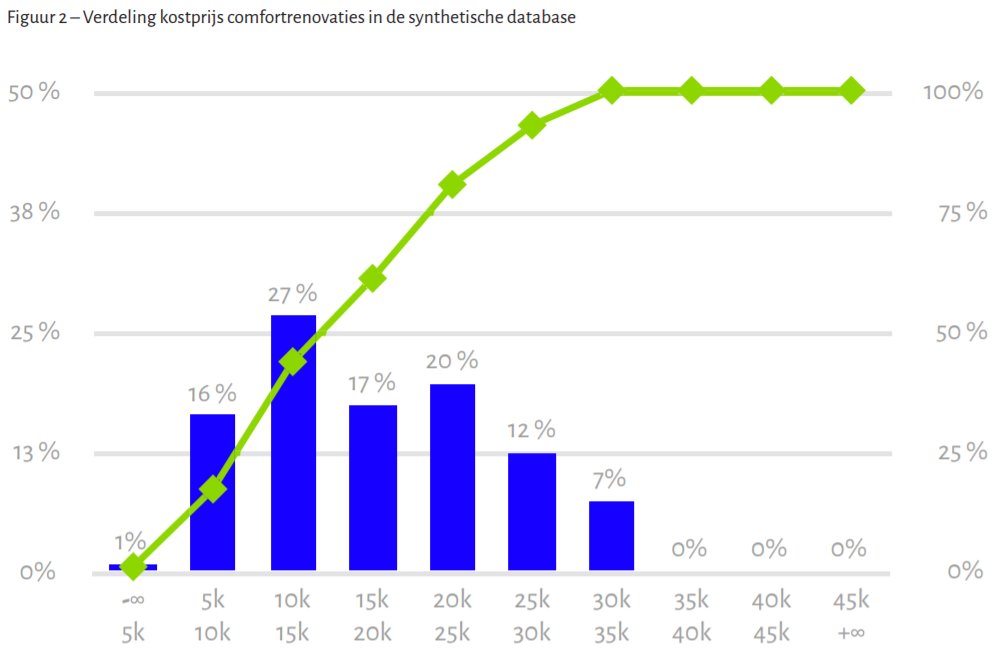
We try to take this into account by conceptualizing "comfort premiums", which add a certain amount on top of the "generic" renovation costs. The amount to be added differs from hh to hh, partially driven by what they can afford. Again, these numbers are conservative. (8/n)
Next up: (B), the maximum financing capacity of hh& #39;s. To estimate this, we used the database described before (which also includes info about each hh& #39;s income and their outstanding mortgages), and combined it with data from the ECB, about the financial wealth of hh& #39;s. (9/n)
The & #39;max financing capacity& #39; consists of the entirety of a hh& #39;s financial wealth (i.e. their savings accounts and other assets that can quickly be turned into cash), combined with the max amount that can be additionally loaned by the hh in question. (10/n)
If you already have a mortgage that you are paying off every month, this limits your ability to get an additional loan for renovation. In line with general standards, we assume that a hh is not allowed by the bank to pay off more than 30% of its income each month. (11/n)
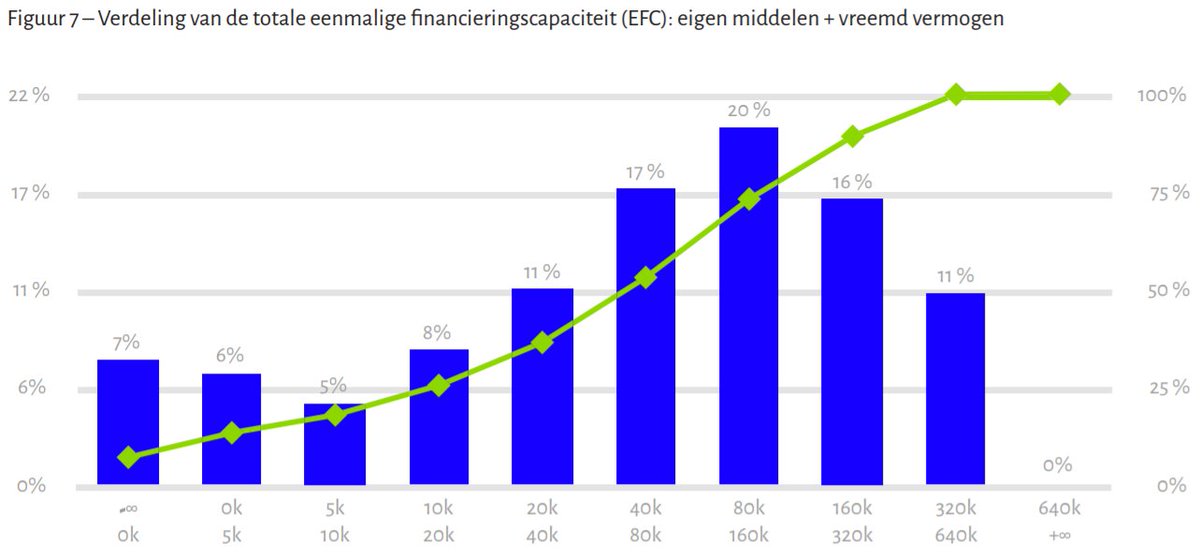
Eventually, we come up with the following distribution of max financing capacities across hh& #39;s. We see that a lot of homeowning hh& #39;s don& #39;t have a very large capacity to finance big investments. Negative capacities are the result of negative fin. wealth (i.e. hh& #39;s in debt). (12/n)
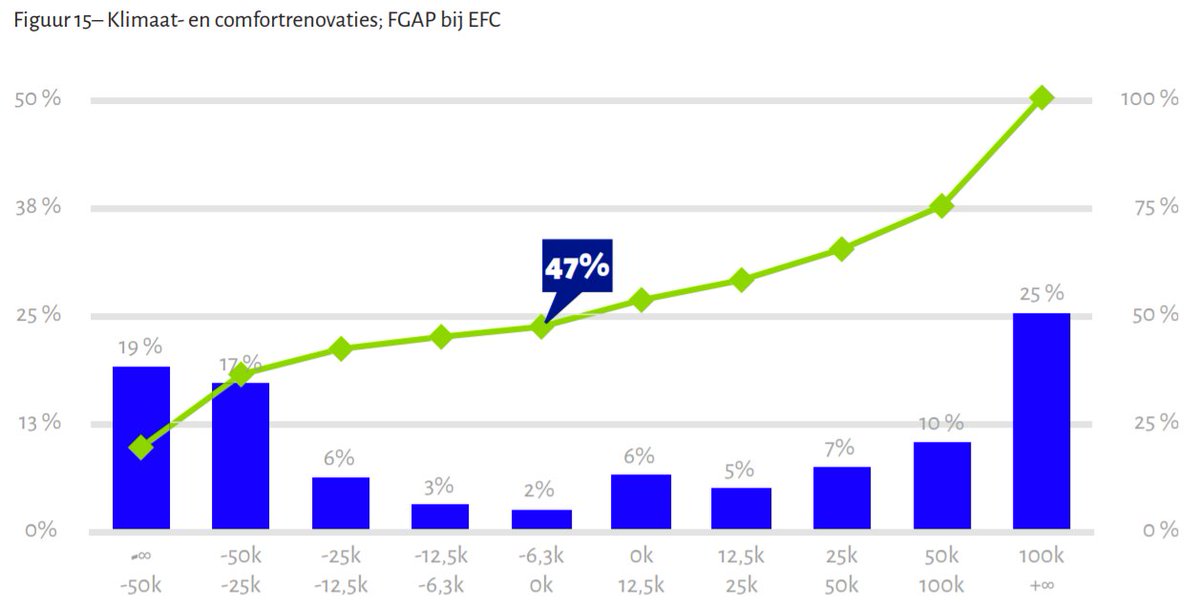
To finally answer our Q, we need to subtract (for every hh) the renovation cost from the maximum financing capacity. This results in the following distribution of "gaps" between what hh& #39;s can finance, and what they would need to finance to make their home 2050-proof. (13/n)
This graph shows that about 20% of hh& #39;s are over 50.000 euro& #39;s short to be able to finance a 2050-proof renovation. Another group of similar size has a gap of 25k to 50k. These are not the kind of numbers we can simply & #39;adjust for& #39; by throwing some subsidies at these hh& #39;s. (14/n)
And neither can we solve this problem by providing government-subsidized & #39;free loans& #39;, given the fact that hh& #39;s can only reasonably pay off +/- 30% of their income every month. That is a fundamental constraint, which doesn& #39;t go away by reducing interests on a loan. (15/n)
Thankfully, we also provide some slightly more positive messages in the report! Feel free to check it out here:
https://www.agoria.be/nl/Agoria-Elke-Vlaamse-woning-kan-tegen-2050-klimaatneutraal-zijn
(16/n)">https://www.agoria.be/nl/Agoria...
https://www.agoria.be/nl/Agoria-Elke-Vlaamse-woning-kan-tegen-2050-klimaatneutraal-zijn
(16/n)">https://www.agoria.be/nl/Agoria...
As a final note, it& #39;s worth mentioning that we also considered the financing capacities of hh& #39;s over time. Spreading the renov. in several steps and saving money to pay for each one. As shown in the report, this only makes the distribution of "gaps" look worse.
(the end, for now)
(the end, for now)
People who may be interested in this thread:
@MLiebreich @Sustainable2050 @RubenBaetens @AnnemieBollen @drvox @GlennReynders @dani_devo @M44R7EN @JMGlachant @janrosenow
Feel free to share.
Happy to receive constructive feedback.
No report is perfect, that& #39;s for sure.
@MLiebreich @Sustainable2050 @RubenBaetens @AnnemieBollen @drvox @GlennReynders @dani_devo @M44R7EN @JMGlachant @janrosenow
Feel free to share.
Happy to receive constructive feedback.
No report is perfect, that& #39;s for sure.

 Read on Twitter