"How Much Can We Generalize From Impact Evaluations" is out at JEEA!
Here& #39;s a thread with the key takeaways.... 1/ https://twitter.com/JEEA_News/status/1318780863912529920">https://twitter.com/JEEA_News...
Here& #39;s a thread with the key takeaways.... 1/ https://twitter.com/JEEA_News/status/1318780863912529920">https://twitter.com/JEEA_News...
Impact evaluations have taken off in development economics and other empirical fields. These evaluations can inform policy decisions. But how much do results generalize? In other words, if you find a large effect in one context, will it also apply to another? 2/
My paper estimates the generalizability of impact evaluation results for 20 different types of development program (e.g. cash transfers, deworming, etc.), using data from 635 studies (including both RCTs and non-RCTs, published and unpublished).
Here& #39;s what I find.... 3/
Here& #39;s what I find.... 3/
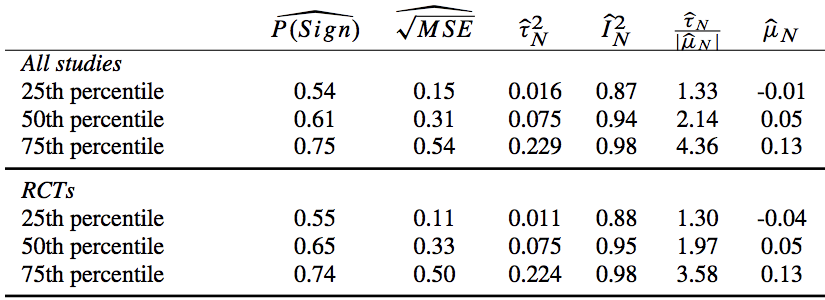
First, let& #39;s check out a part of the (dense) Table 6. This table is based on intervention-outcome combinations, e.g., conditional cash transfers - effects on school enrollment. Why intervention-outcome combinations? When you consider generalizability, the "set" is important. 4/
Within each intervention-outcome, I have a bunch of papers& #39; results, which I use to generate intervention-outcome-level measures. This table shows summary stats across the intervention-outcomes, e.g., the 50th percentile of a stat across intervention-outcomes in the data. 5/
Okay, now what are these stats? P(sign) gives the probability that a random-effects Bayesian hierarchical model (BHM) estimated using all the data within the set would correctly predict the sign of a randomly-selected true effect in that set. 6/
So, for a typical intervention-outcome combination, you& #39;d have a 61% chance of getting the sign right. 7/
Next, we have the square root of the MSE. This is a very policy-relevant variable, because it tells you how far off your BHM estimate is likely to be. But the magnitude of this measure will depend on the units of the outcome. I& #39;ll return to this. 8/
τ^2 also is a measure of the variance that depends on the units - in particular, it& #39;s a measure of the true unexplained heterogeneity across studies, after taking out sampling variance. 9/
I^2 is defined as that estimate of the true inter-study variance over total variance (i.e. τ^2/(τ^2+sampling variance)). So, it will always run from 0 to 1, and the lower I^2 is, the more sampling variance is responsible for results being far apart. 10/
In a way, if it were just that sampling variance were large, that would be a good problem to have. Because we know how to solve that problem: larger sample sizes.
Sadly, it turns out that sampling variance plays a very limited role in explaining variation in study results. 11/
Sadly, it turns out that sampling variance plays a very limited role in explaining variation in study results. 11/
The next column shows a coefficient of variation-like measure, using the BHM estimates. The coefficient of variation is actually defined as the sd over the mean, so what we have here should be a bit better because rather than the sd we& #39;re using τ, without sampling variance. 12/
The meta-analysis mean, μ, scales τ and makes it more interpretable. You can also do the same for the MSE, and if you do, the median ratio of the root-MSE to that mean is >2 across intervention-outcome combinations. 13/
In other words, I& #39;m sorry to say, if you are to use the BHM mean as your best guess, chances are you would be wildly off. 14/
But there& #39;s some good news, too.
First, a lot of people worry that RCTs produce less generalizable evidence, e.g. because they may be done only in certain contexts. I don& #39;t find any evidence of that. Here are the same stats for RCTs: 15/
First, a lot of people worry that RCTs produce less generalizable evidence, e.g. because they may be done only in certain contexts. I don& #39;t find any evidence of that. Here are the same stats for RCTs: 15/
And if you do an OLS regression, RCT results also don& #39;t pop out as having significantly larger or smaller effect sizes (of course, this is across many different intervention-outcome combinations). 16/
Second, you could think that sure, a random-effects BHM will be wildly off, but maybe a more complicated model will help. And it does seem to. There aren& #39;t many intervention-outcome combinations for which I have enough data for meta-regression, but - 17/
- if you were to take the single best-fitting explanatory variable and add that to your BHM to make it a mixed model, you can explain about 20% of the remaining variance, on average, or a median of about 10%. 18/
And you might expect that if you were to use micro data to build a richer model, you could do better than that. (<- paper idea for grad students) 19/

 Read on Twitter


