Do this research for work anyway, a thread might be useful.
Some* of the most valuable graphs/table/visualisations/reports checked or received when tracking #COVID19Ireland this week.
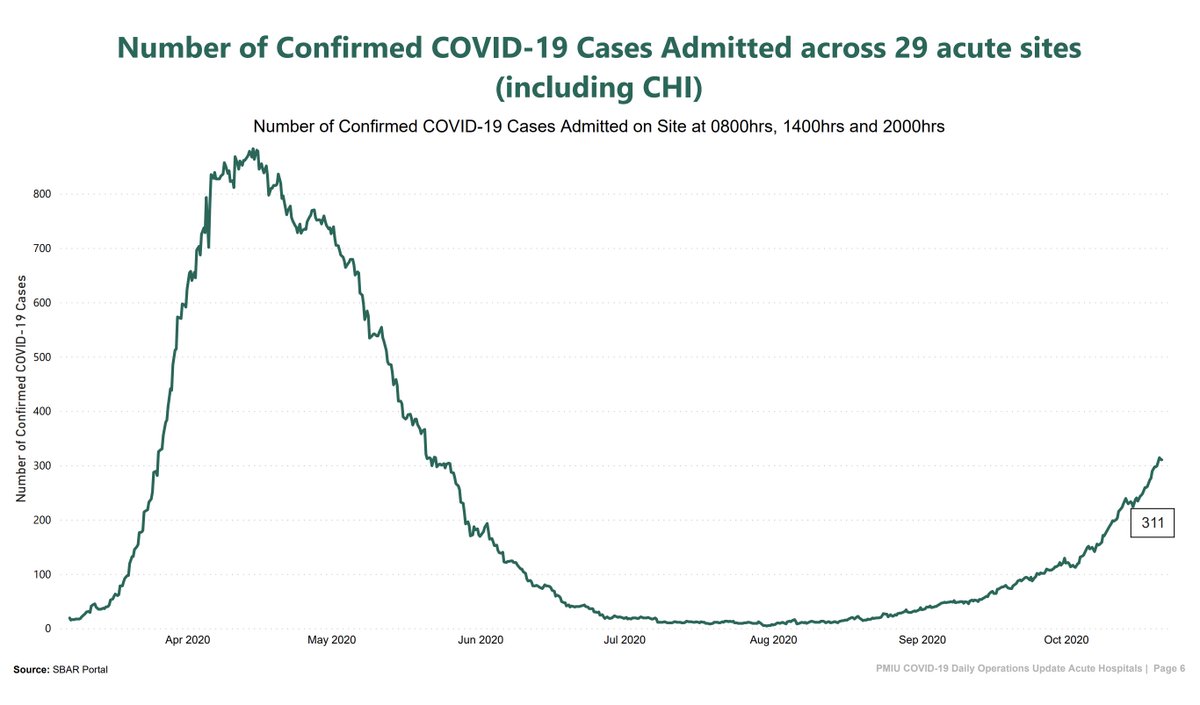
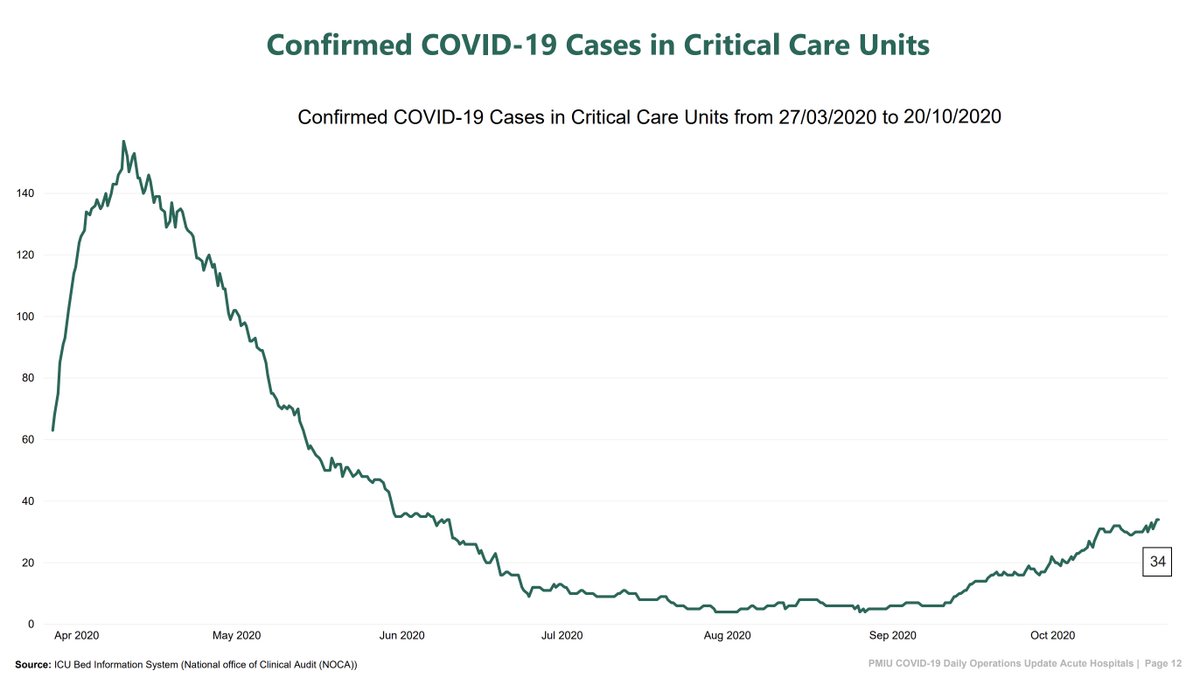
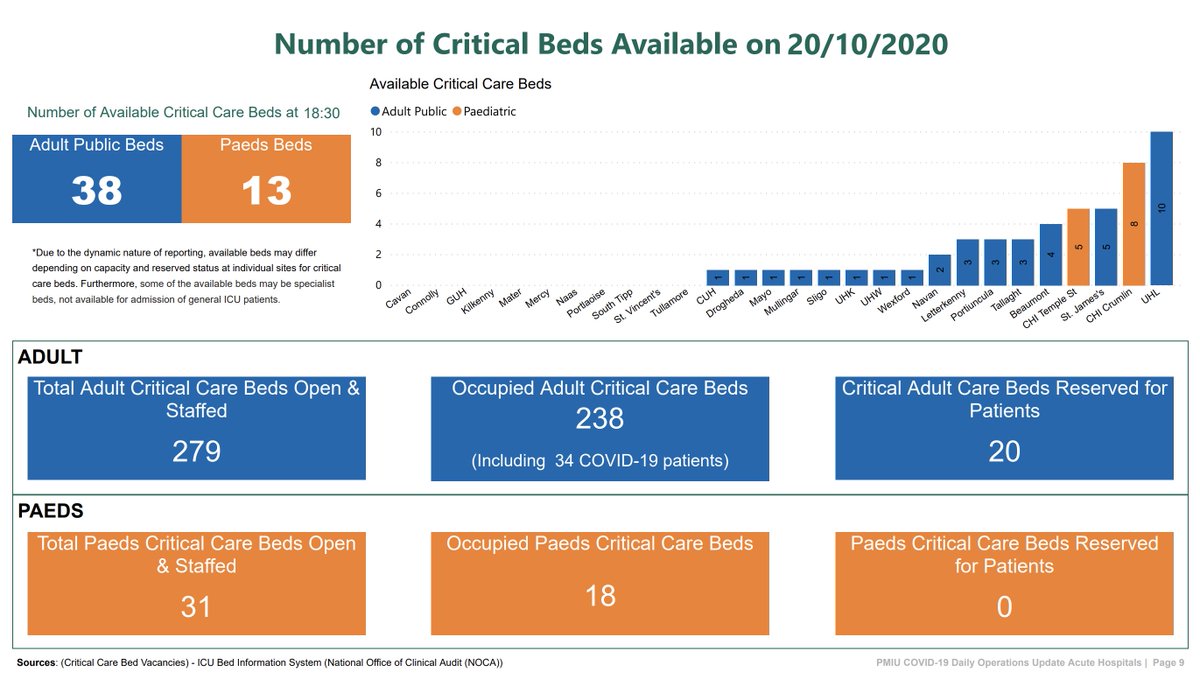
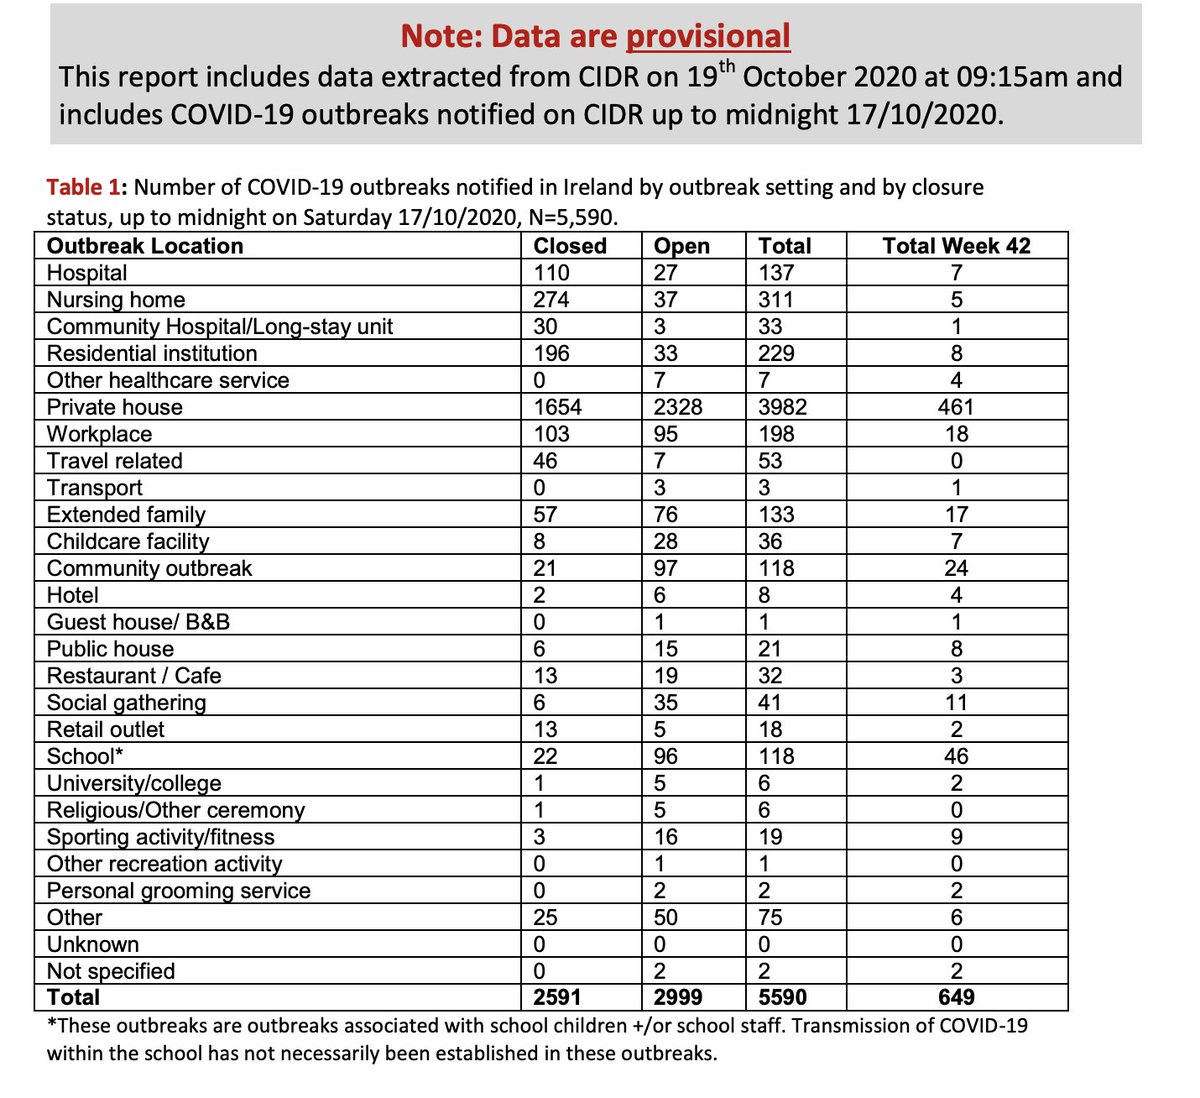
The HSE daily operations update, today& #39;s here in three key pages:
Some* of the most valuable graphs/table/visualisations/reports checked or received when tracking #COVID19Ireland this week.
The HSE daily operations update, today& #39;s here in three key pages:
HPSC daily report; cases as linked to occupation (& #39;unknown& #39; is increased on recent dates as cases may be assigned at a later date.) I& #39;ve asked the HPSC for the actual data underpinning this display, am told staff are smashed but working on it.
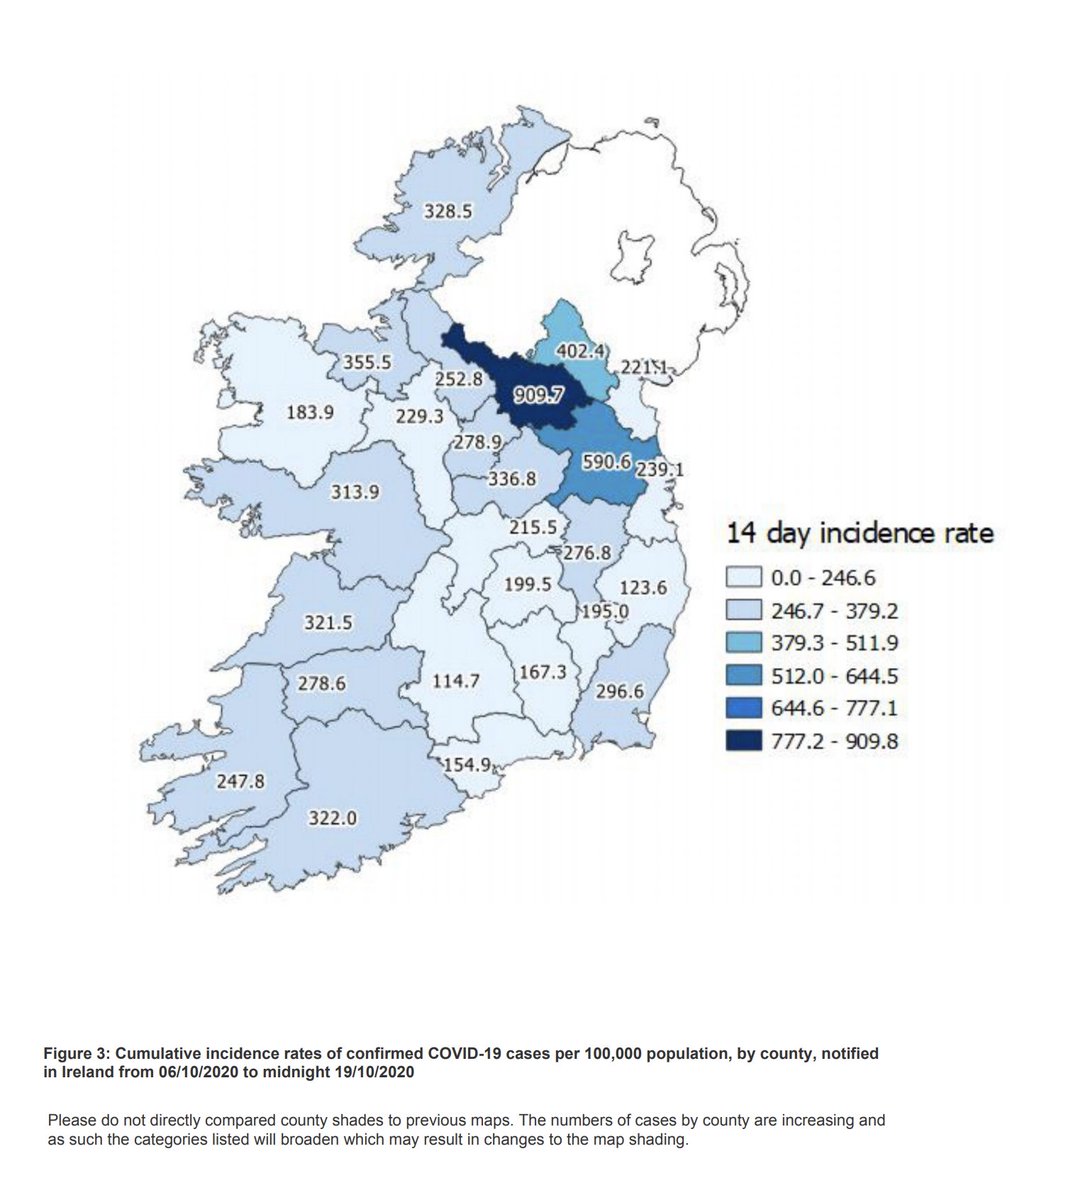
Also county 14-day incidence rates.
Also county 14-day incidence rates.
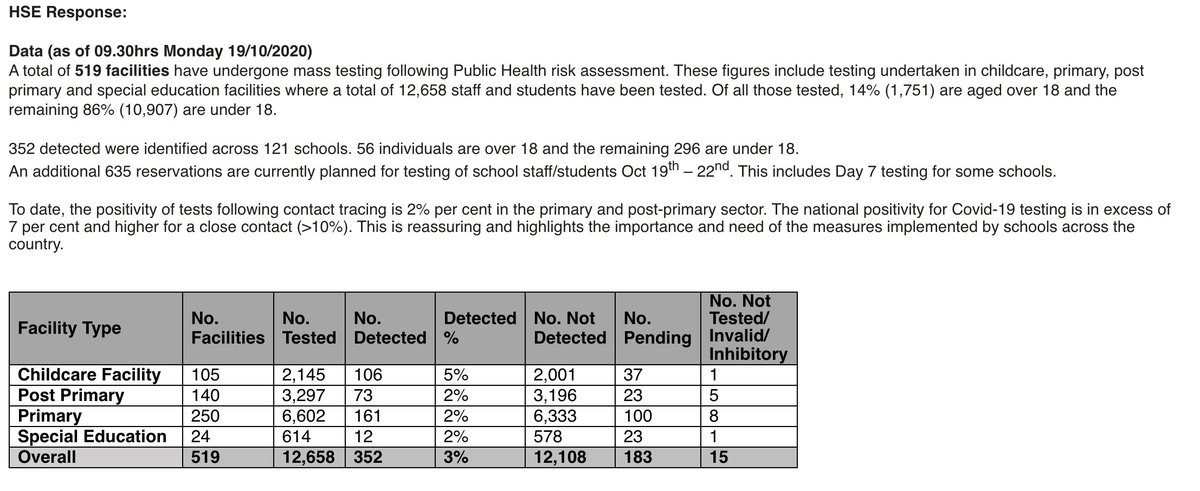
HSE table + statement provided in response to a query submitted about schools testing. Dep CMO Heather Burns said later at the briefing yesterday the exact schools positivity rate is 2.8%. I& #39;ve been asking for more clarification on it. Hopefully see a response soon too.
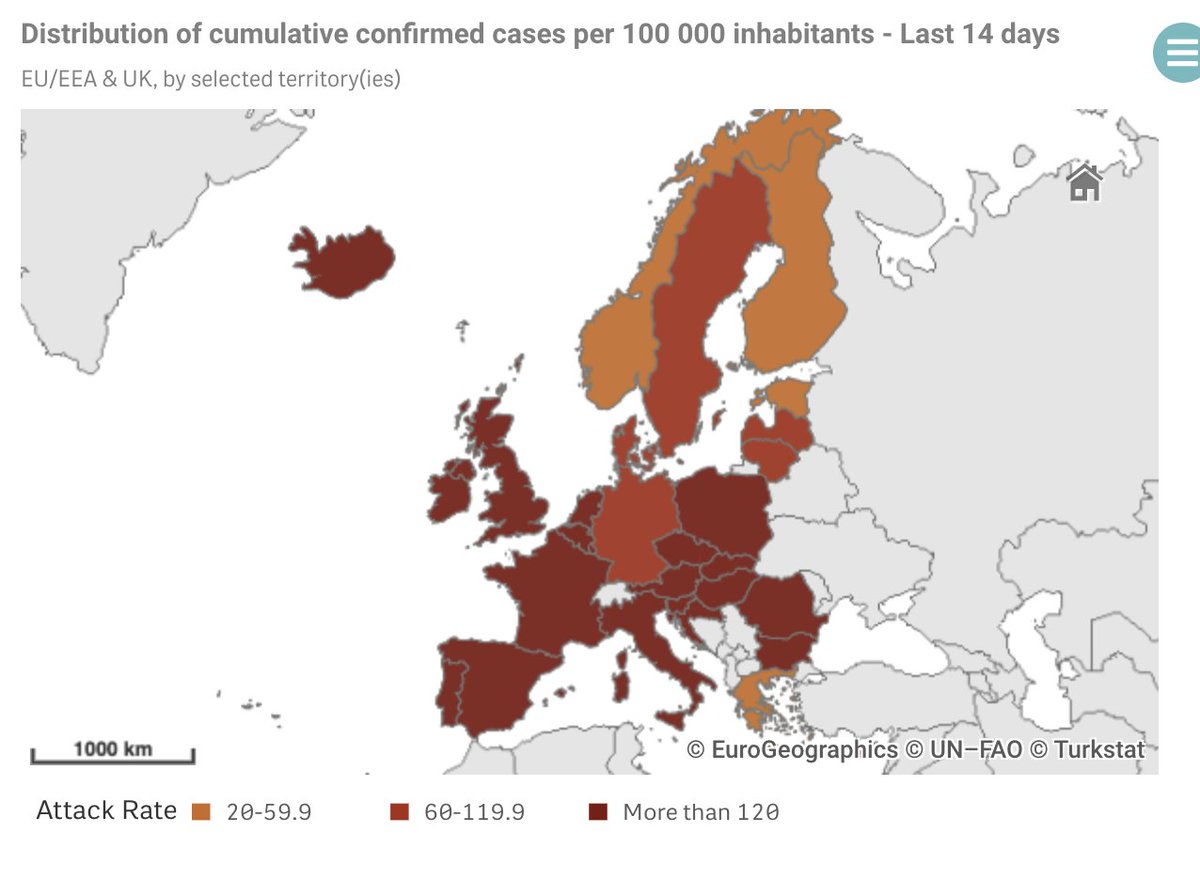
The European picture... the ECDC is going to have to reset it& #39;s colour chart scale.
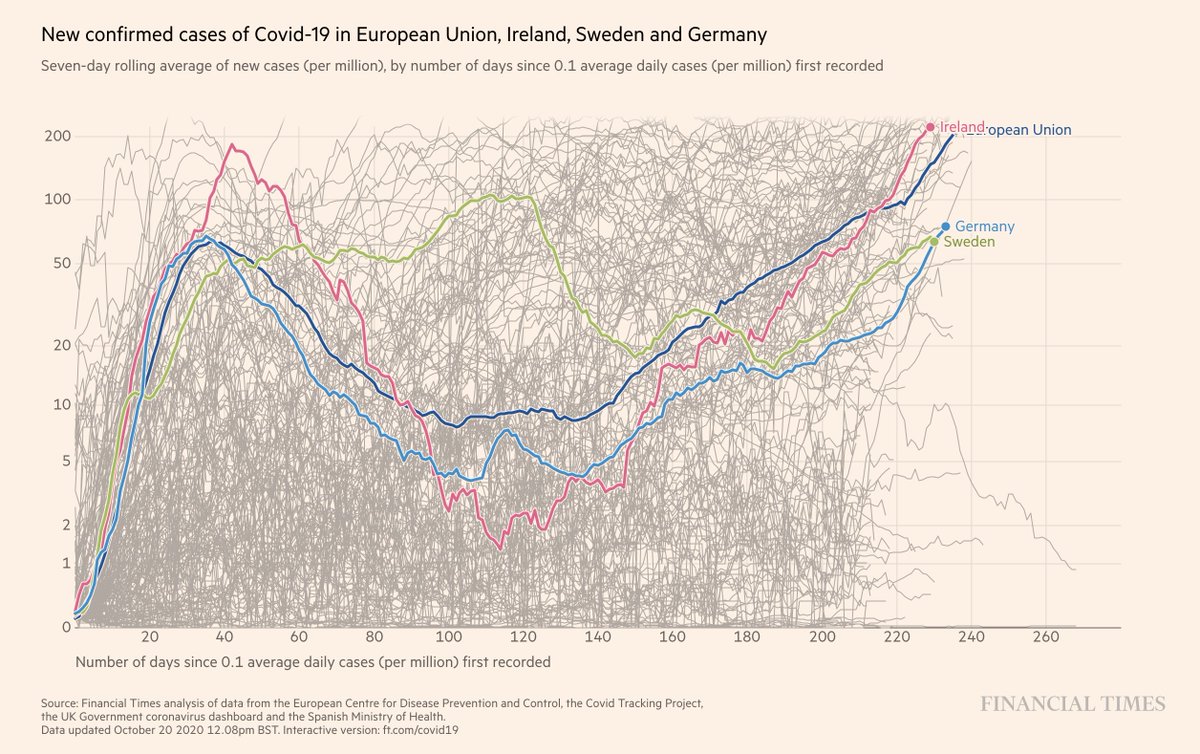
FT graph showing Ireland& #39;s seven day rolling average trend line compared with a wider EU average (with Germany and Sweden also shown) adjusted to when the pandemic really got going in each country. We duck well below the EU line into May/June/July but are now above it.
Lastly, (most) European countries, last 14 days ordered by deaths per 100,000 and cases per 100,000.
This thread ends here, but links to one about Covid restrictions/lockdown measures being brought in across Europe over the last week or so: https://twitter.com/Mark_Coughlan/status/1318158952044154882?s=20">https://twitter.com/Mark_Coug...
This thread ends here, but links to one about Covid restrictions/lockdown measures being brought in across Europe over the last week or so: https://twitter.com/Mark_Coughlan/status/1318158952044154882?s=20">https://twitter.com/Mark_Coug...

 Read on Twitter