With Bitcoin’s price reaching fresh 2020 highs everyone is super excited.But there are a lot of people investing that don’t know what is going on.
Don& #39;t be one of them-understanding candlestick charts is one of the basics.
Sharing might help save your foolish friend& #39;s savings.
Don& #39;t be one of them-understanding candlestick charts is one of the basics.
Sharing might help save your foolish friend& #39;s savings.
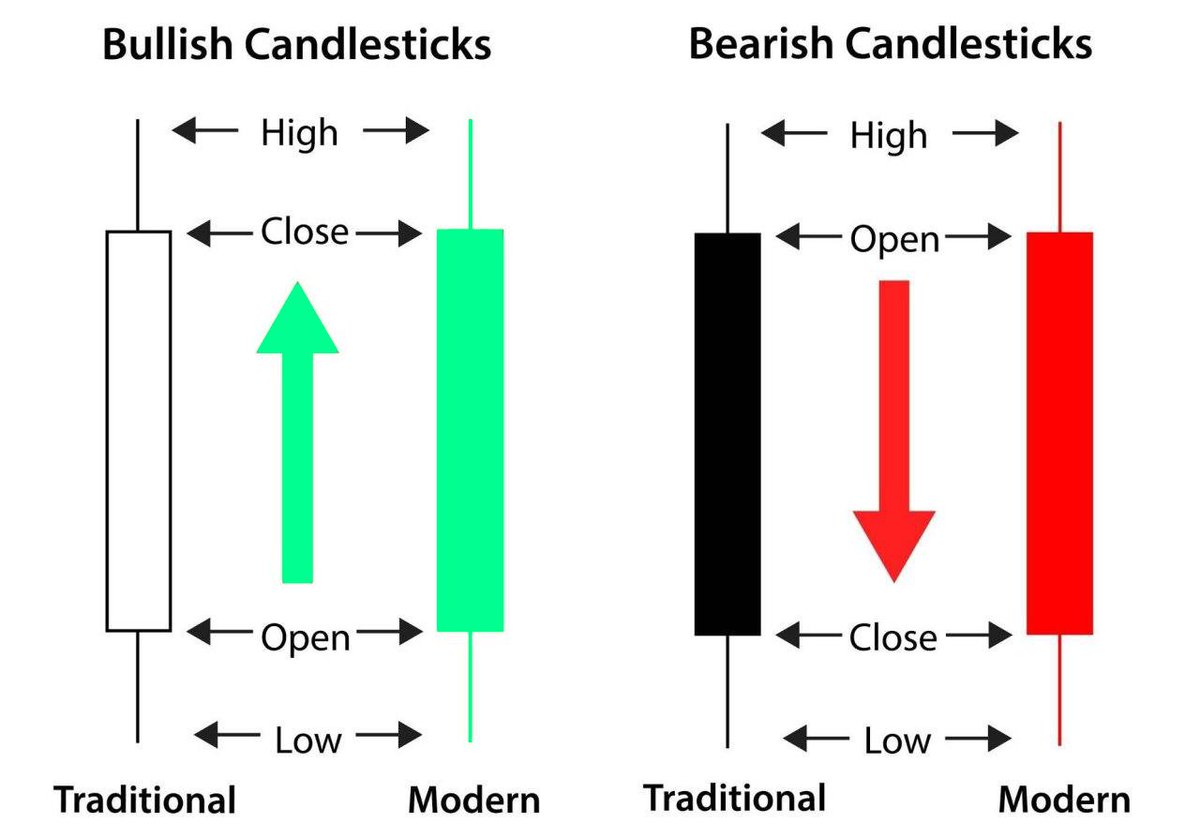
1/ In order to create a candlestick chart, you must have a data set that contains open, high, low, and close values for each time period you want to display.
The filled portion of the candlestick is called the body. The long thin lines above and below the body represent the high/low range and are called shadows (also “wicks” and “tails”). The high is marked by the top of the upper shadow and the low by the bottom of the lower shadow.
If a coin closes higher than its opening price, a green candlestick is drawn with the bottom of the body representing the opening price and the top of the body representing the closing price.
If a coin closes lower than its opening price, a red candlestick is drawn with the top of the body representing the opening price and the bottom of the body representing the closing price.
Green or Hollow or hollow candlesticks, where the close is greater than the open, indicate buying pressure.
Red or filled candlesticks, where the close is less than the open, indicate selling pressure.
Red or filled candlesticks, where the close is less than the open, indicate selling pressure.
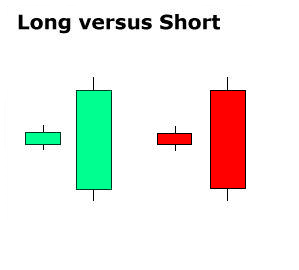
2/ Long green candlesticks show strong buying pressure. The longer the white candlestick is, the further the close is above the open. This indicates that prices advanced significantly from open to close and buyers were aggressive.
Long red candlesticks show strong selling pressure. The longer the black candlestick is, the further the close is below the open.
This indicates that prices declined significantly from the open and sellers were aggressive.
This indicates that prices declined significantly from the open and sellers were aggressive.
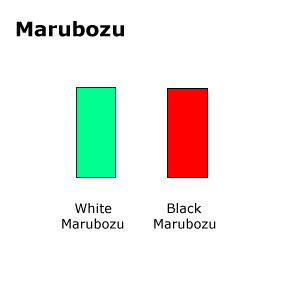
3/Even more potent long candlesticks are the Green and Red Marubozu brothers. Marubozu does not have upper or lower shadows and the high and low are represented by the open or close.
A Green Marubozu forms when the open equals the low and the close equals the high. This indicates that buyers controlled the price action from the first trade to the last trade.
A Red Marubozu forms when the open equals the high and the close equals the low. This indicates that sellers controlled the price action from the first trade to the last trade.
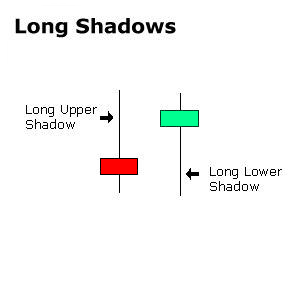
4/Upper shadows represent the session high and lower shadows the session low.
Candlesticks with short shadows indicate that most of the trading action was confined near the open and close.
Candlesticks with long shadows show that prices extended well past the open and close.
Candlesticks with short shadows indicate that most of the trading action was confined near the open and close.
Candlesticks with long shadows show that prices extended well past the open and close.
Candlesticks with a long upper shadow and short lower shadow indicate that buyers dominated during the session, bidding prices higher, but sellers ultimately forced prices down from their highs. This contrast of strong high and weak close resulted in a long upper shadow.
Conversely, candlesticks with long lower shadows and short upper shadows indicate that sellers dominated during the session and drove prices lower. However, buyers later resurfaced to bid prices higher by the end of the session; the strong close created a long lower shadow.
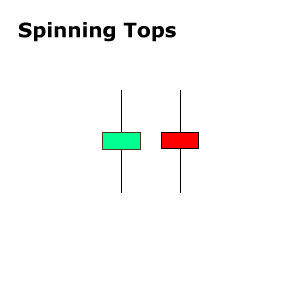
5/Candlesticks with a long upper shadow, long lower shadow, and small real body are called spinning tops. One long shadow represents a reversal of sorts; spinning tops represent indecision.
The small real body (whether hollow or filled) shows little movement from open to close, and the shadows indicate that both bulls and bears were active during the session.
Neither buyers nor sellers could gain the upper hand and the result was a standoff.
Neither buyers nor sellers could gain the upper hand and the result was a standoff.
After a long advance or long green candlestick, a spinning top indicates weakness among the bulls and a potential change or interruption in trend.
After a long decline or long red candlestick, a spinning top indicates weakness among the bears and a potential change.
After a long decline or long red candlestick, a spinning top indicates weakness among the bears and a potential change.
That was candlestick charts 101. I hope you liked it!
For more join my telegram group: https://t.me/bloodgoodBTC ">https://t.me/bloodgood...
For more join my telegram group: https://t.me/bloodgoodBTC ">https://t.me/bloodgood...

 Read on Twitter