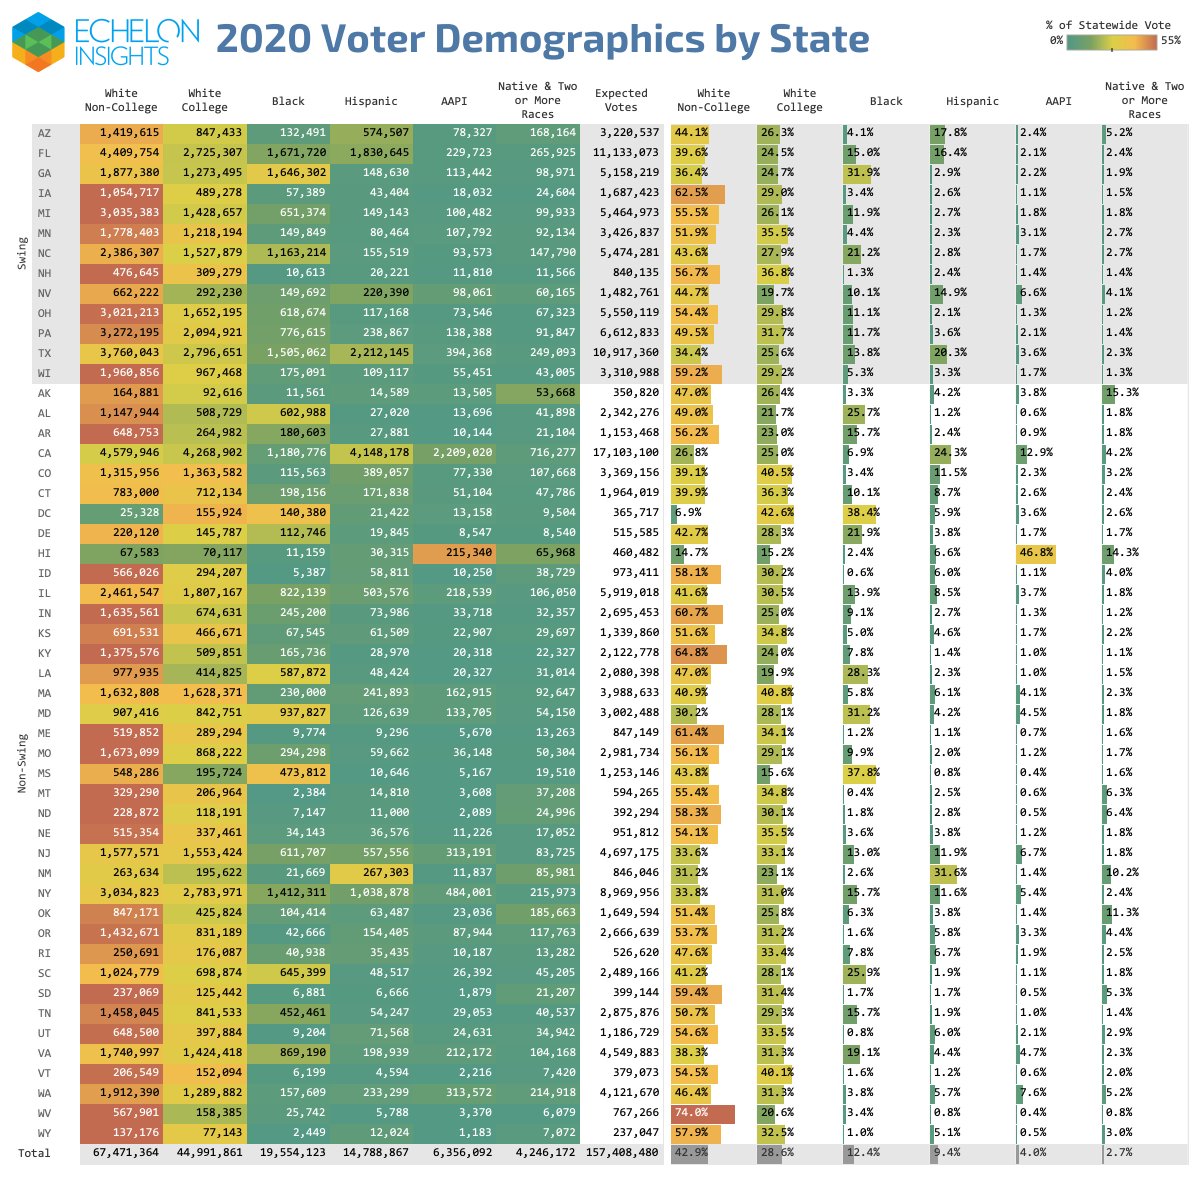
Unveiling our 2020 turnout estimate and a massive upgrade to our state and Congressional District estimates, with expected numbers of votes cast by demographic in every state and CD.
We expect 157,408,480 votes in 2020. https://medium.com/echelon-indicators/america-is-headed-for-record-turnout-heres-what-that-looks-like-3432deb9fe05">https://medium.com/echelon-i...
We expect 157,408,480 votes in 2020. https://medium.com/echelon-indicators/america-is-headed-for-record-turnout-heres-what-that-looks-like-3432deb9fe05">https://medium.com/echelon-i...
If this holds, it will be a VEP turnout rate of 65.8%, topping 2008’s 62.2%. Our numbers are based on an individual turnout model on every voter, informed by high turnout in 2018 and other recent elections.
The 2020 vote, by demographic group
White Non-College: 67,471,364 (42.9%)
White College Grads: 44,991,861 (28.5%)
Black: 19,554,123 (12.4%)
Hispanic: 14,778,867 (9.4%)
AAPI: 6,356,092 (4.0%)
No College Degree: 98,247,420 (62.4%)
College Degree: 59,141,059 (37.6%)
White Non-College: 67,471,364 (42.9%)
White College Grads: 44,991,861 (28.5%)
Black: 19,554,123 (12.4%)
Hispanic: 14,778,867 (9.4%)
AAPI: 6,356,092 (4.0%)
No College Degree: 98,247,420 (62.4%)
College Degree: 59,141,059 (37.6%)
Our full state by state breakdown, tracking voter blocs as small as 1,183 Asian voters in Wyoming. It& #39;s big, so you may want to view this at the link. https://medium.com/echelon-indicators/america-is-headed-for-record-turnout-heres-what-that-looks-like-3432deb9fe05">https://medium.com/echelon-i...
Swing state electorates range from 60% without college degrees in Minnesota and New Hampshire to 71% in Nevada, 69% in Iowa and Michigan, and 68% in Wisconsin.
Swing state electorates ranked by share of White Non-College voters, a pro-Trump group, range from Texas at 34%, Georgia at 36%, Florida at 40%, to Iowa at 63% and Wisconsin at 59%.
The Black vote in swing states will range from 1% in New Hampshire all the way up to 32% in Georgia. The Hispanic vote will be concentrated in 4 swing states: Texas (20%), Arizona (18%), Florida (16%), and Nevada (15%).
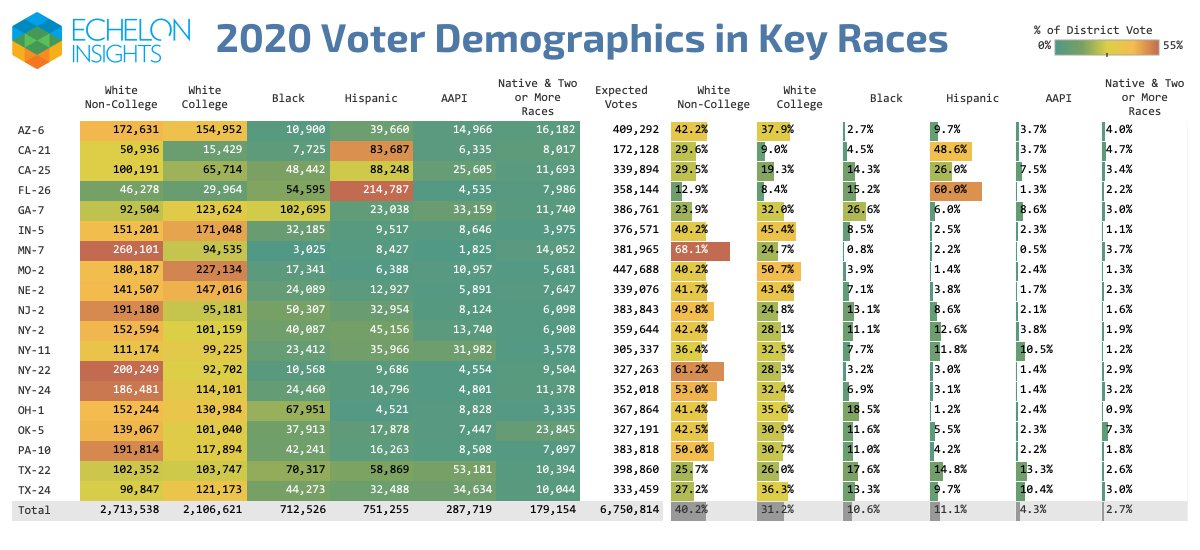
We also took a look at the top 20 House races, as ranked by the most “Tossup” rankings. In 5 districts (GA-7, IN-5, MO-2, NE-2, TX-22), White College voters outnumber White Non-College, with Dems on offense.
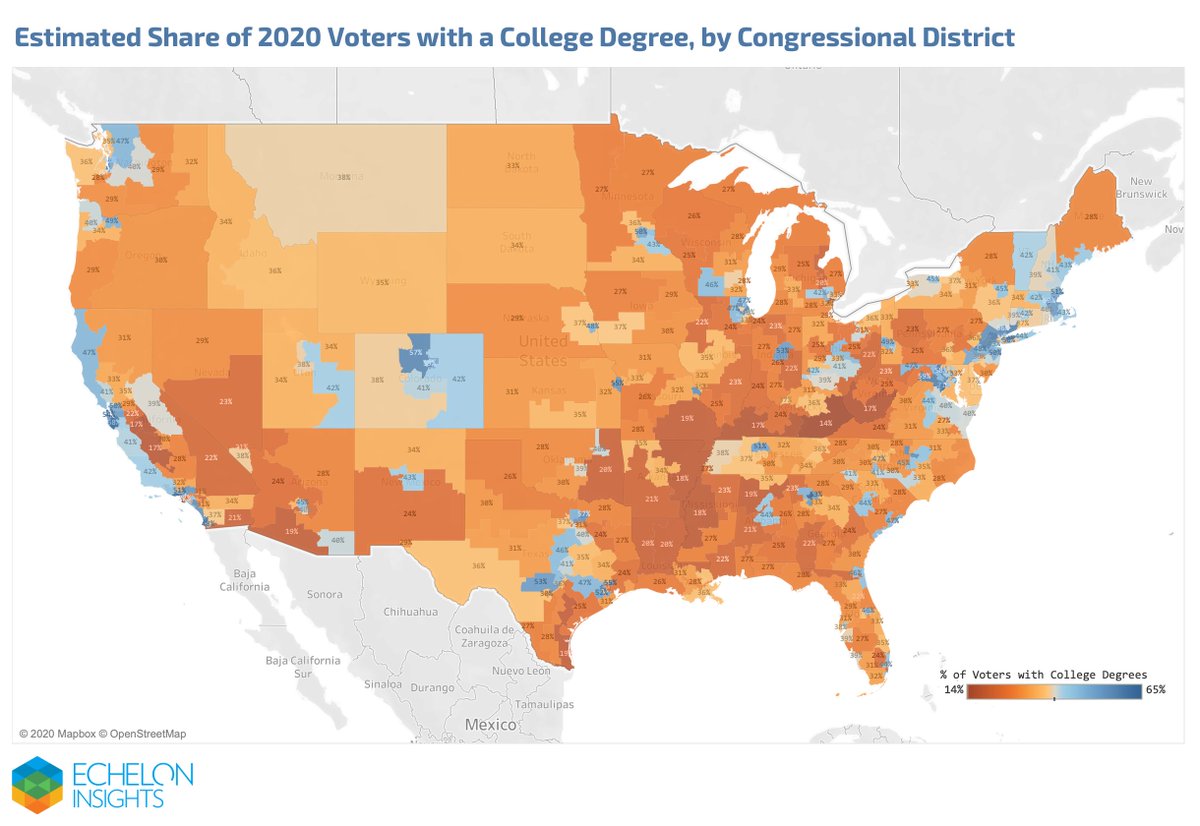
Also in the piece: A full-size graphic of college grad %s for voters in every CD in the lower 48. https://medium.com/echelon-indicators/america-is-headed-for-record-turnout-heres-what-that-looks-like-3432deb9fe05">https://medium.com/echelon-i...
These are estimates for *2020 voters*. Not adults. Not RVs. We go into our methods and why we think it’s better than relying exclusively on the CPS survey. Another thing it’s not: Modeled consumer data. https://medium.com/echelon-indicators/america-is-headed-for-record-turnout-heres-what-that-looks-like-3432deb9fe05">https://medium.com/echelon-i...
We hope this adds to a better understanding of the *real* electorate. Watch for more granular releases as we analyze the election results and heading into redistricting!

 Read on Twitter


