This is my #Missouri #COVID19 evening update  https://abs.twimg.com/emoji/v2/... draggable="false" alt="🧵" title="Thread" aria-label="Emoji: Thread"> for Tuesday, 10/20. My website has been fully updated - https://slu-opengis.github.io/covid_daily_viz/.
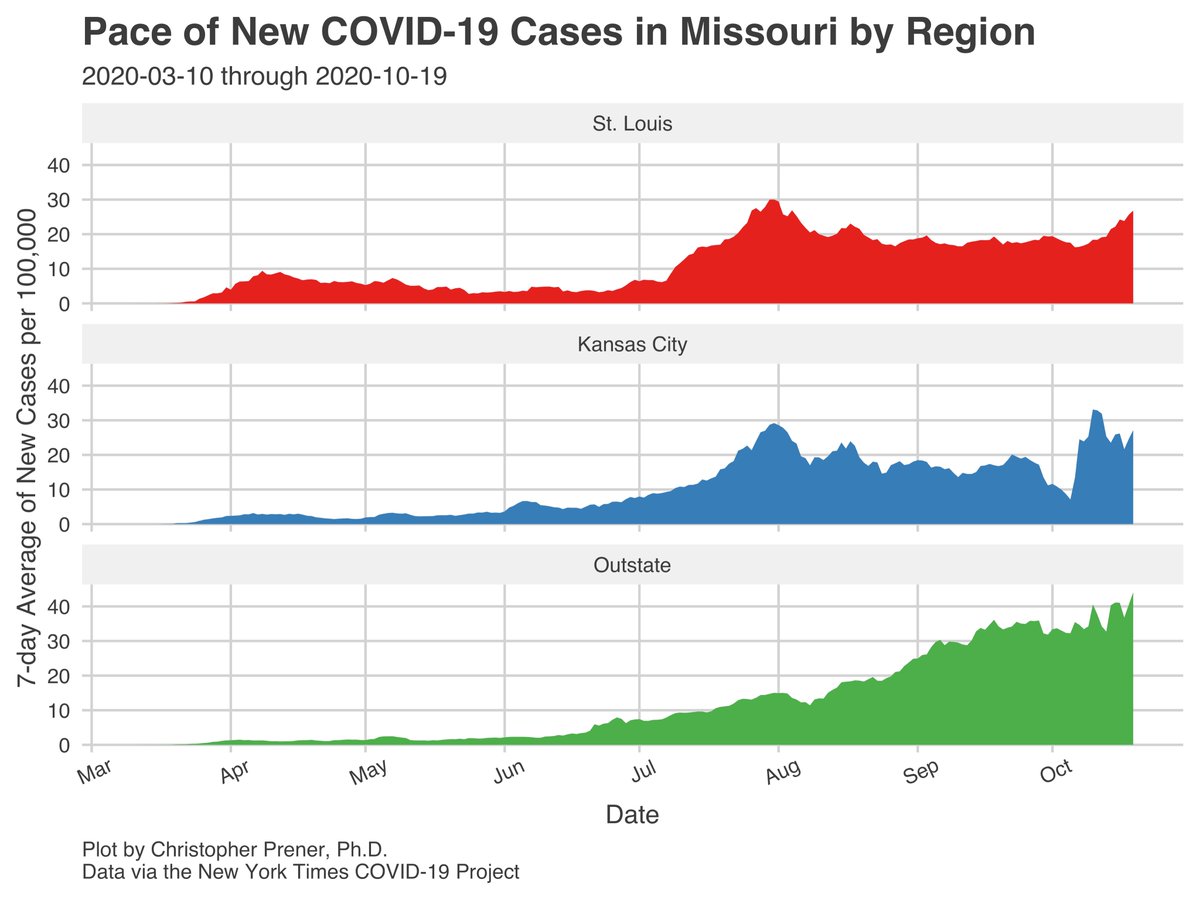
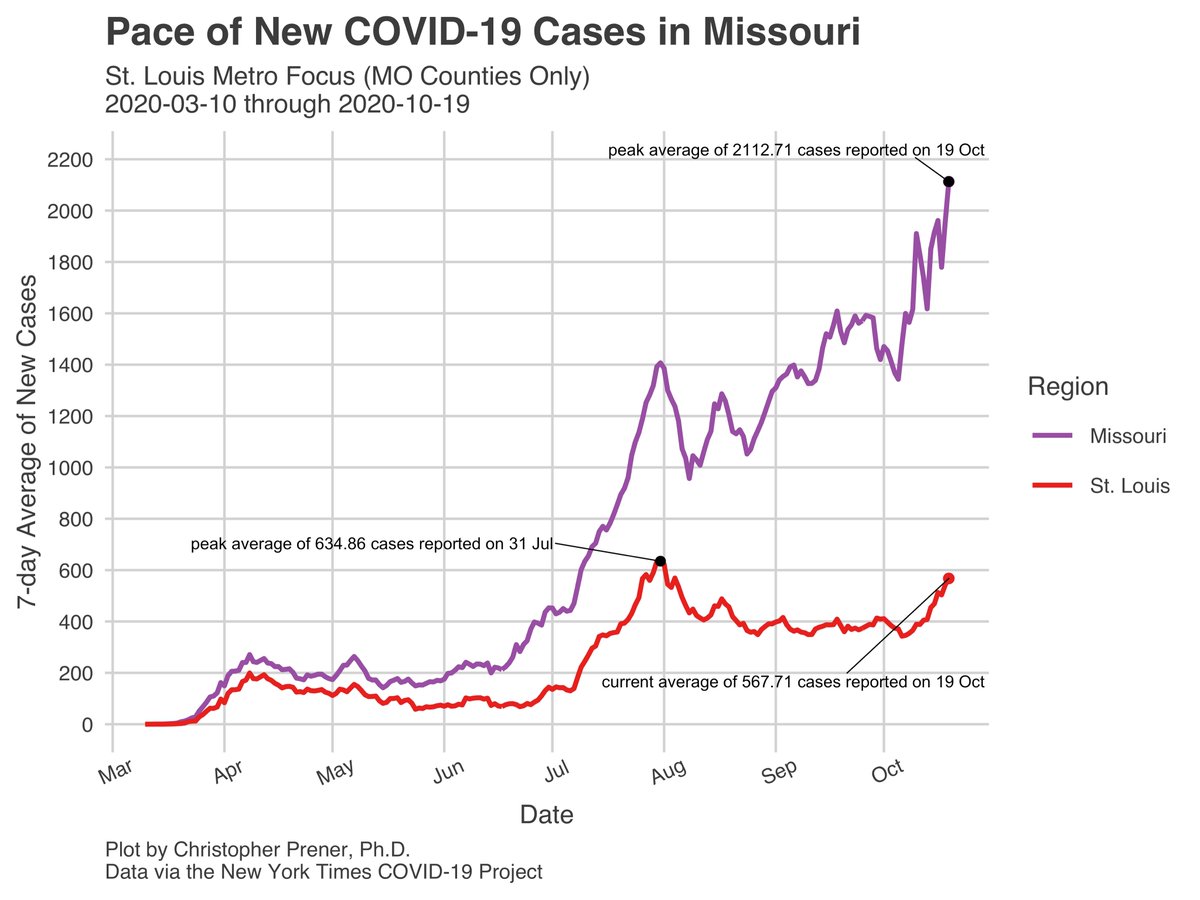
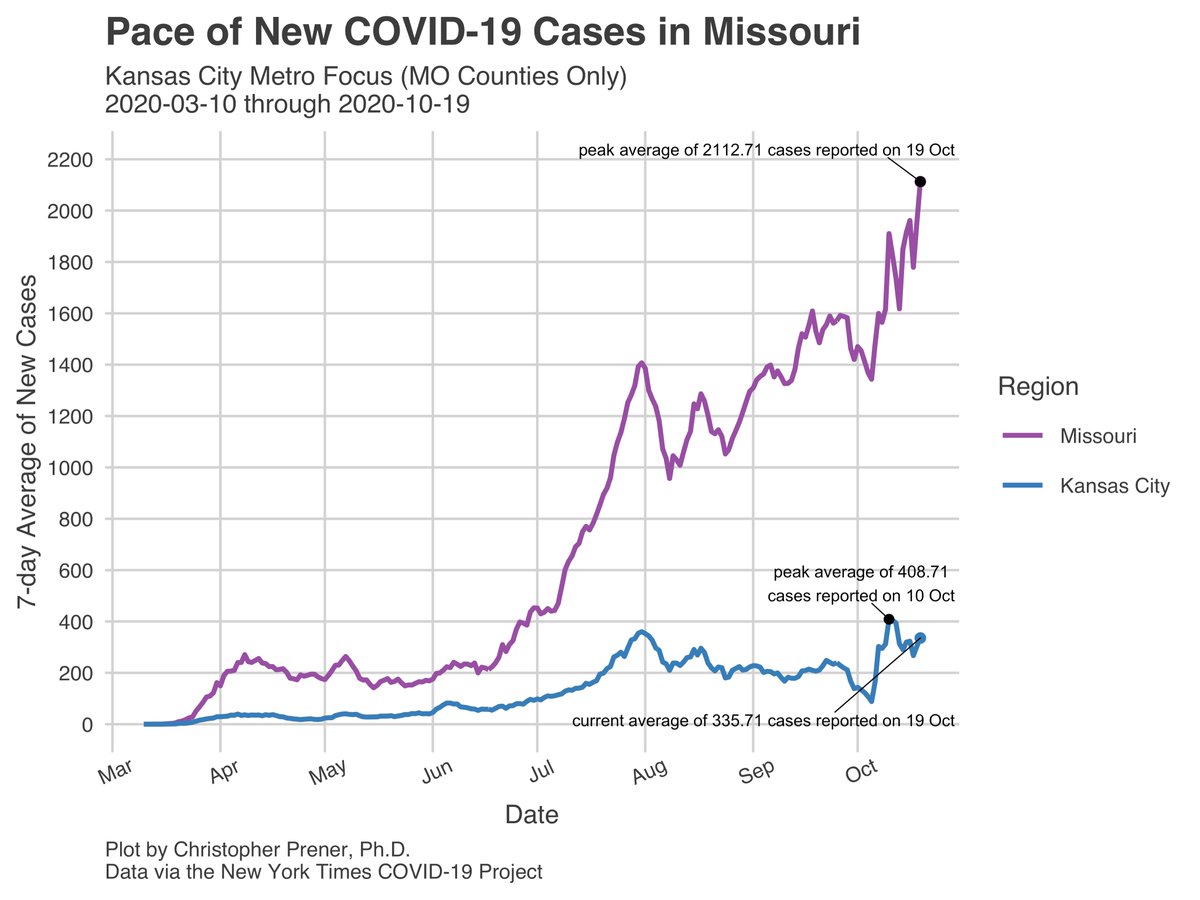
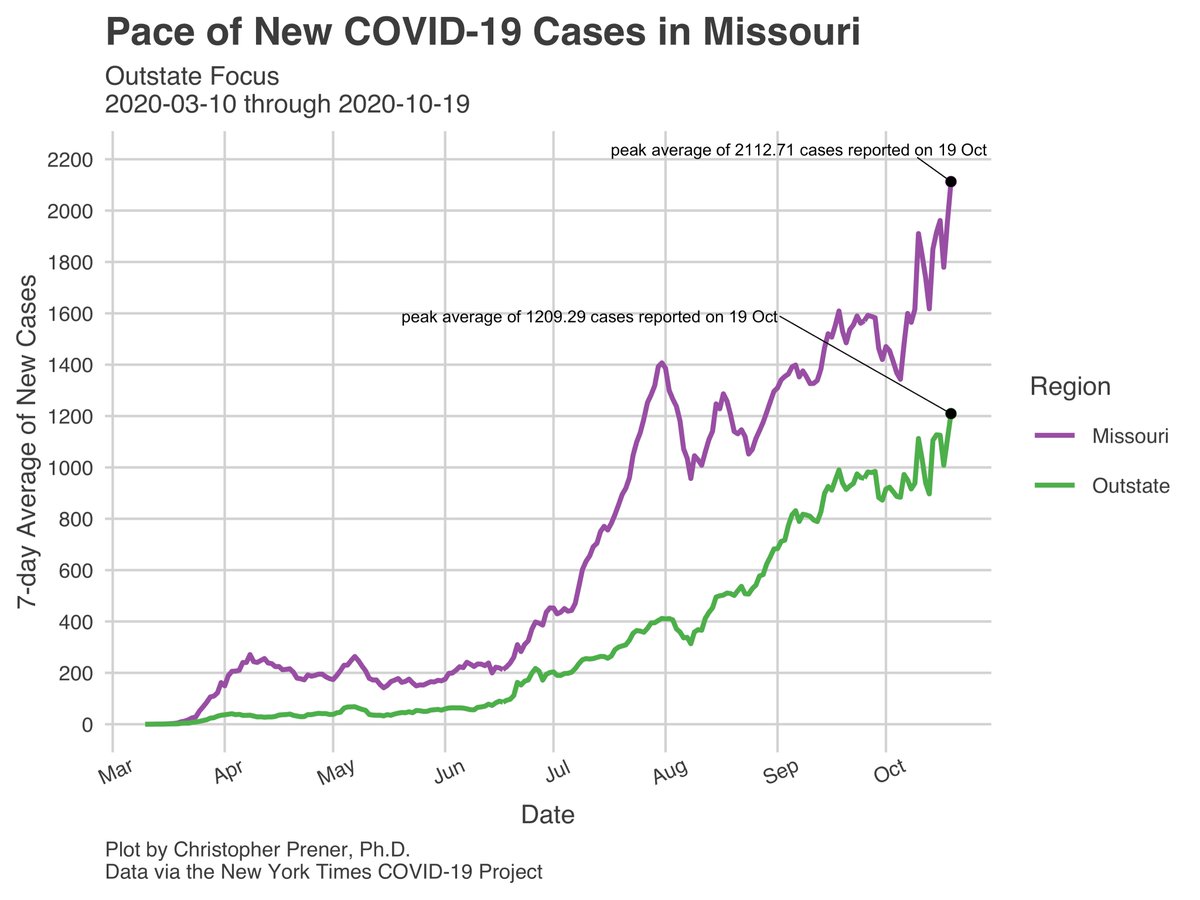
The">https://slu-opengis.github.io/covid_dai... 7-day averages statewide and within the meso regions are all concerning, but they still include the large dump of cases on 10/14. 1/23
The">https://slu-opengis.github.io/covid_dai... 7-day averages statewide and within the meso regions are all concerning, but they still include the large dump of cases on 10/14. 1/23
My thread on Thursday will be our first shot at 7-day averages that have not been dramatically altered by data consistency issues in DHSS’s reporting. I have the most confidence in the #StLouis regional trend  https://abs.twimg.com/emoji/v2/... draggable="false" alt="☝️" title="Zeigefinger nach oben" aria-label="Emoji: Zeigefinger nach oben">, which is following the pattern of our summer spike in cases. 2/23
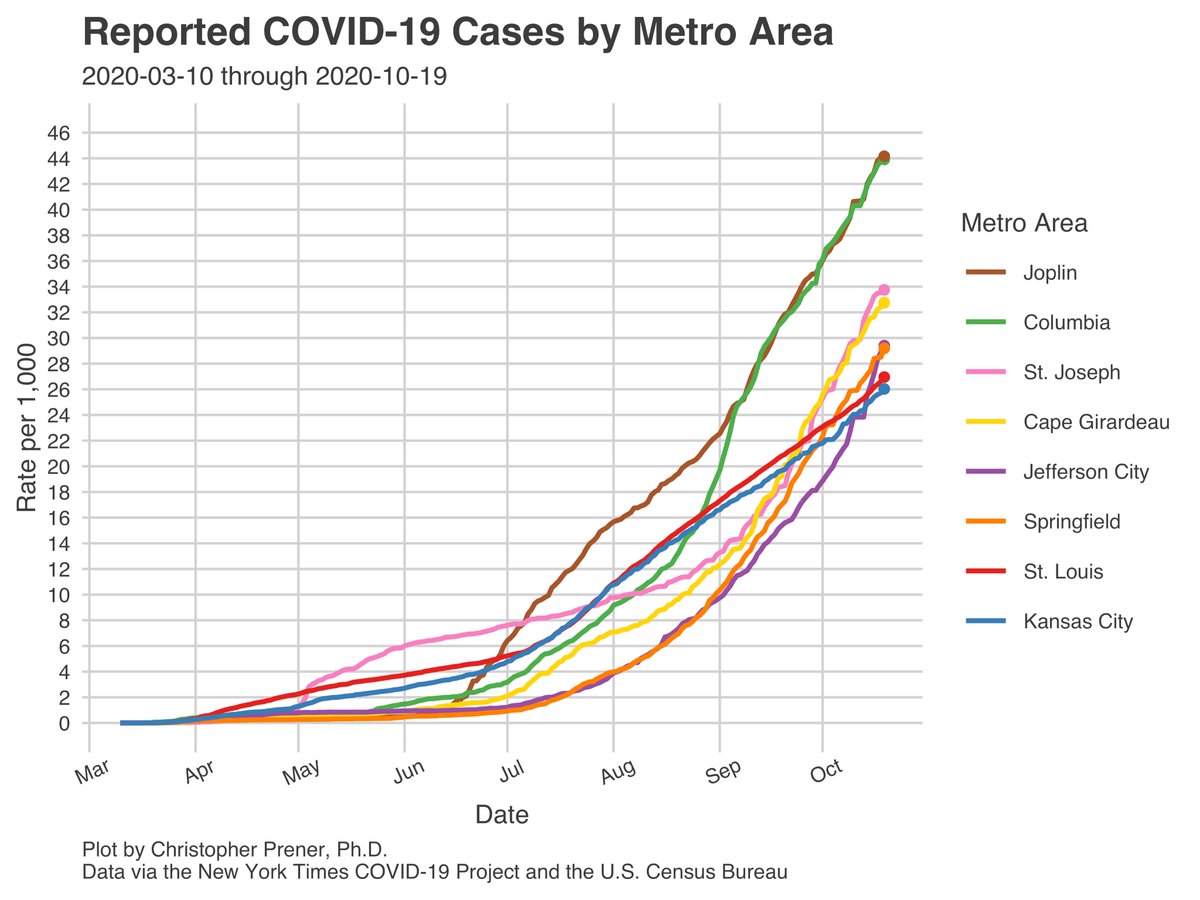
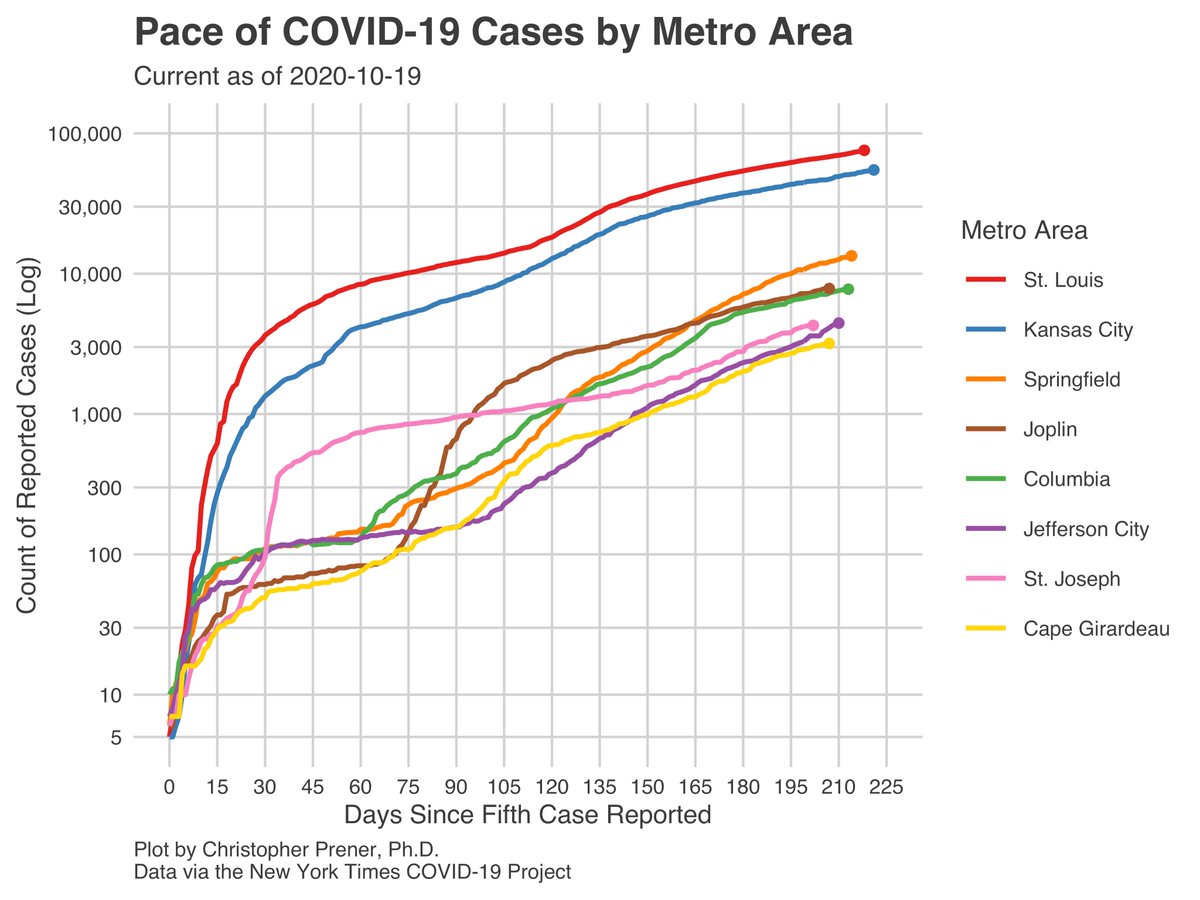
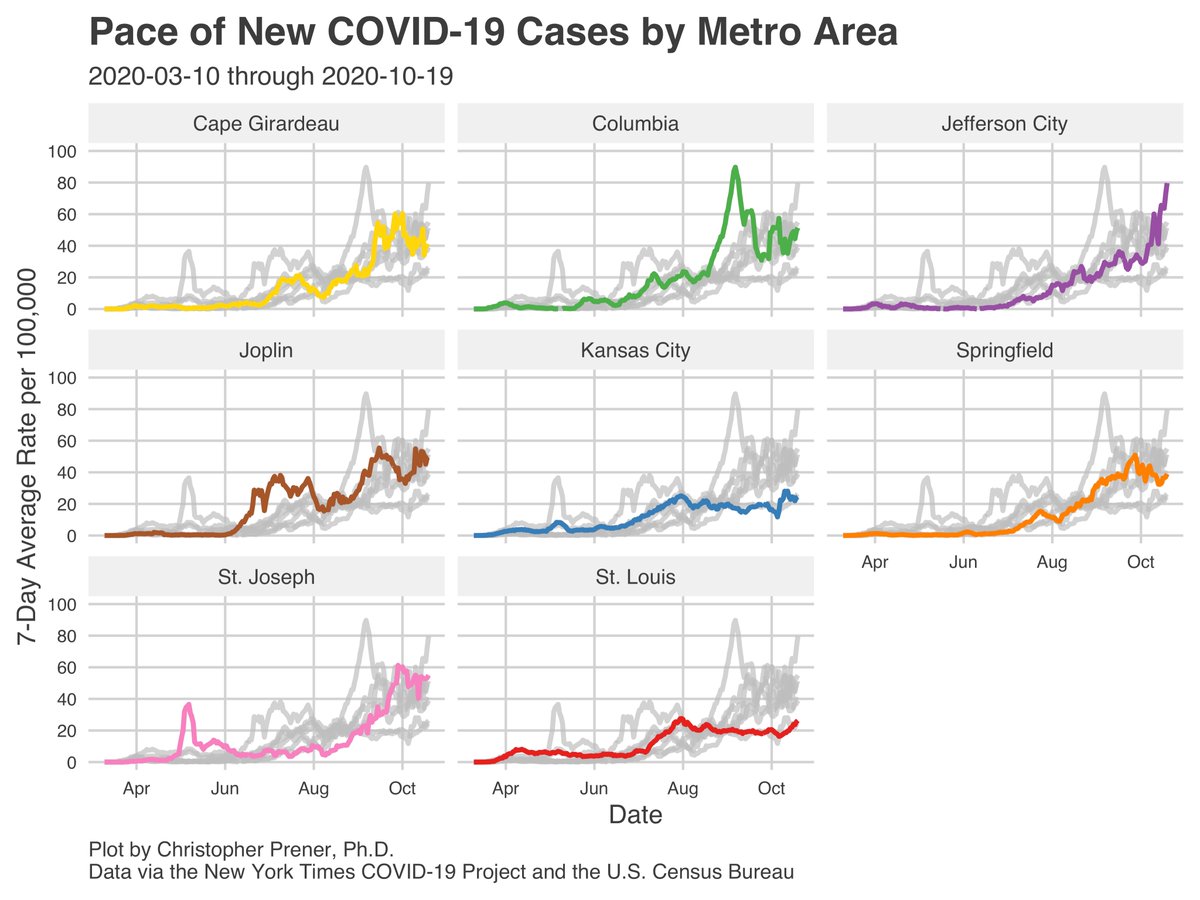
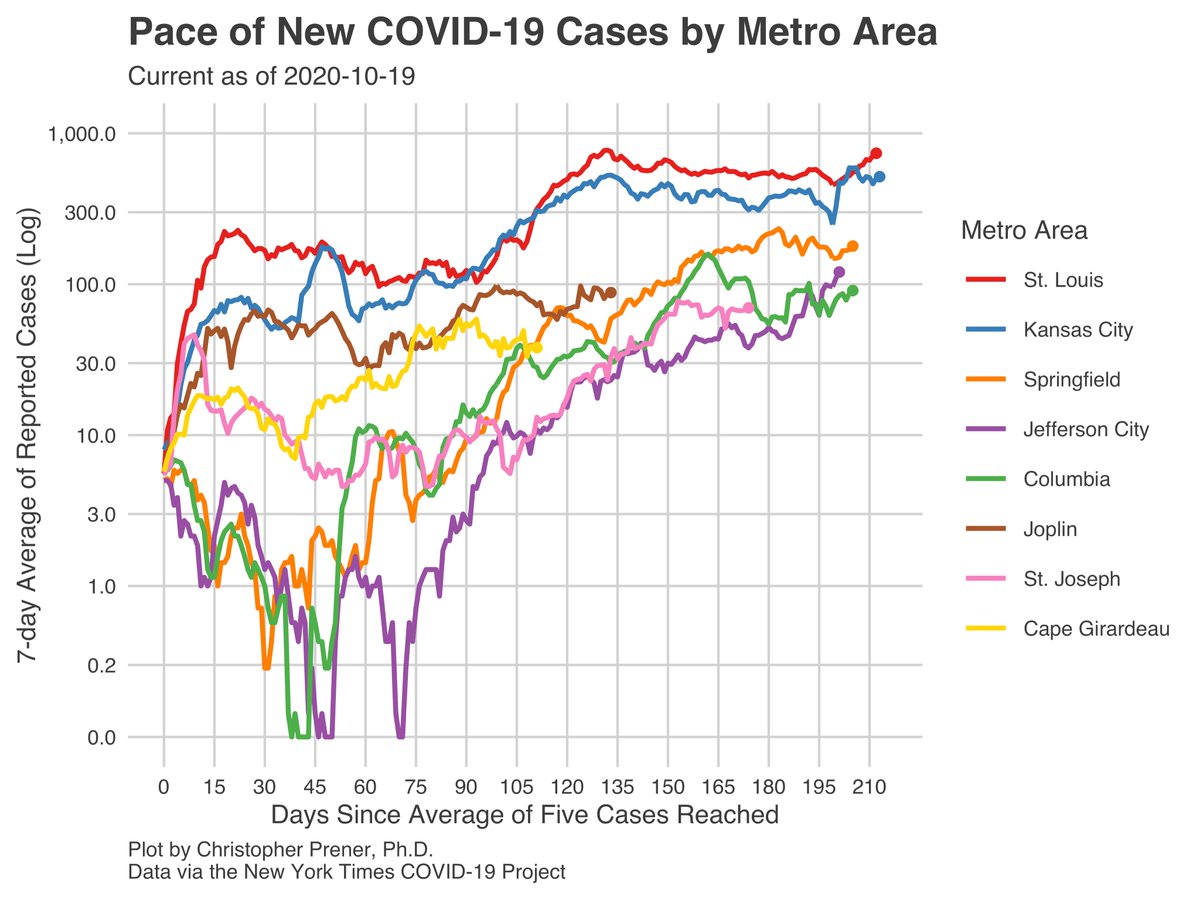
At the metro level, #StLouis and #KansasCity continue to stand out for their relatively low rates of new cases compared to the other metro areas. They now also have the lowest per capita cumulative rate of all metros. JeffCity’s spike is most prominent right now. 3/23
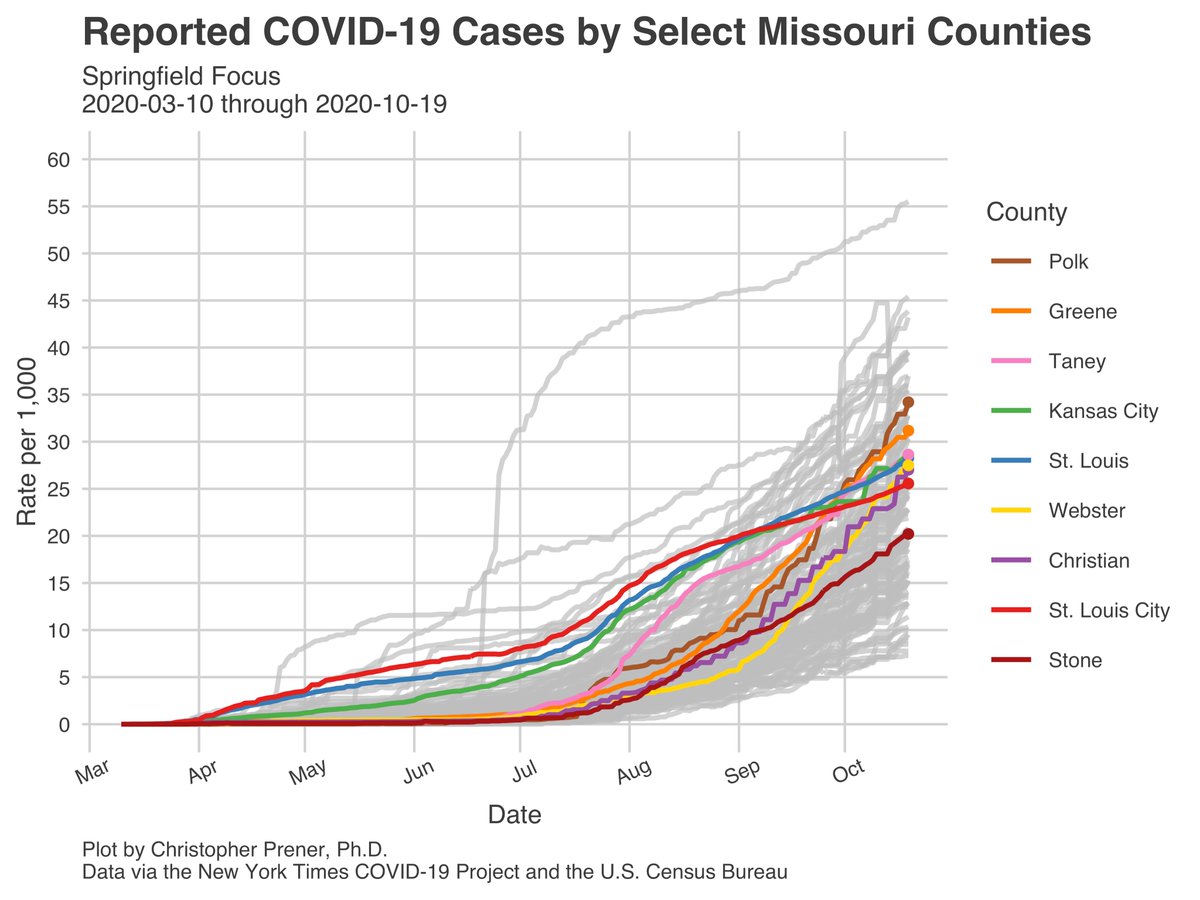
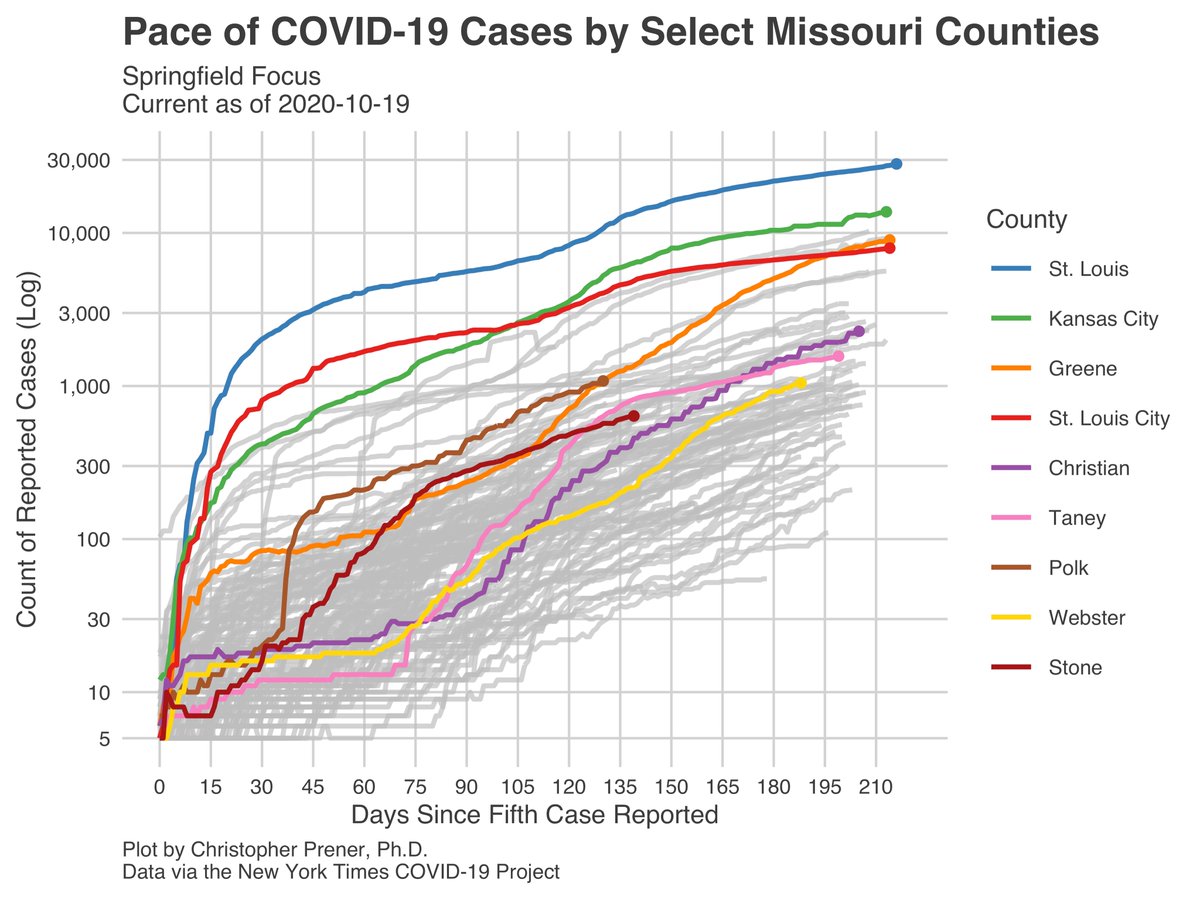
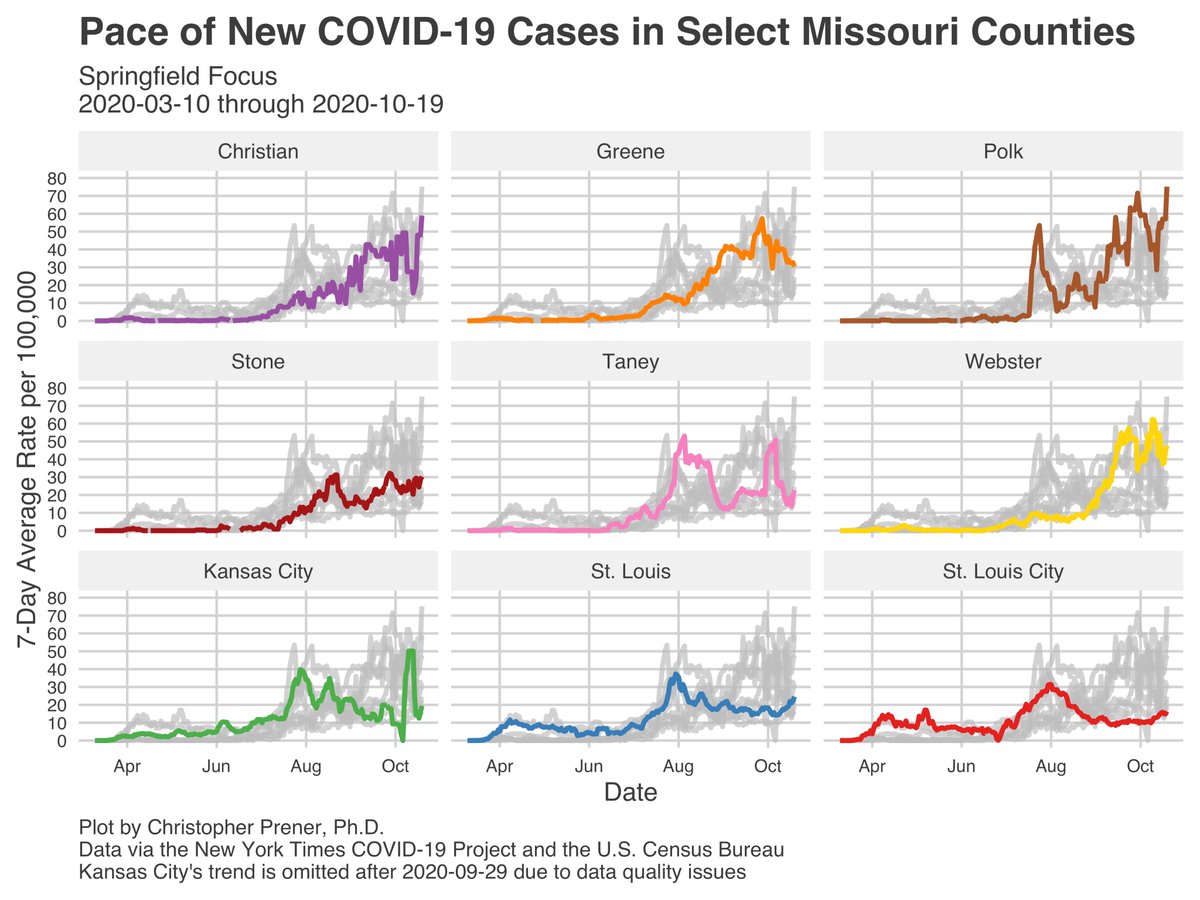
Greene County’s per capita 7-day average continues to decline, but surrounding counties like Polk and Christian are now seeing their own dramatic spikes in their 7-day averages, so no relief is in sight for the hospitals in Springfield. 4/23
This is particularly important because both systems in Greene County, Cox and Mercy, have reported significant numbers of patients. @GregHolmanNL reported in the @springfieldNL yesterday that Mercy will reopen its dedicated COVID ED. 5/23 https://www.news-leader.com/story/news/local/ozarks/2020/10/20/covid-nixa-ozark-mask-mandate-mayors-mask-ordinance-coronavirus-missouri/5990210002/">https://www.news-leader.com/story/new...
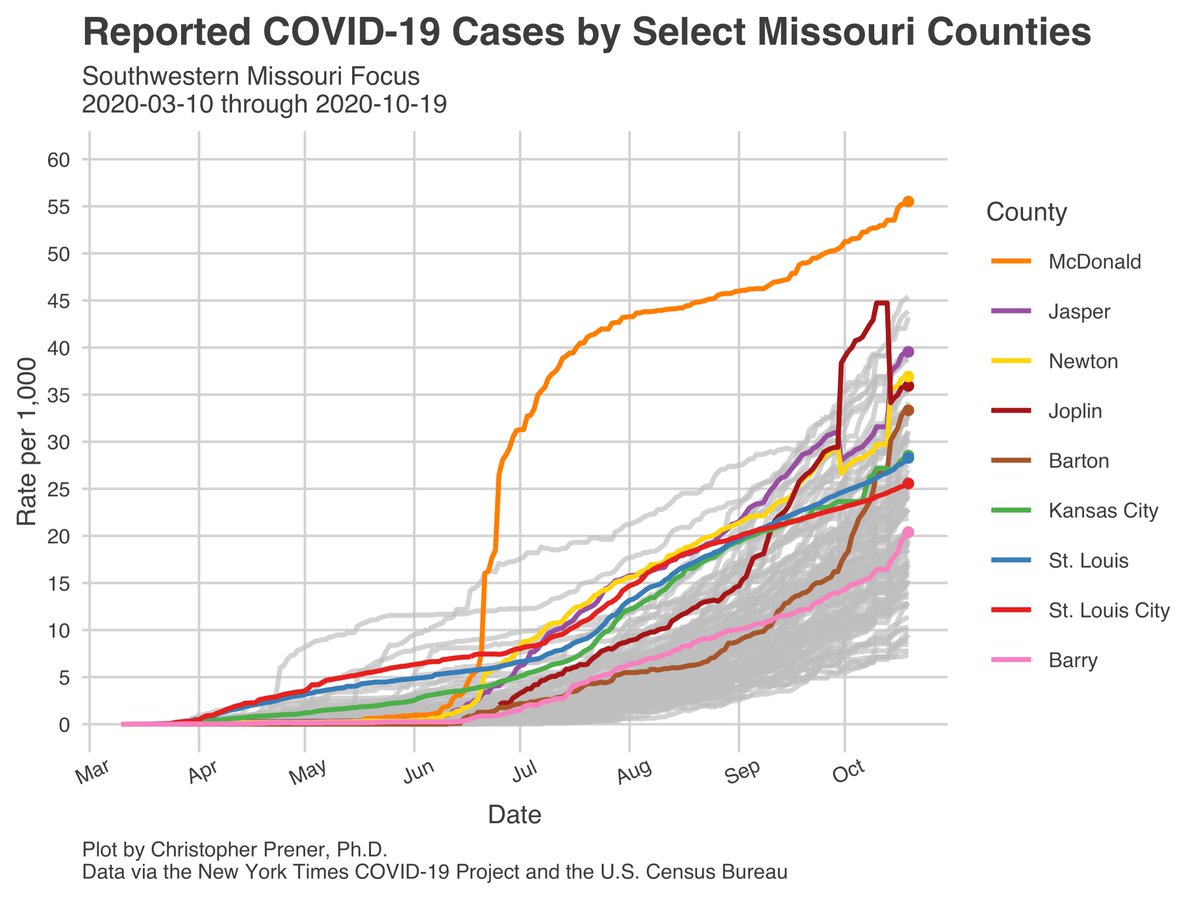
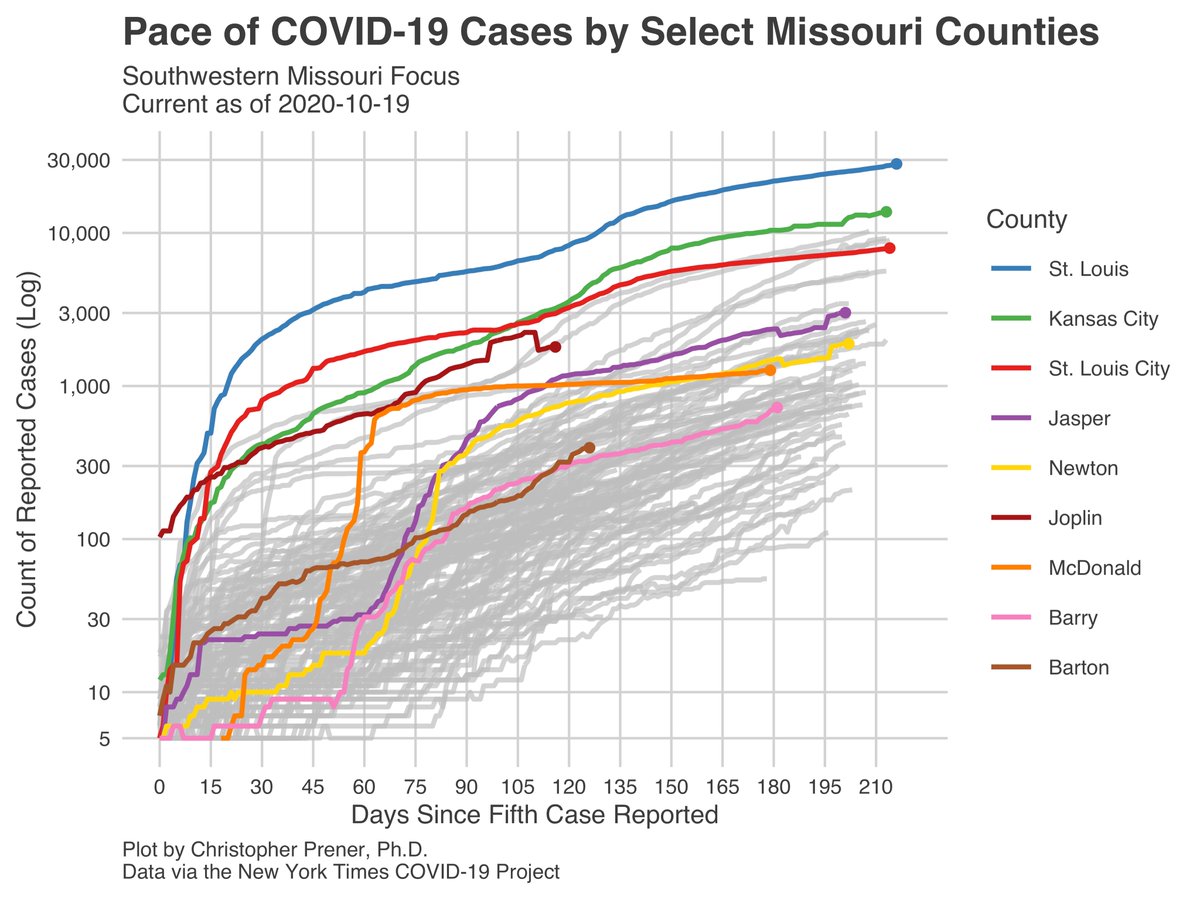
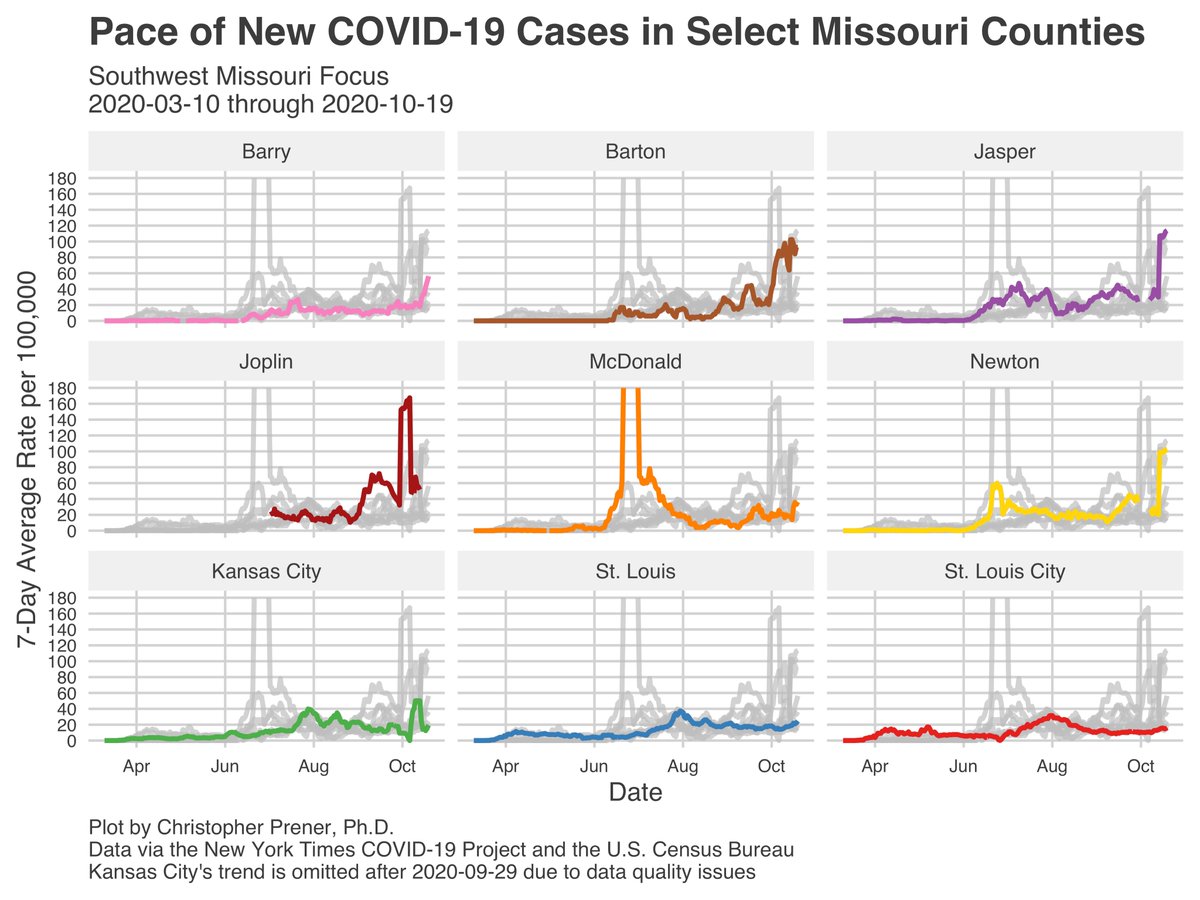
To the SW, some of the instability in COVID numbers appears to have resolved - cases being mistakenly assigned to Joplin instead of Jasper and Newton counties. Their 7-day avg are at all-time highs right now, but this may be noise from the data issues. We’ll know Thursday. 6/23
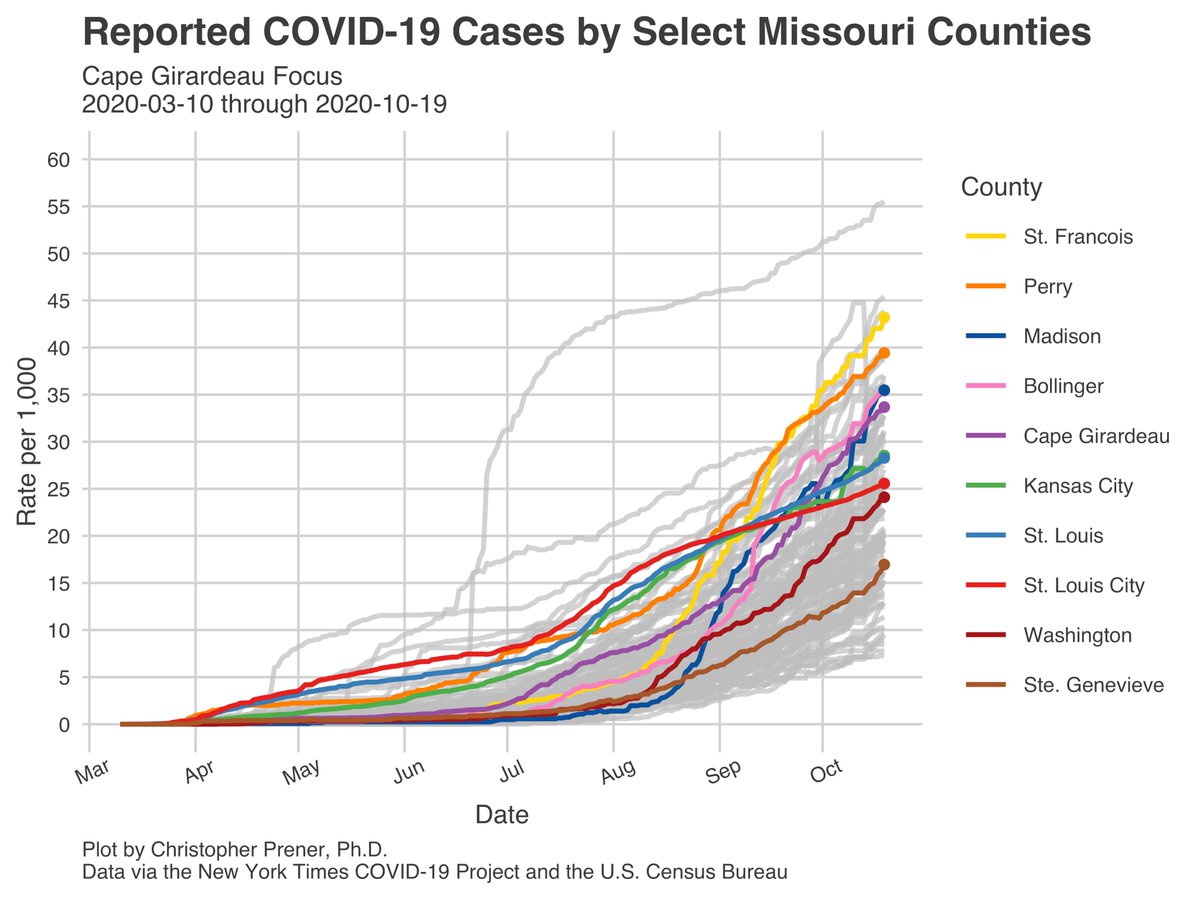
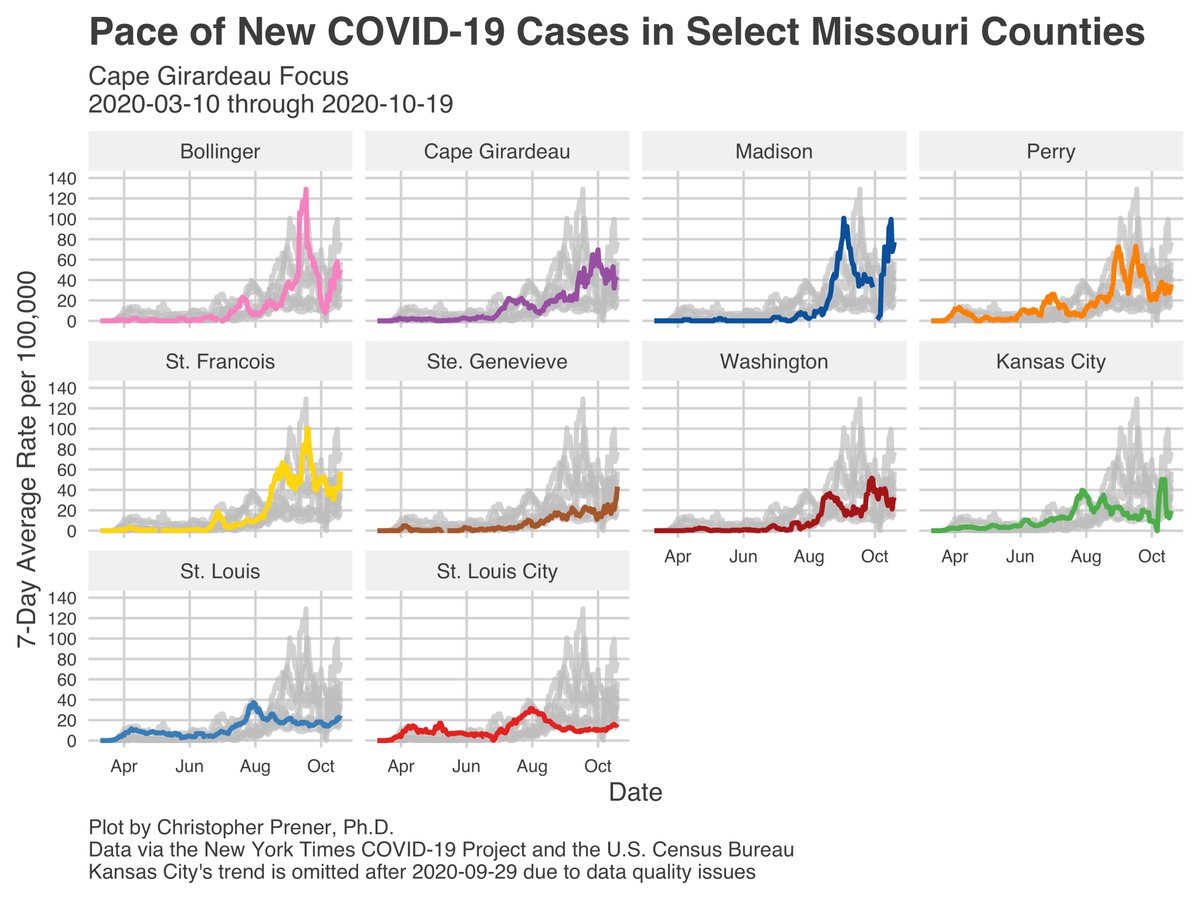
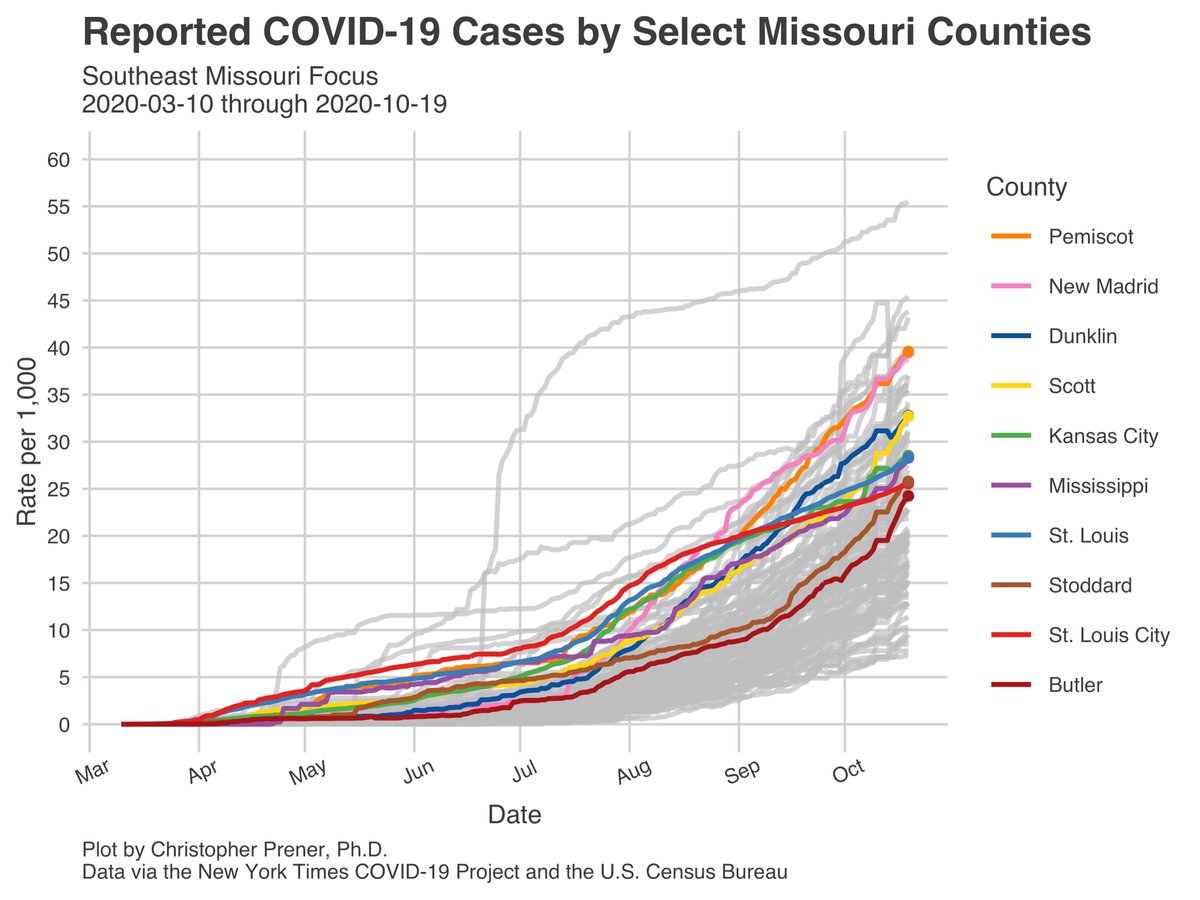
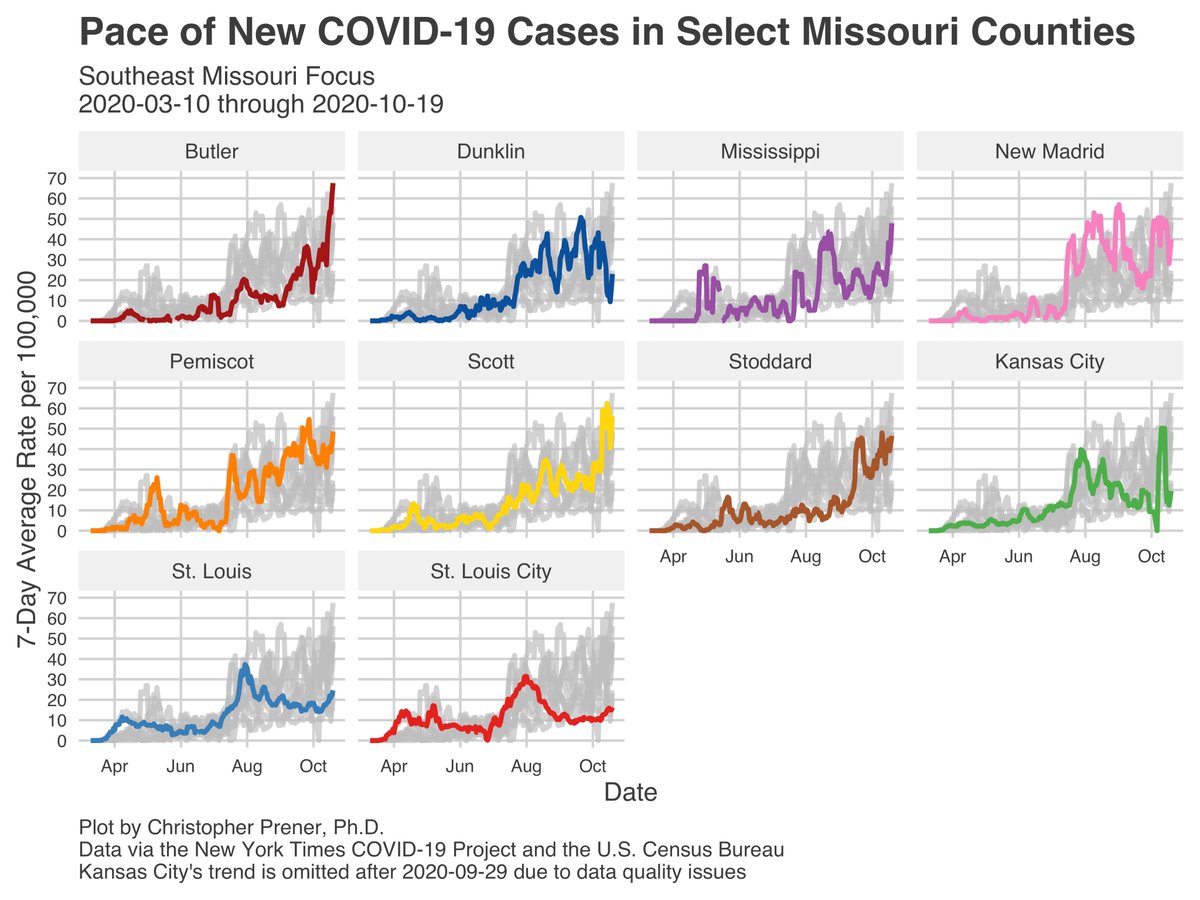
In the SE part of the state, we’re seeing 7-day averages slowly rise. I generally don’t think these are driven by DHSS reporting issues - I think they’re more likely a sign of a resurgence in cases. Butler County is seeing its highest 7-day average of the pandemic so far. 7/23
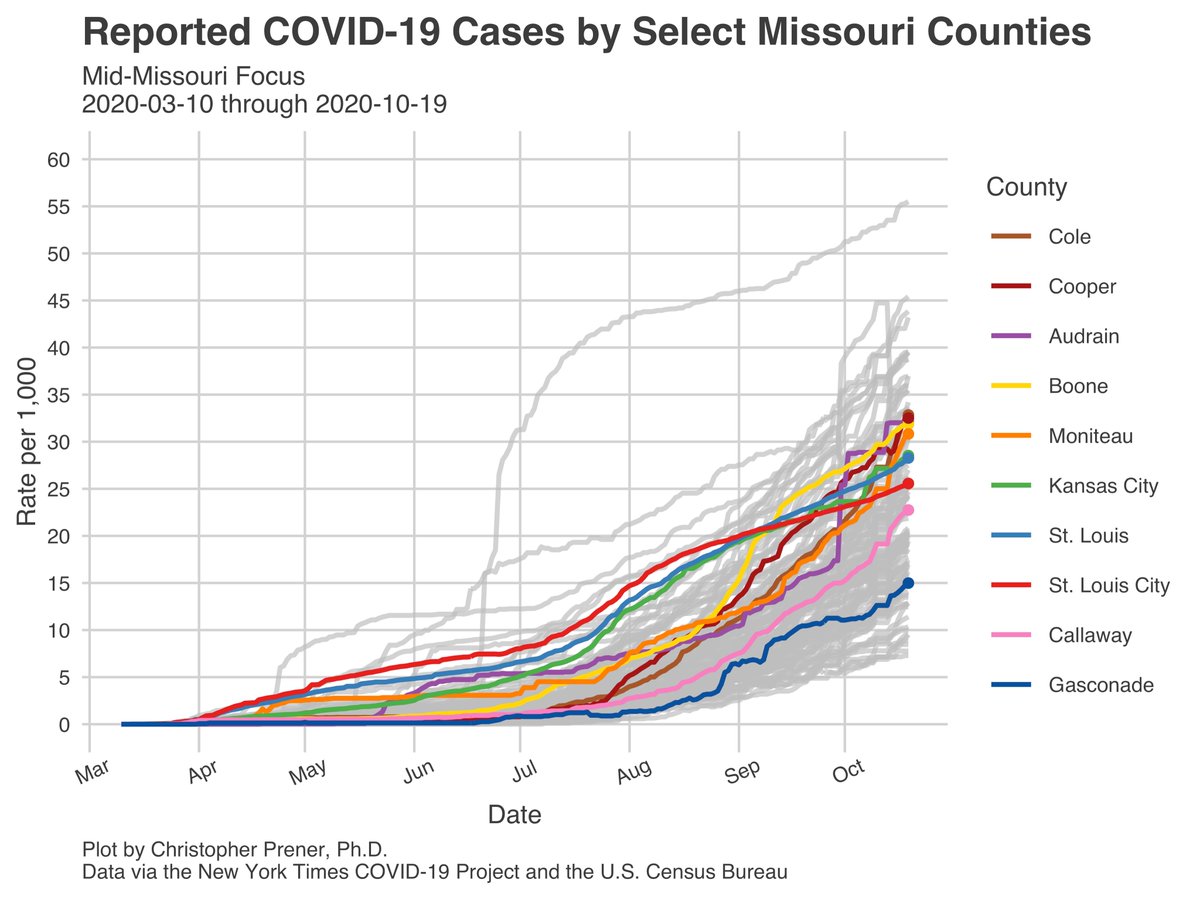
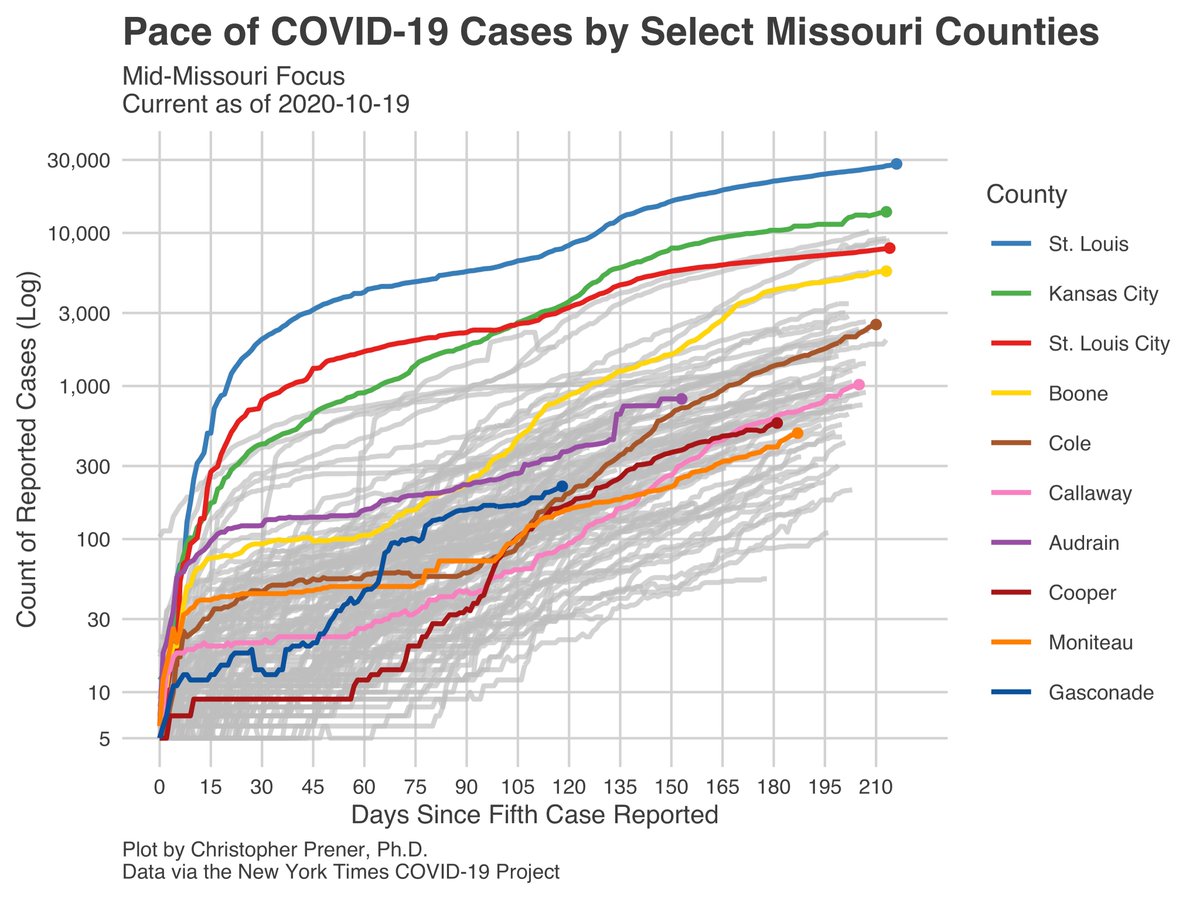
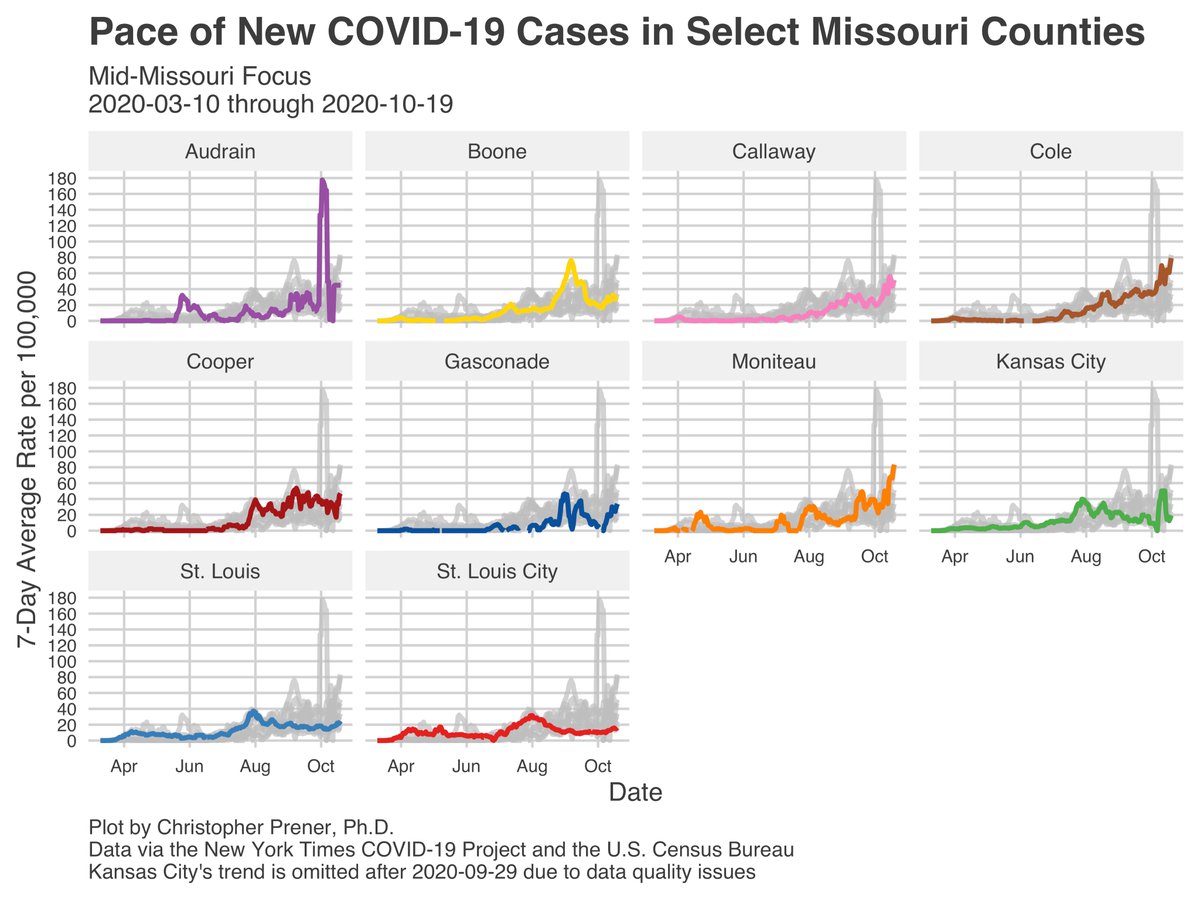
Mid-Missouri, especially in Cole and Moniteau counties, is seeing the highest 7-day averages right now in the state. Both appear to be actual increases in cases and not just noise from DHSS reporting woes. 8/23
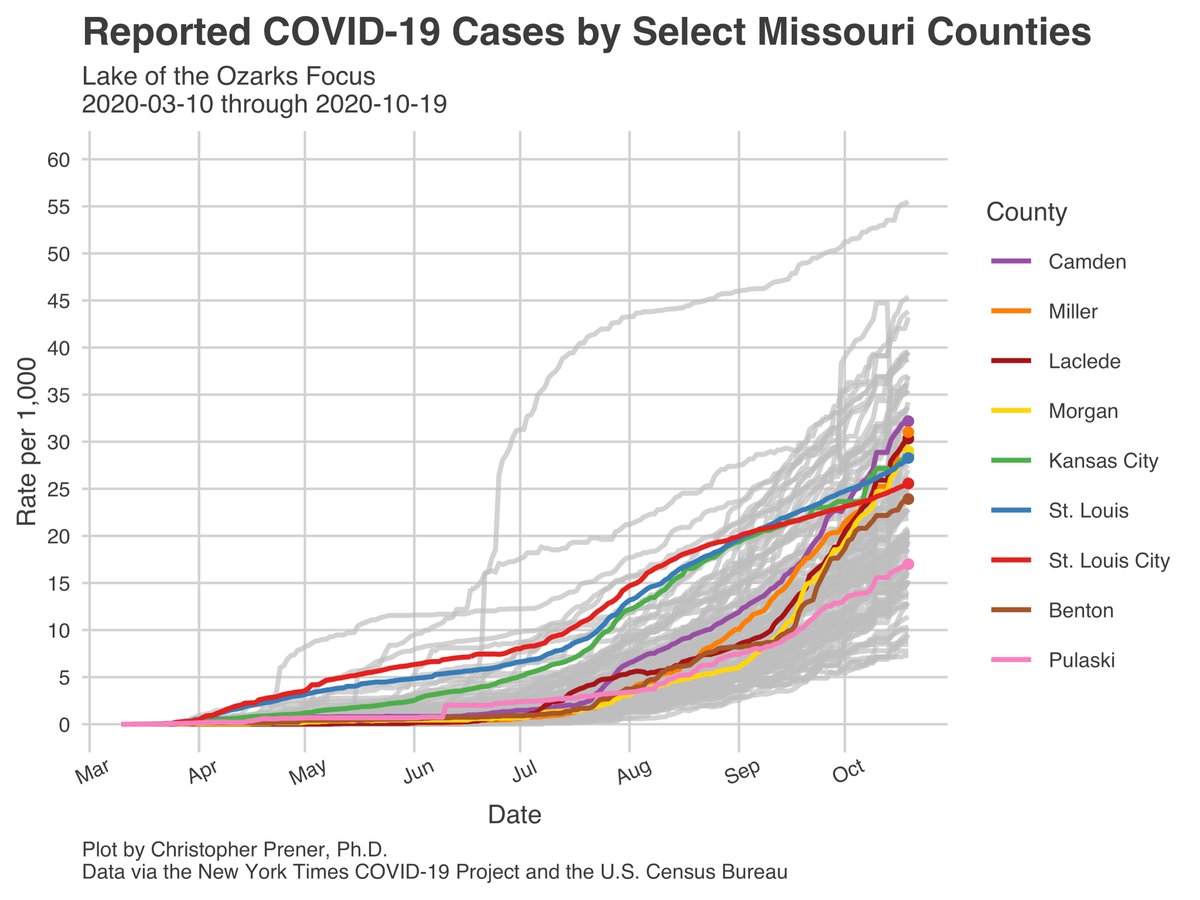
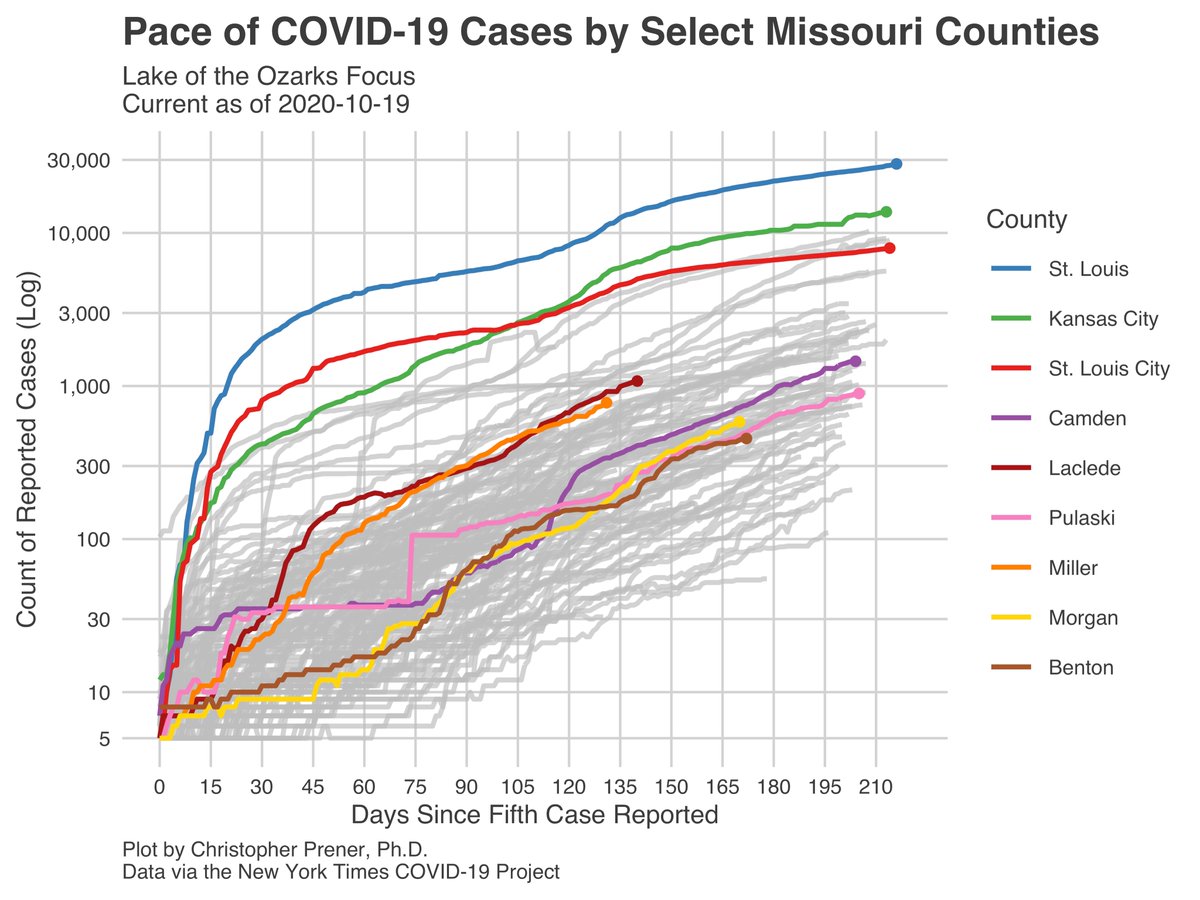
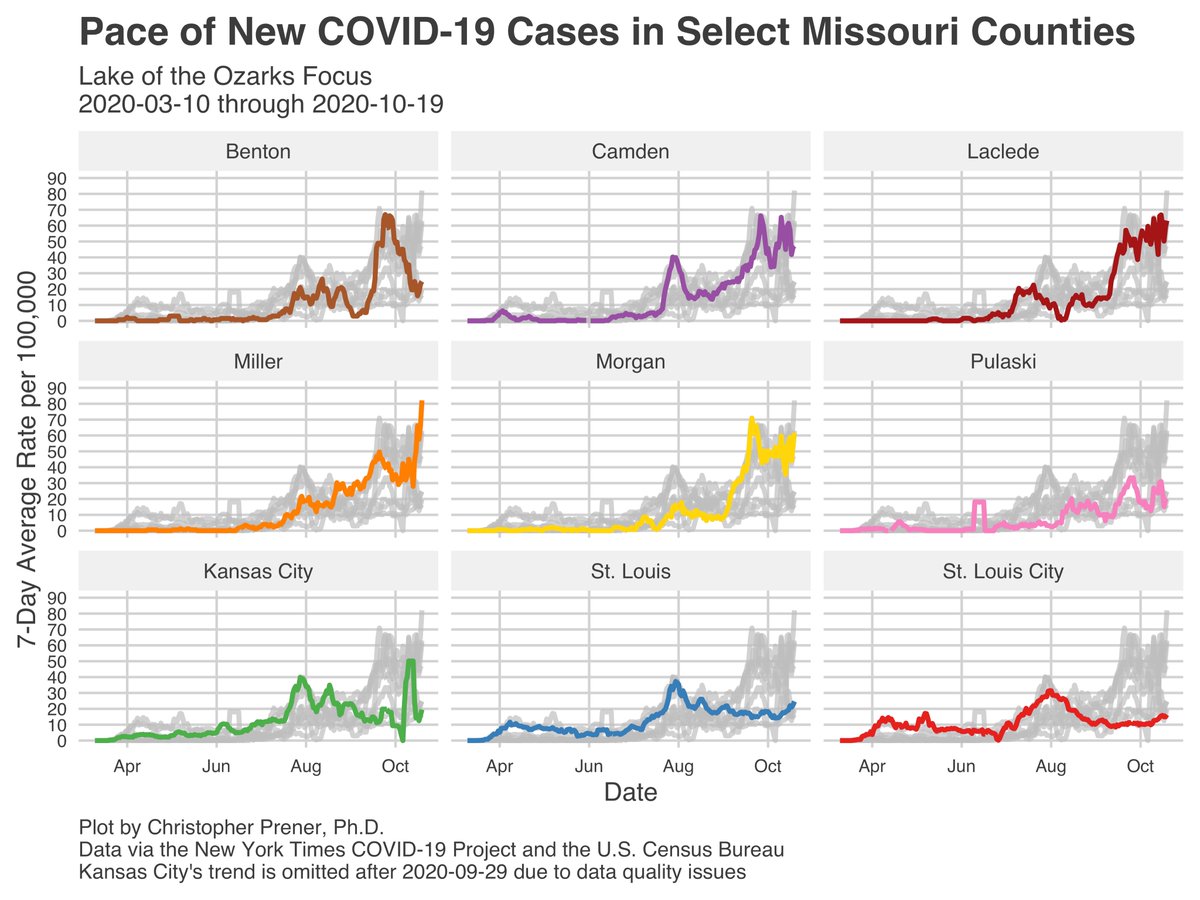
Around Lake of the Ozarks, the 7-day averages for Miller and Morgan remain concerning and look to be increases in cases as well. I’m less convinced by Laclede’s 7-day average, which is heavily influenced by 10/14. Again, we& #39;ll have better clarity on Thursday. 9/23
As in Greene County, these trends are placing incredible pressure on the hospital system in the region - Lake Regional Health System reported last Friday that a third of their in-patients at their hospital were there for COVID. 10/23 https://krcgtv.com/news/local/one-in-three-patients-positive-for-covid-19-at-lake-regional-health-system">https://krcgtv.com/news/loca...
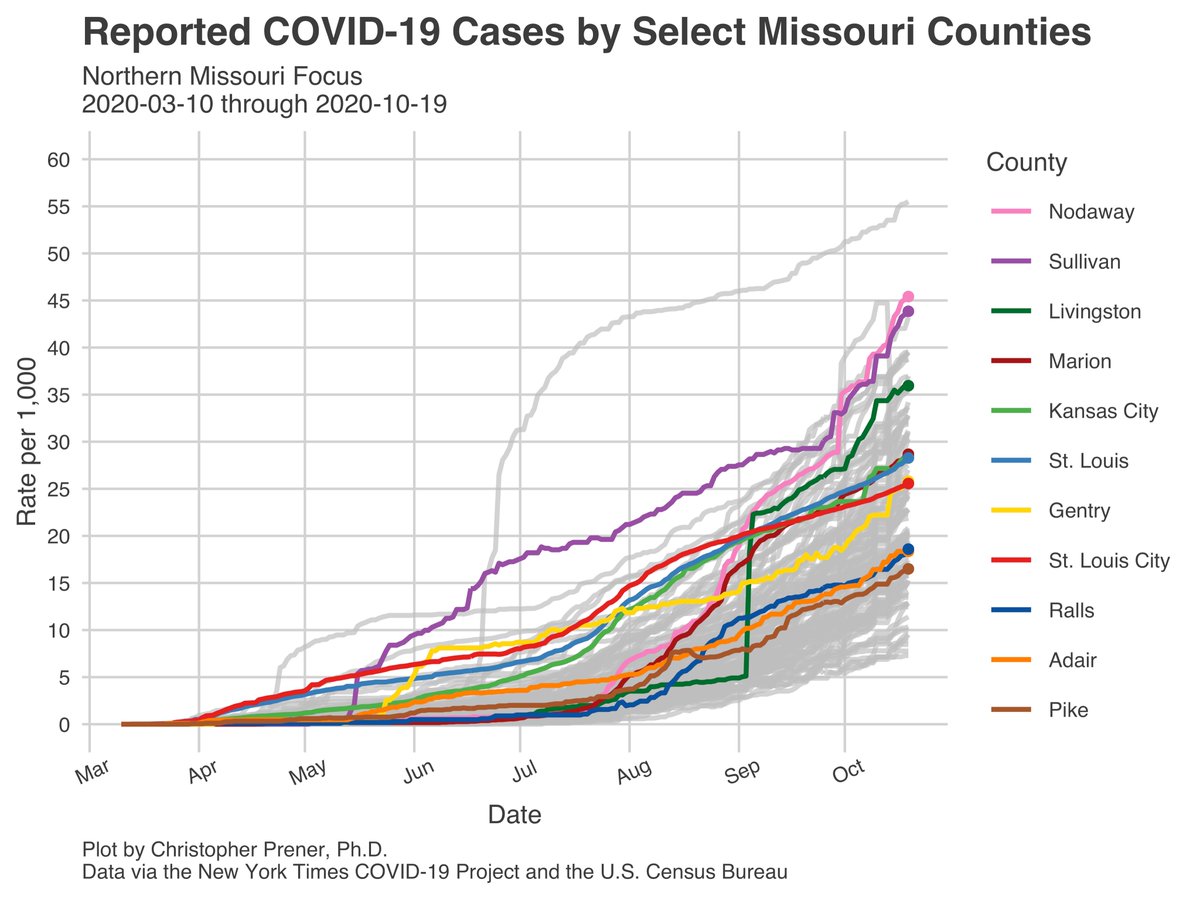
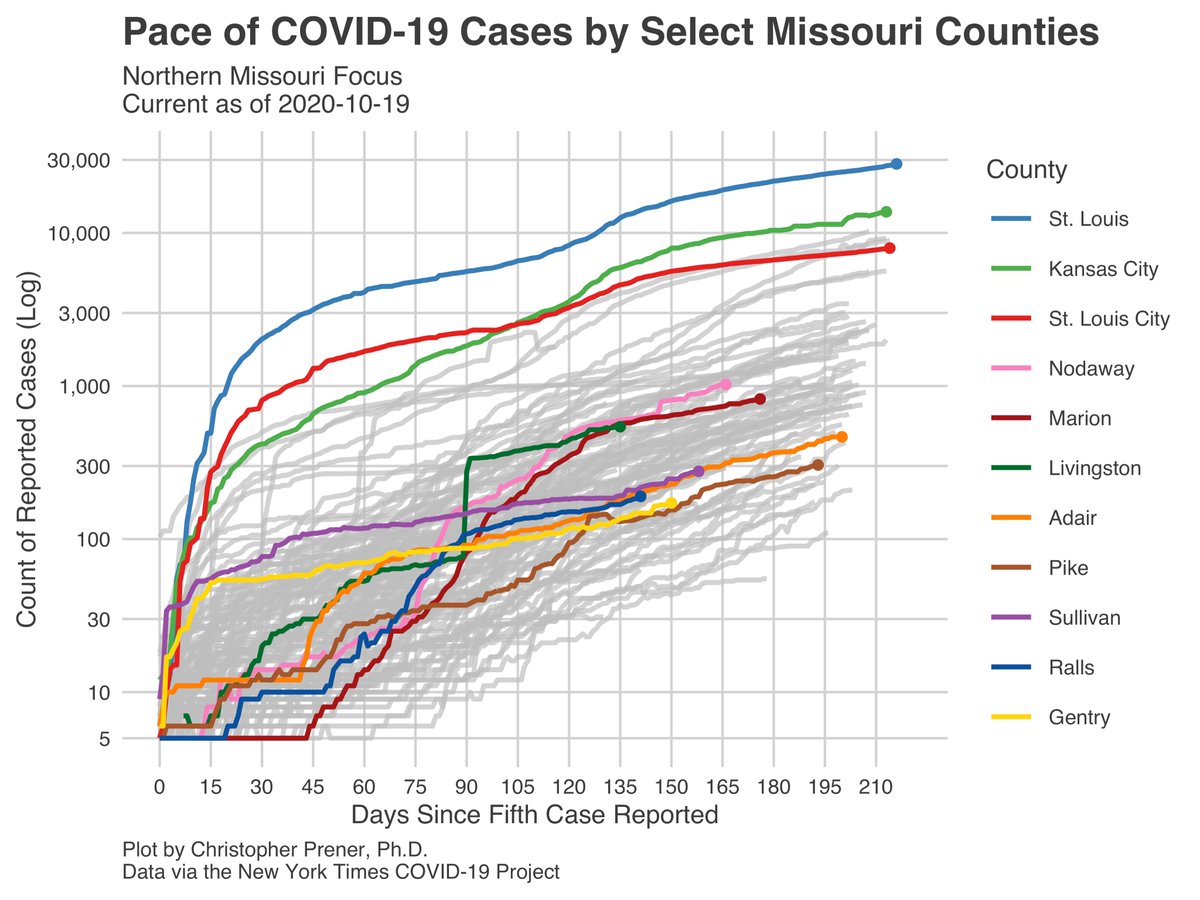
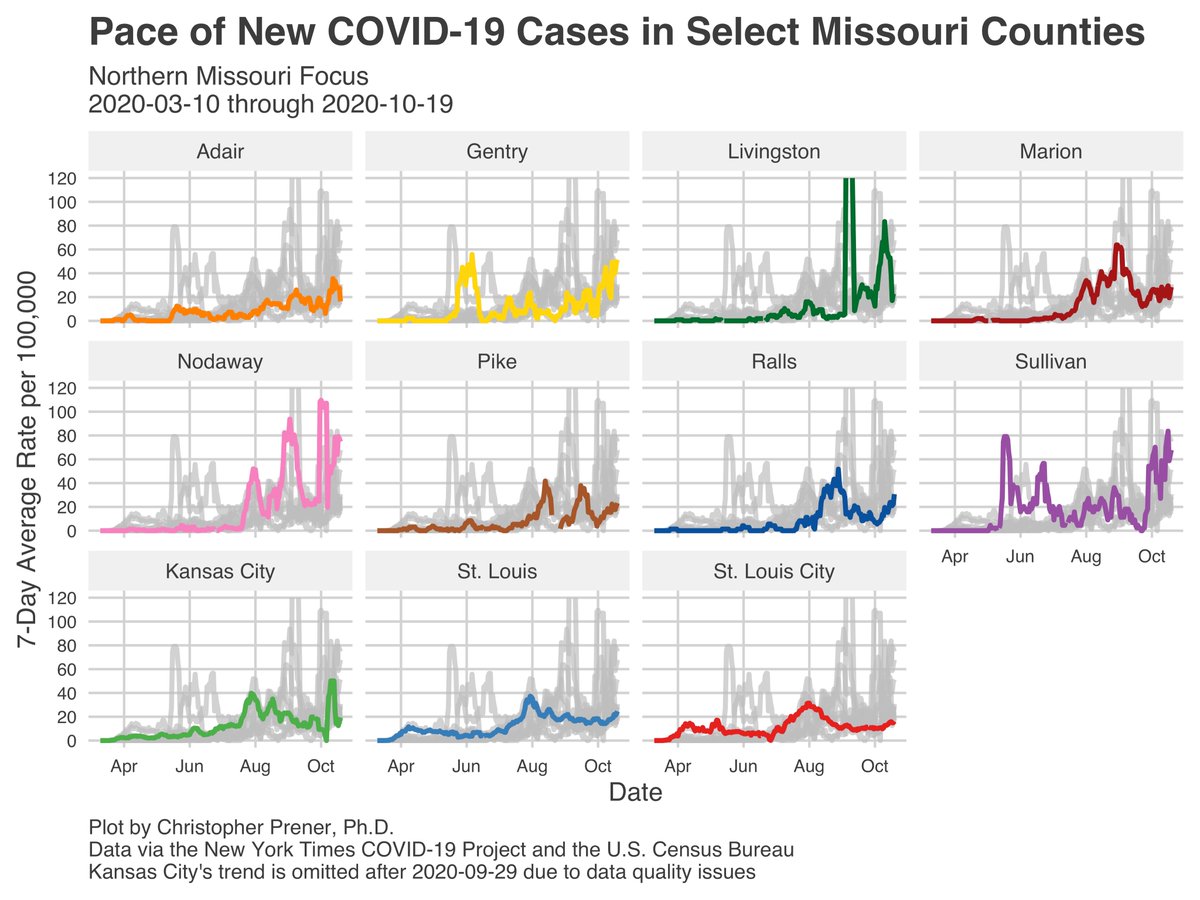
We’re also seeing jumps in 7-day averages in Northern MO, but the only county that seems to have a trend that is not just driven by noise from DHSS is Nodaway. Something to watch for Thursday, too. 11/23
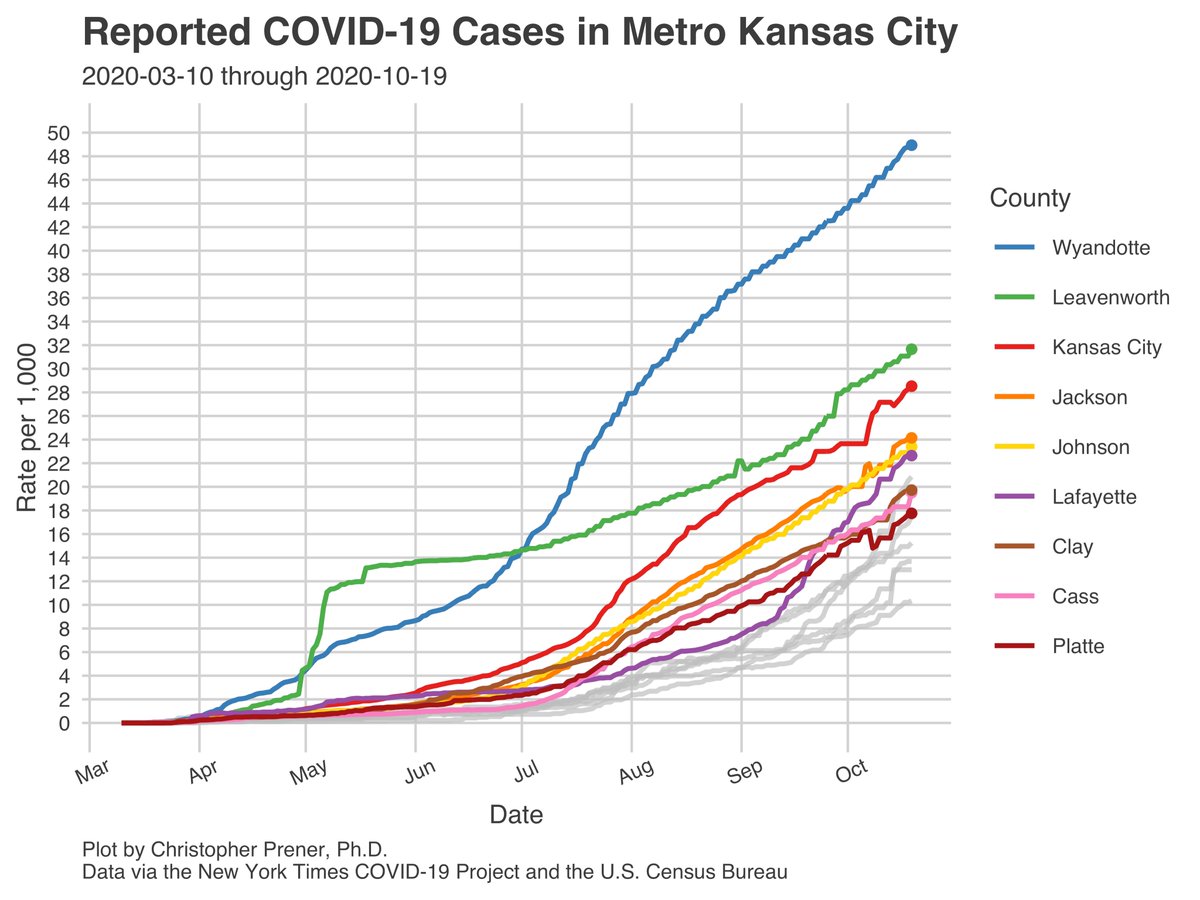
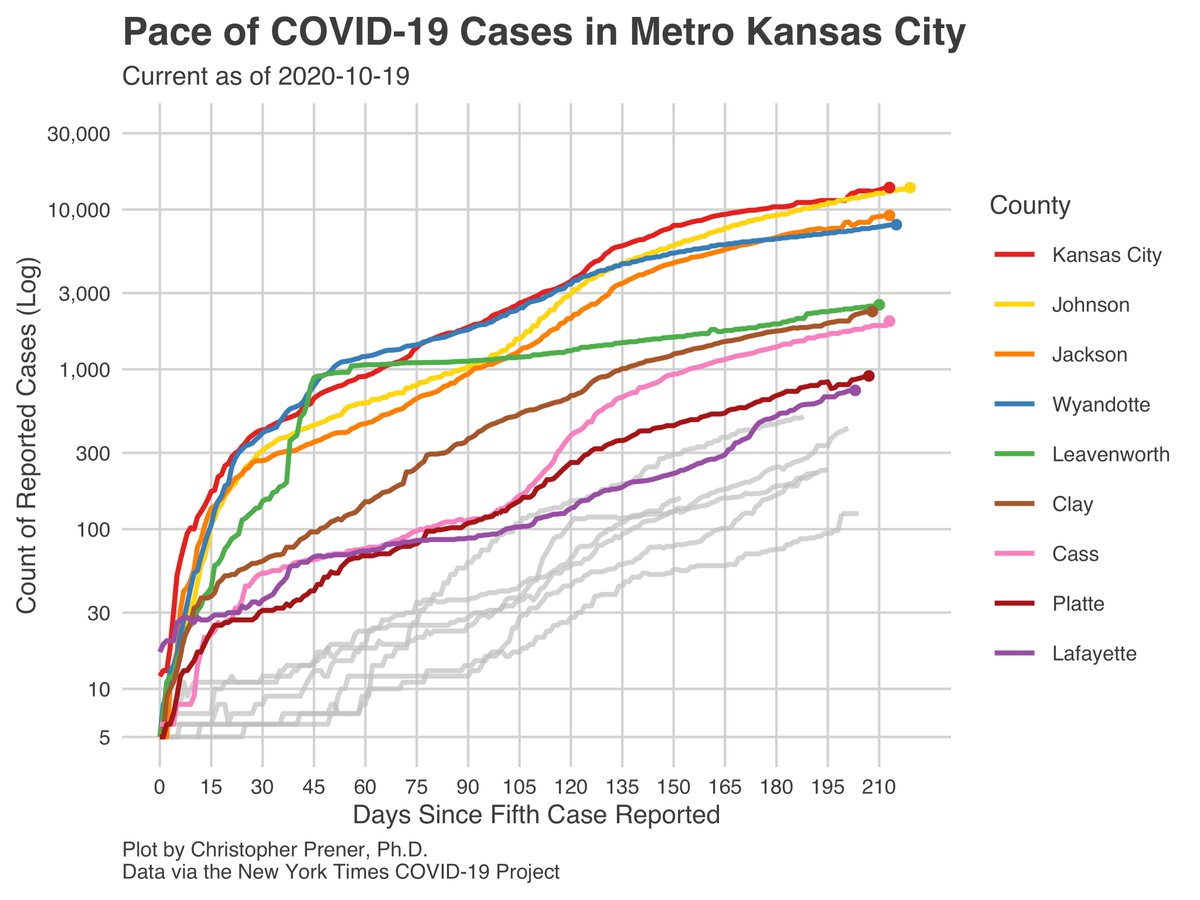
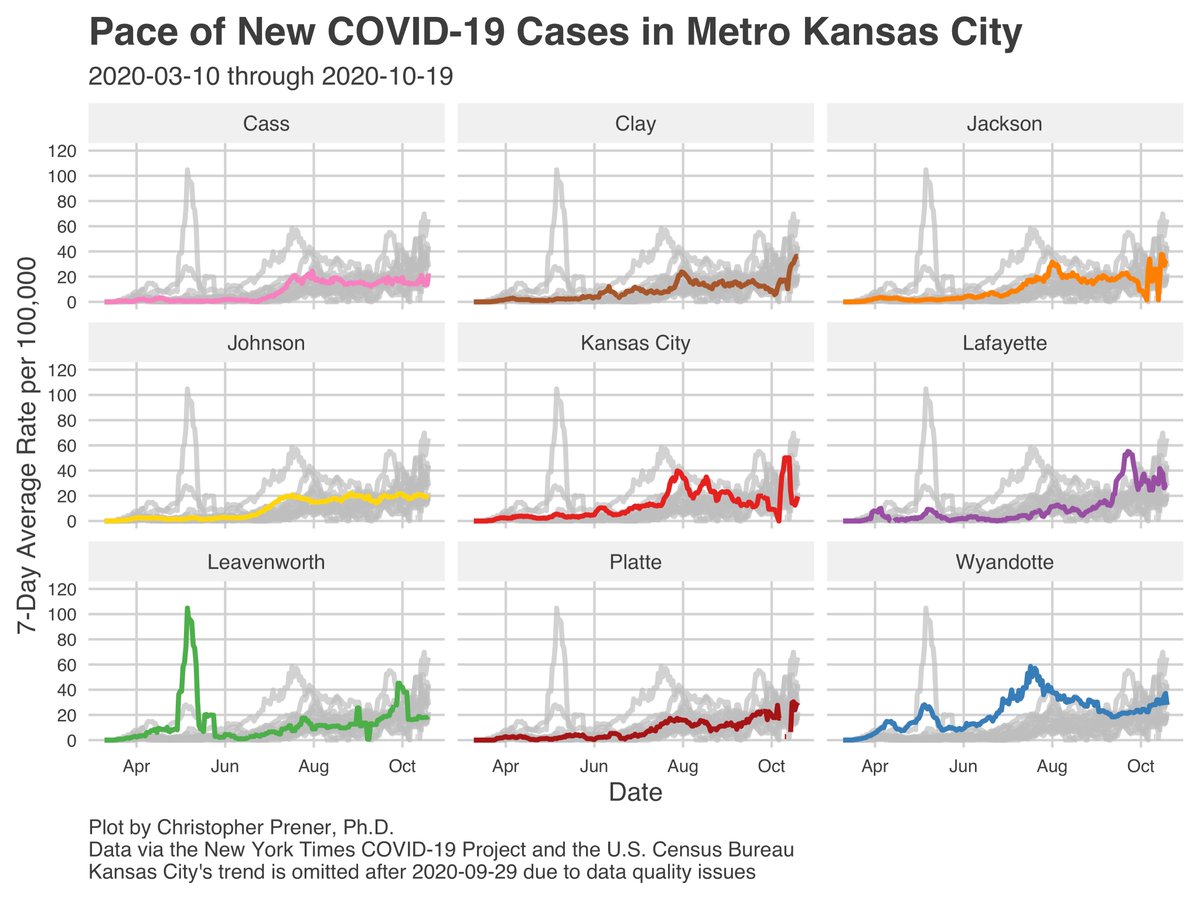
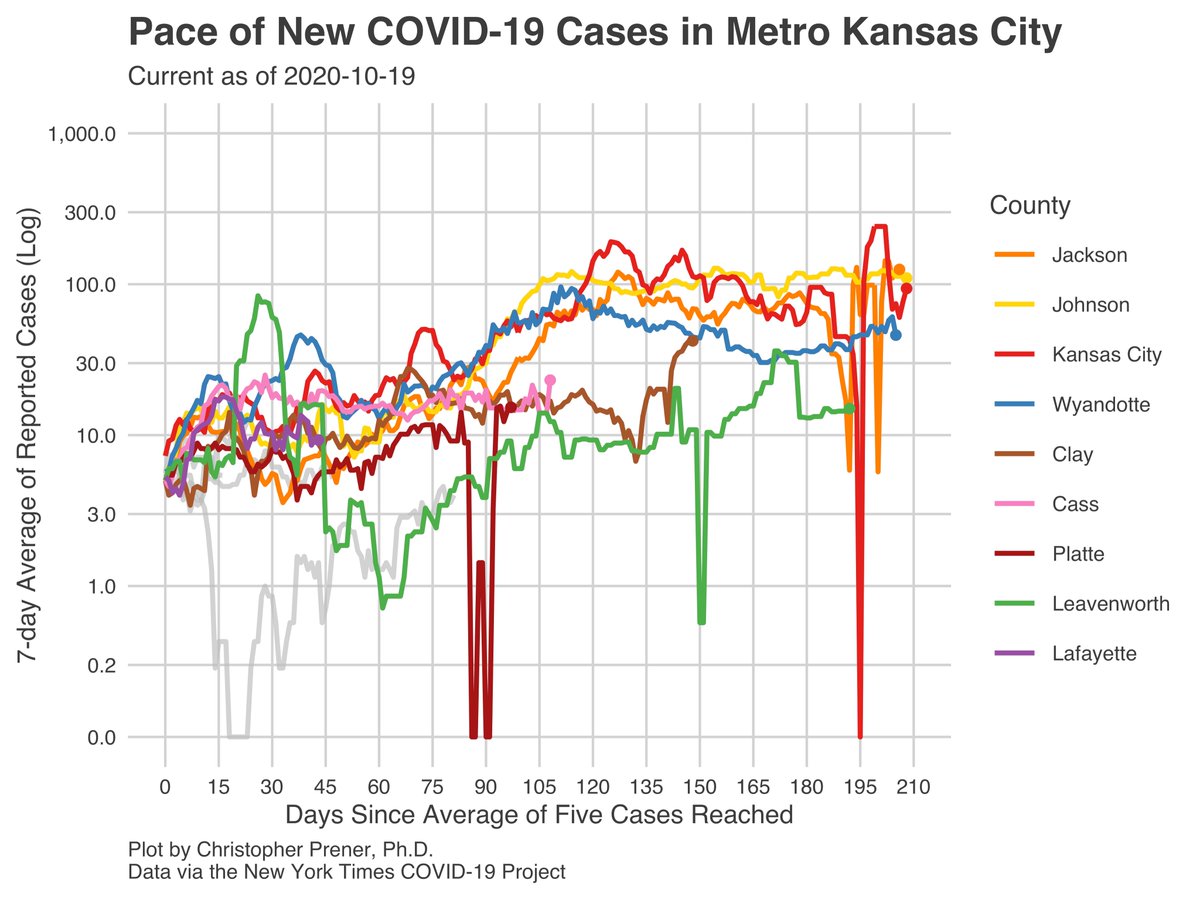
In #KansasCity, it is really hard to tell what is going on from the 7-day averages, but my gut check is that this is a real, sustained bump in cases that dates back several weeks. DHSS data issues make it hard to pick out, though. 12/23
Part of the reason I feel confident here  https://abs.twimg.com/emoji/v2/... draggable="false" alt="☝️" title="Zeigefinger nach oben" aria-label="Emoji: Zeigefinger nach oben"> is the effect we’re seeing on the hospital systems in KC. @annaspoerre reported for the @kcstar about inundation facilities saw in patients last week - St. Lukes described it as "bursting at the seams." 13/23 https://www.kansascity.com/news/coronavirus/article246478675.html">https://www.kansascity.com/news/coro...
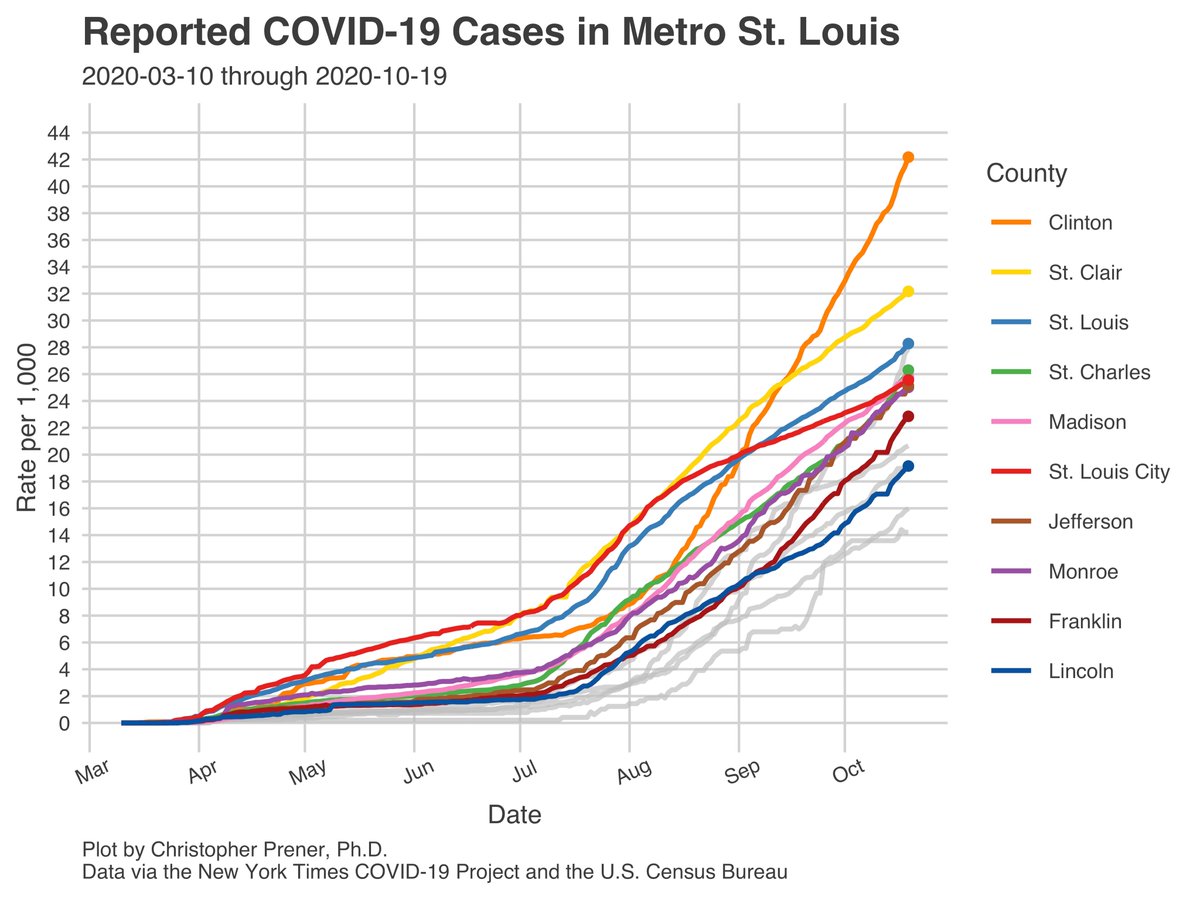
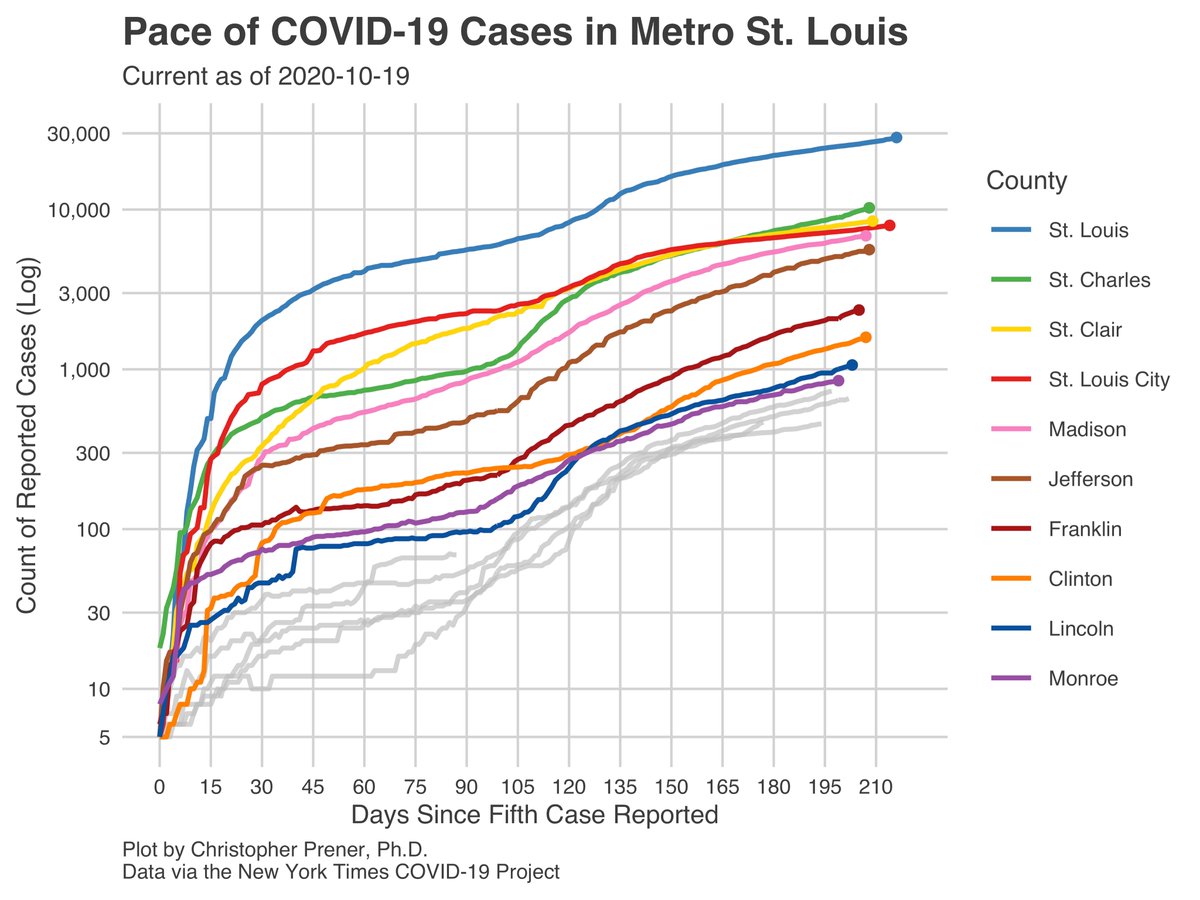
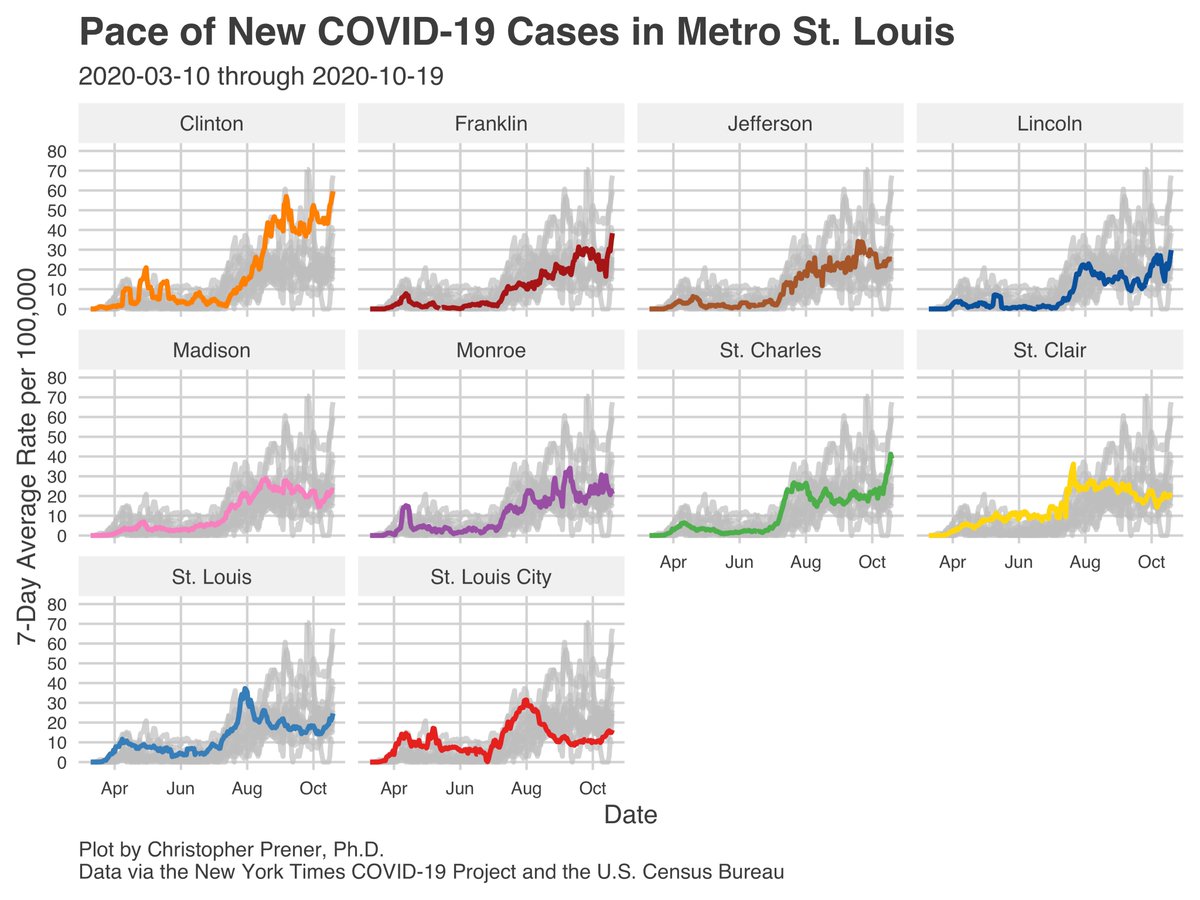
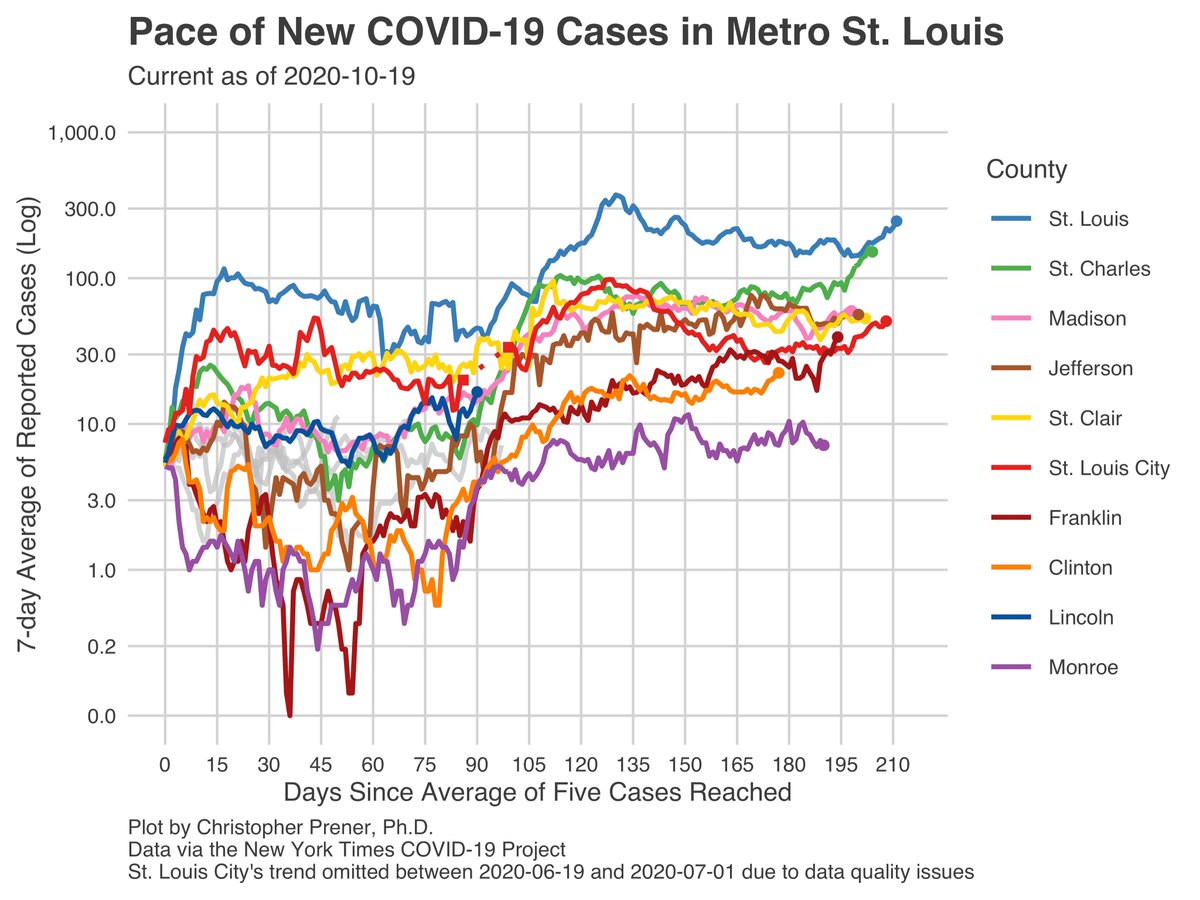
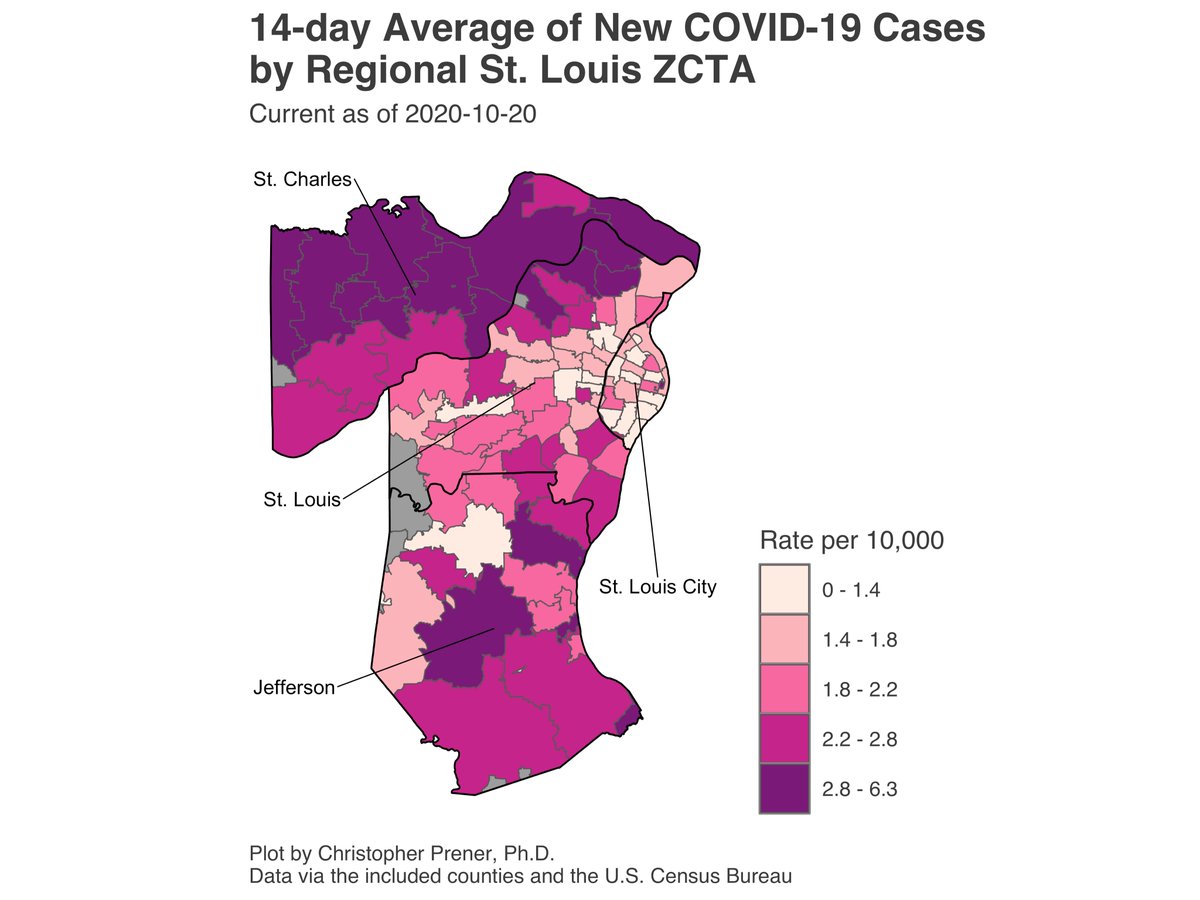
In #StLouis, we’re seeing some instability in 7-day averages still - Jefferson and Franklin counties in particular are still being affected by DHSS issues. The St. Charles spike, however, appears genuine. The City and the County are experiencing modest bumps, too. 14/23
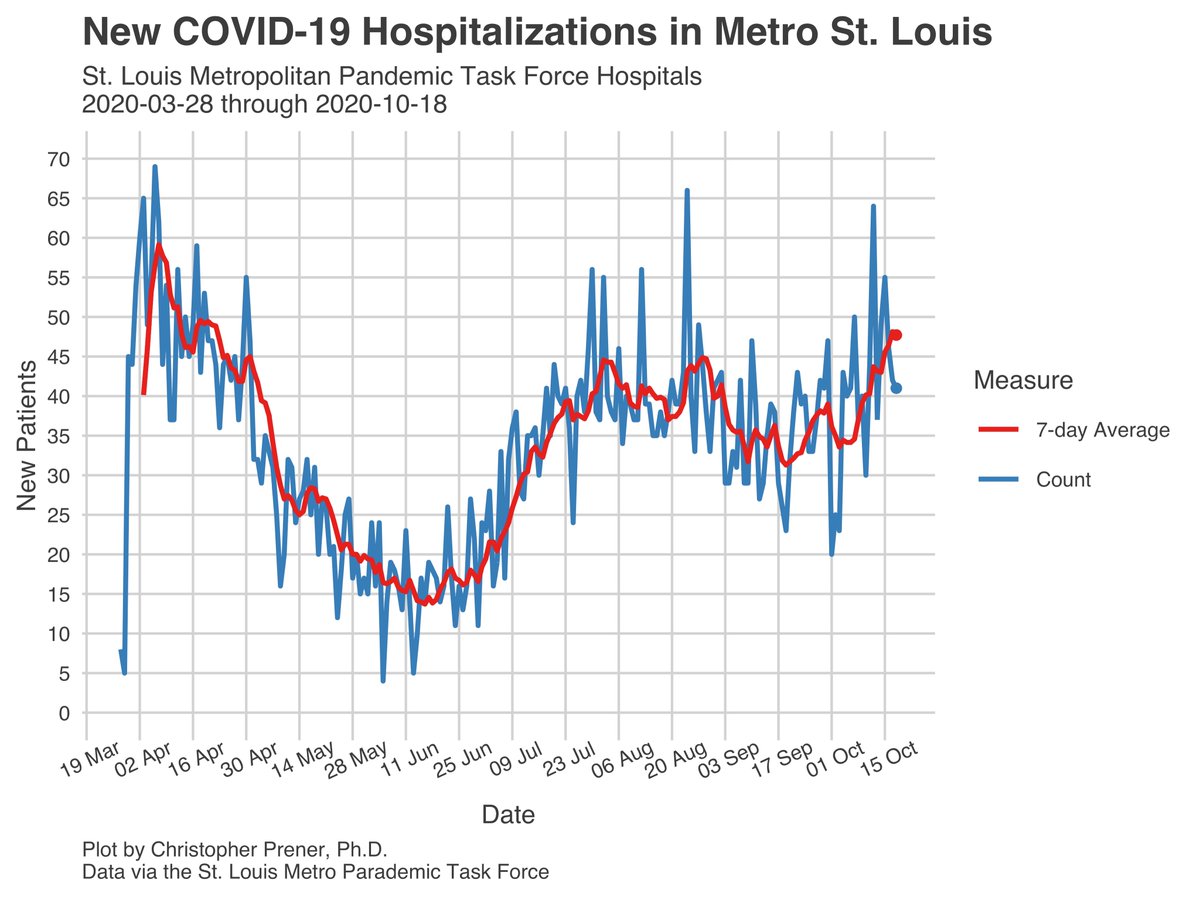
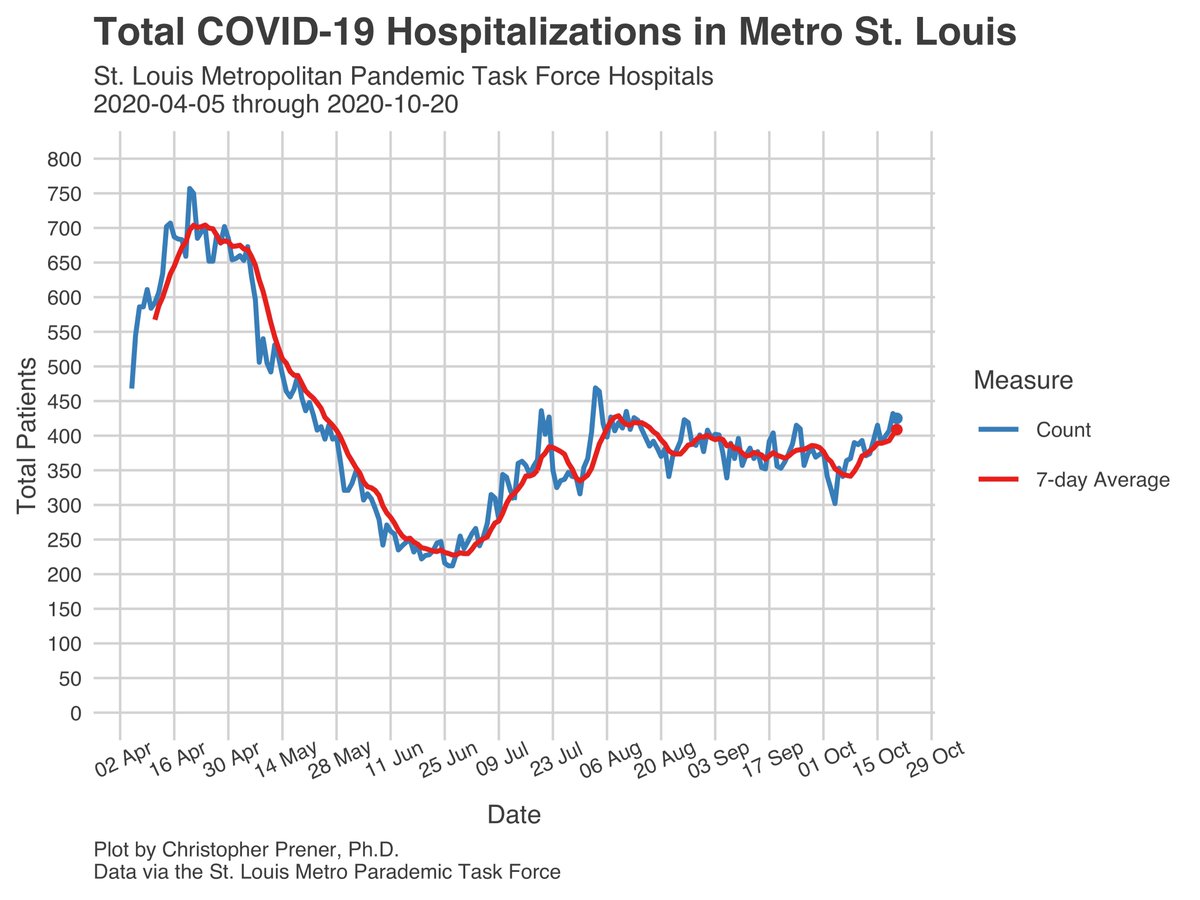
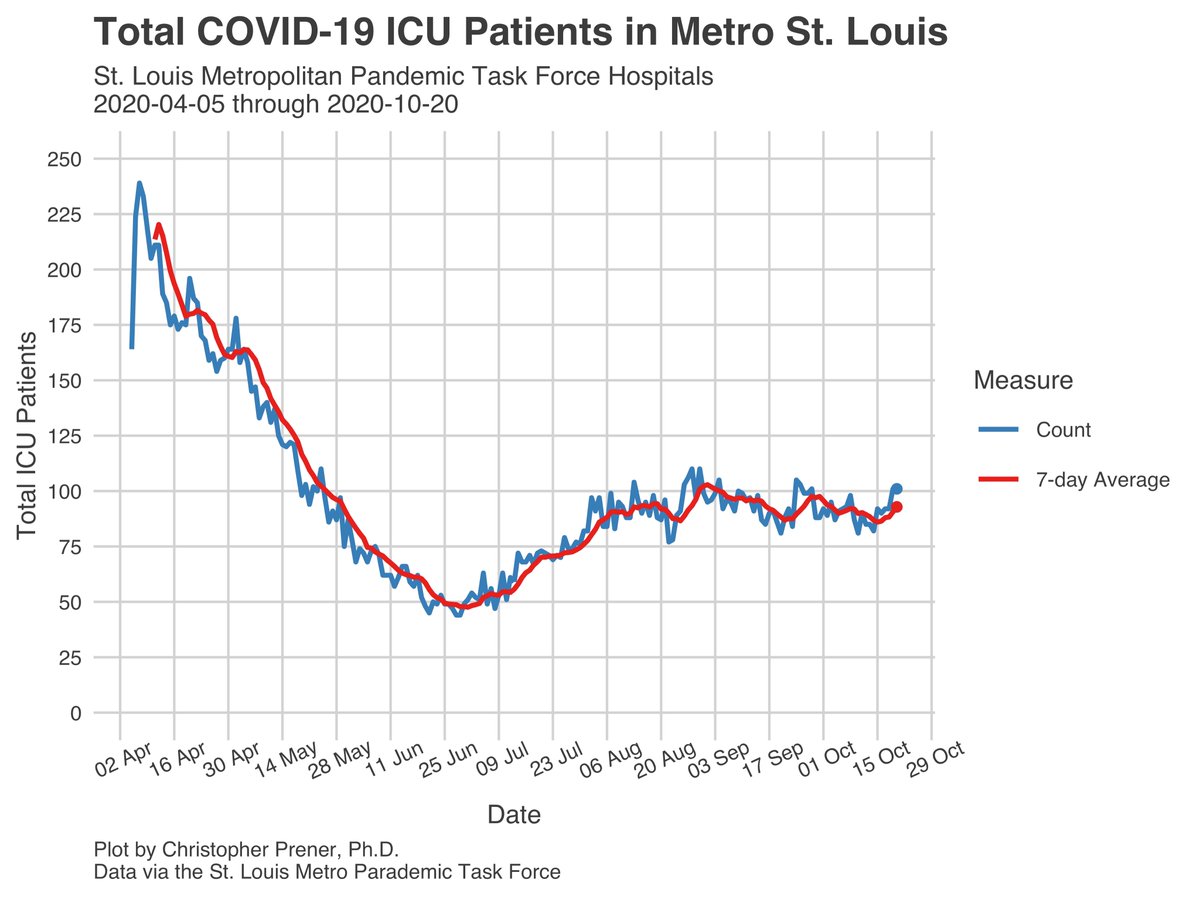
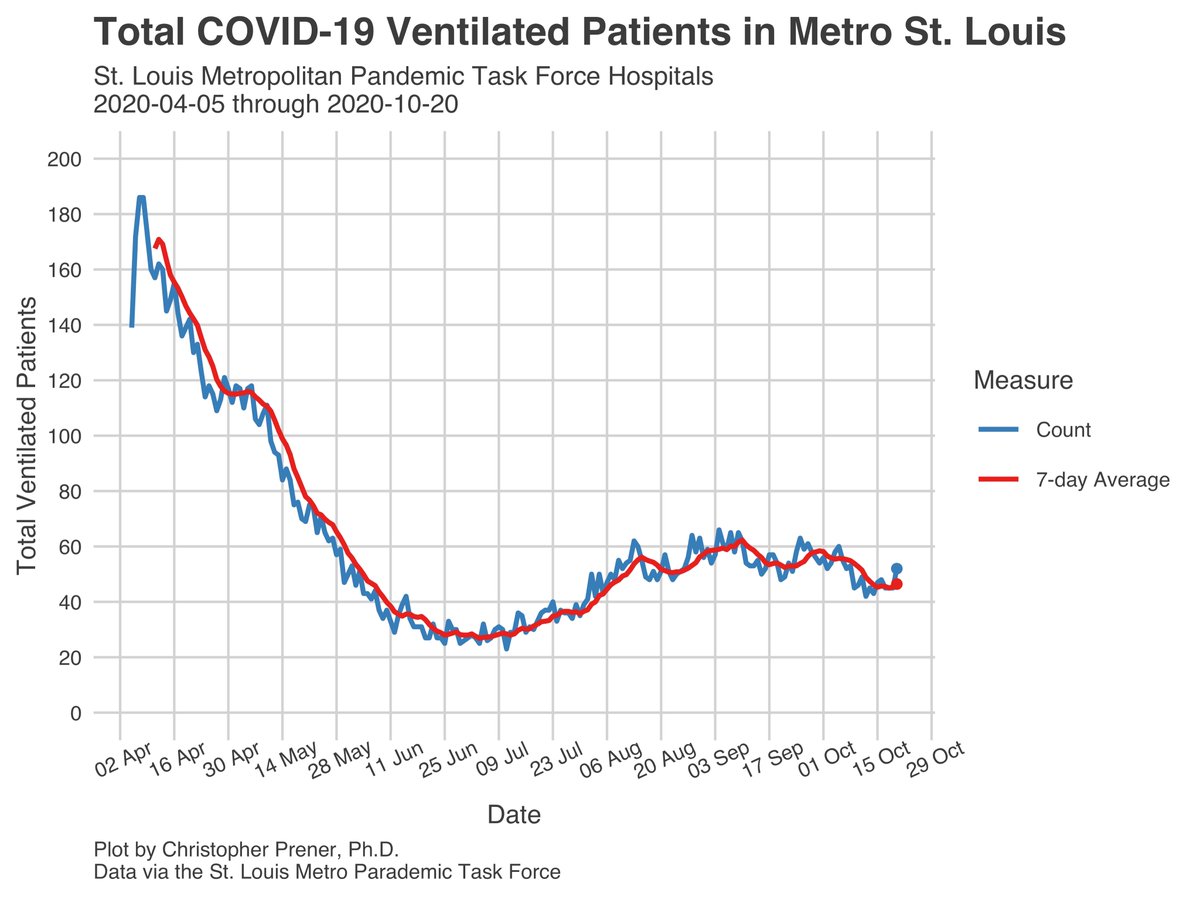
Like other regions, #StLouis is seeing its hospitals under increasing pressure, with Dr. Garza sounding alarm bells. Here it is being driven by patients from outside of the the City+County. We’re at April levels of new patients, and all three other metrics are rising. 15/23
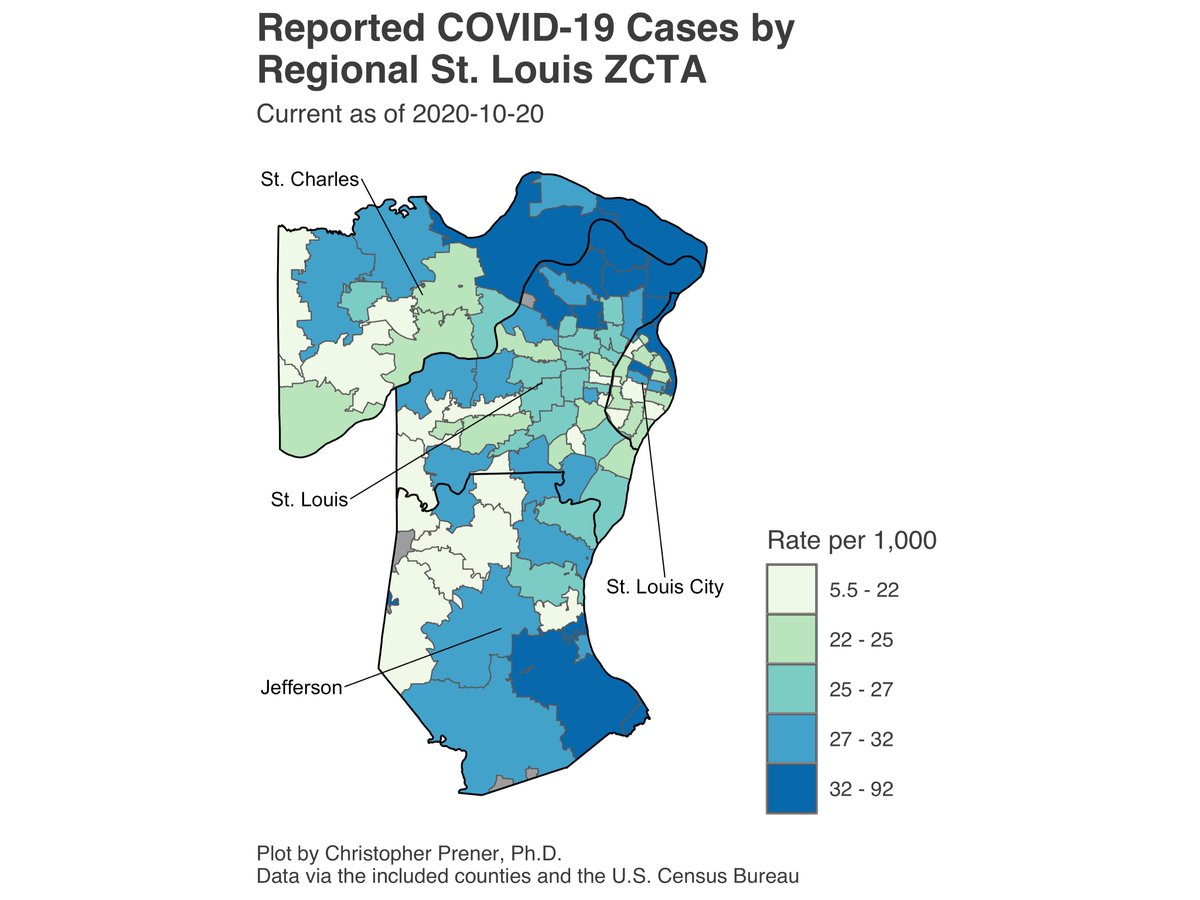
Another reason I feel confident in the St. Charles spike being genuine is their zip code data, which doesn’t come from DHSS - take a look at their 14-day averages (and those in JeffCo). 16/23
Longtime readers may notice that the colors assignments changed on these maps  https://abs.twimg.com/emoji/v2/... draggable="false" alt="☝️" title="Zeigefinger nach oben" aria-label="Emoji: Zeigefinger nach oben">. There are a couple extreme outliners that my previous algorithm (Fisher) was getting hung up on, so I am now using quantile brakes for these two maps. 17/23
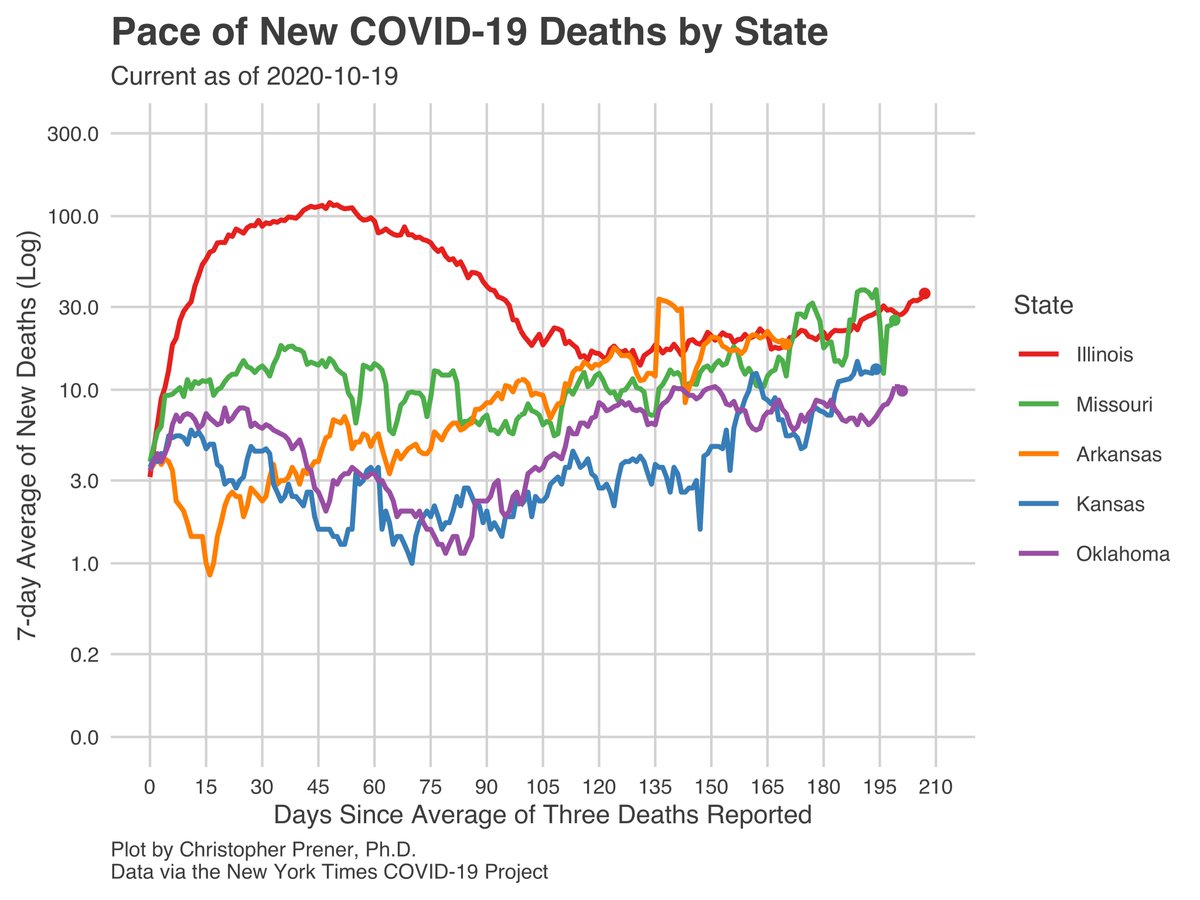
The state has just open sourced a bit of their data, allowing us to track deaths based on date of death and not the state report date (which are often very different). I’ll be digging into these, and their newly released testing data, soon. 19/23
Thanks for your patience as I took a much-needed long weekend over the past few days. I’m going to take breaks at least once a month through January over the upcoming holidays. As with last weekend, background data collection will continue even if I pause updates. 20/23
Also, the second edition of my #COVID19 focused newsletter, “River City Data,” came out Friday. My interview was with @lonesometoast, who talked to me about COVID recovery and pandemic parenting. Check it out and sign-up for future issues  https://abs.twimg.com/emoji/v2/... draggable="false" alt="👇" title="Rückhand Zeigefinger nach unten" aria-label="Emoji: Rückhand Zeigefinger nach unten">! 21/23 https://chrisprener.substack.com/p/weekly-covid-19-round-up-101620">https://chrisprener.substack.com/p/weekly-...
My standard caveats about uncertainty - infections (1) are historical data that reflect infections 2-3 weeks ago, (2) are biased by testing patterns, (3) may include probable but unconfirmed cases in some counties, and (4) rates are not individual probabilities of illness. 22/23
Additional maps and plots are on my tracking site - https://slu-opengis.github.io/covid_daily_viz/.">https://slu-opengis.github.io/covid_dai...
Next https://abs.twimg.com/emoji/v2/... draggable="false" alt="🧵" title="Thread" aria-label="Emoji: Thread"> will be Thursday, 10/22. Knock on wood, if we don& #39;t have additional data instability, we& #39;ll have our clearest picture since 9/28 of COVID trends in MO. It& #39;s been awhile...
23/23
Next
23/23

 Read on Twitter
 for Tuesday, 10/20. My website has been fully updated - https://slu-opengis.github.io/covid_dai... 7-day averages statewide and within the meso regions are all concerning, but they still include the large dump of cases on 10/14. 1/23" title="This is my #Missouri #COVID19 evening update https://abs.twimg.com/emoji/v2/... draggable="false" alt="🧵" title="Thread" aria-label="Emoji: Thread"> for Tuesday, 10/20. My website has been fully updated - https://slu-opengis.github.io/covid_dai... 7-day averages statewide and within the meso regions are all concerning, but they still include the large dump of cases on 10/14. 1/23">
 for Tuesday, 10/20. My website has been fully updated - https://slu-opengis.github.io/covid_dai... 7-day averages statewide and within the meso regions are all concerning, but they still include the large dump of cases on 10/14. 1/23" title="This is my #Missouri #COVID19 evening update https://abs.twimg.com/emoji/v2/... draggable="false" alt="🧵" title="Thread" aria-label="Emoji: Thread"> for Tuesday, 10/20. My website has been fully updated - https://slu-opengis.github.io/covid_dai... 7-day averages statewide and within the meso regions are all concerning, but they still include the large dump of cases on 10/14. 1/23">
 for Tuesday, 10/20. My website has been fully updated - https://slu-opengis.github.io/covid_dai... 7-day averages statewide and within the meso regions are all concerning, but they still include the large dump of cases on 10/14. 1/23" title="This is my #Missouri #COVID19 evening update https://abs.twimg.com/emoji/v2/... draggable="false" alt="🧵" title="Thread" aria-label="Emoji: Thread"> for Tuesday, 10/20. My website has been fully updated - https://slu-opengis.github.io/covid_dai... 7-day averages statewide and within the meso regions are all concerning, but they still include the large dump of cases on 10/14. 1/23">
 for Tuesday, 10/20. My website has been fully updated - https://slu-opengis.github.io/covid_dai... 7-day averages statewide and within the meso regions are all concerning, but they still include the large dump of cases on 10/14. 1/23" title="This is my #Missouri #COVID19 evening update https://abs.twimg.com/emoji/v2/... draggable="false" alt="🧵" title="Thread" aria-label="Emoji: Thread"> for Tuesday, 10/20. My website has been fully updated - https://slu-opengis.github.io/covid_dai... 7-day averages statewide and within the meso regions are all concerning, but they still include the large dump of cases on 10/14. 1/23">
