In the past day, 2,015 new cases have been reported in Ohio, and our numbers continue to rise at a rate that should concern all of us. 216 new hospitalizations were reported in the past 24 hours – the highest number of hospitalizations ever reported in a 24-hour period in Ohio.
Here is the full list of all 88 counties by case rate per 100,000 population. Shaded in blue are the counties (69 of 88) that meet @CDCgov& #39;s definition of High Incidence. #COVID19 is running rampant in some of these counties.
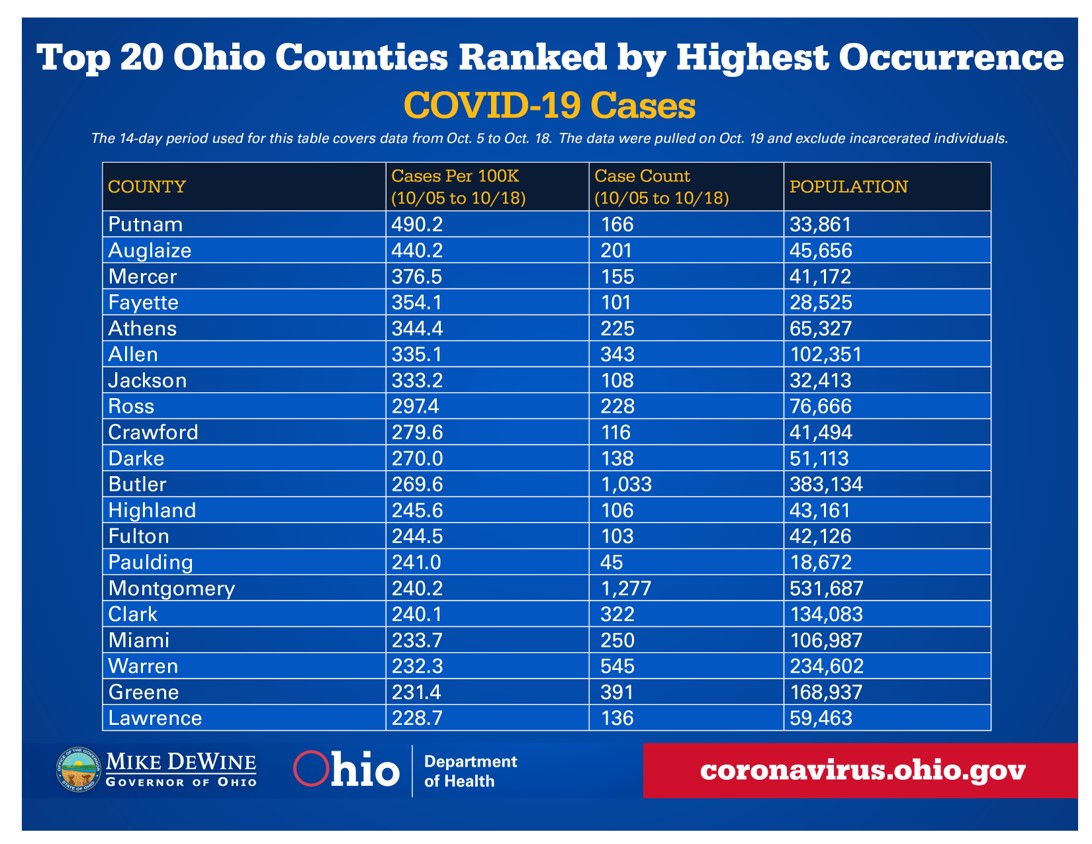
Ohio’s top 20 counties with the highest case rate per 100,000 population. These are shocking numbers. We must remember that these numbers will not change unless we change.
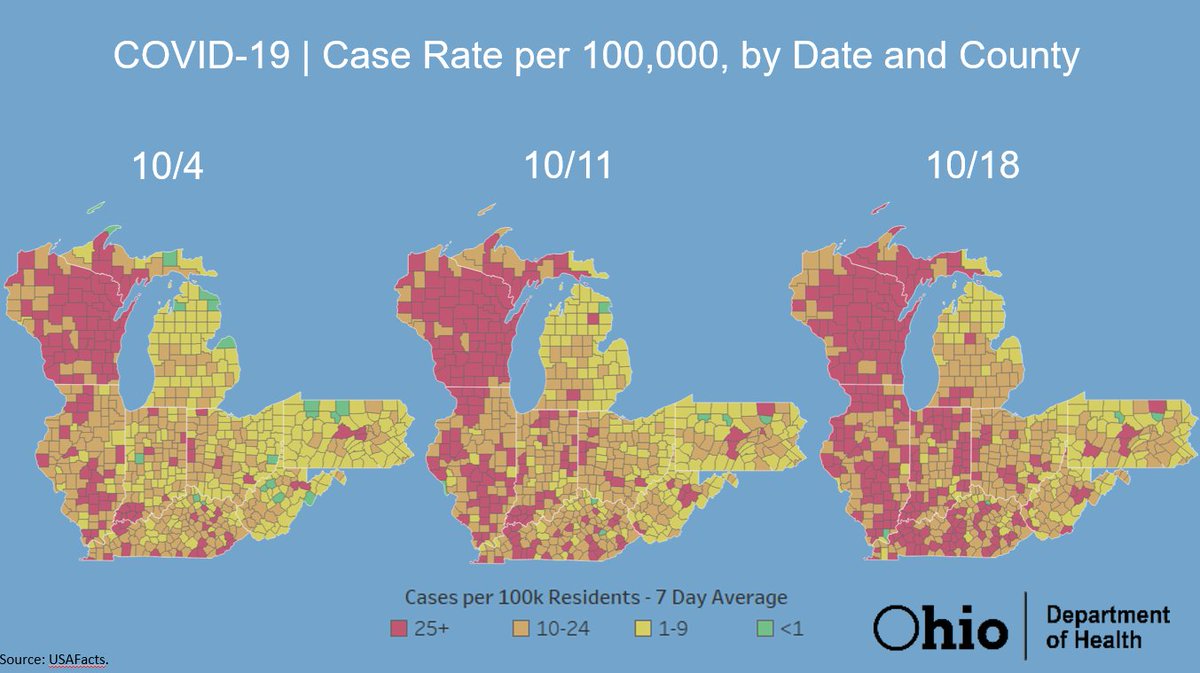
Neighboring States  https://abs.twimg.com/emoji/v2/... draggable="false" alt="➡" title="Pfeil nach rechts" aria-label="Emoji: Pfeil nach rechts"> Over the past 3 weeks, this chart shows how cases have increased throughout the Midwest. Green and yellow counties have relatively low case rates, while orange and red counties have higher case rates. There is spread between states and between counties.

 Read on Twitter


 Over the past 3 weeks, this chart shows how cases have increased throughout the Midwest. Green and yellow counties have relatively low case rates, while orange and red counties have higher case rates. There is spread between states and between counties." title="Neighboring States https://abs.twimg.com/emoji/v2/... draggable="false" alt="➡" title="Pfeil nach rechts" aria-label="Emoji: Pfeil nach rechts"> Over the past 3 weeks, this chart shows how cases have increased throughout the Midwest. Green and yellow counties have relatively low case rates, while orange and red counties have higher case rates. There is spread between states and between counties." class="img-responsive" style="max-width:100%;"/>


