𝟏 A  https://abs.twimg.com/emoji/v2/... draggable="false" alt="🧵" title="Thread" aria-label="Emoji: Thread"> on:
 https://abs.twimg.com/emoji/v2/... draggable="false" alt="🔸" title="Kleine orangene Raute" aria-label="Emoji: Kleine orangene Raute"> Reverse Transcription-quantitative Polymerase Chain Reaction (RT-qPCR) currently used to detect #SARSCoV2
 https://abs.twimg.com/emoji/v2/... draggable="false" alt="🔸" title="Kleine orangene Raute" aria-label="Emoji: Kleine orangene Raute">Cycle Threshold (CT) & what it means
#scicomm #COVID19
#scicomm #COVID19
𝟐 RT-qPCR is a common lab technique used to convert RNA to DNA & quantify its amount.
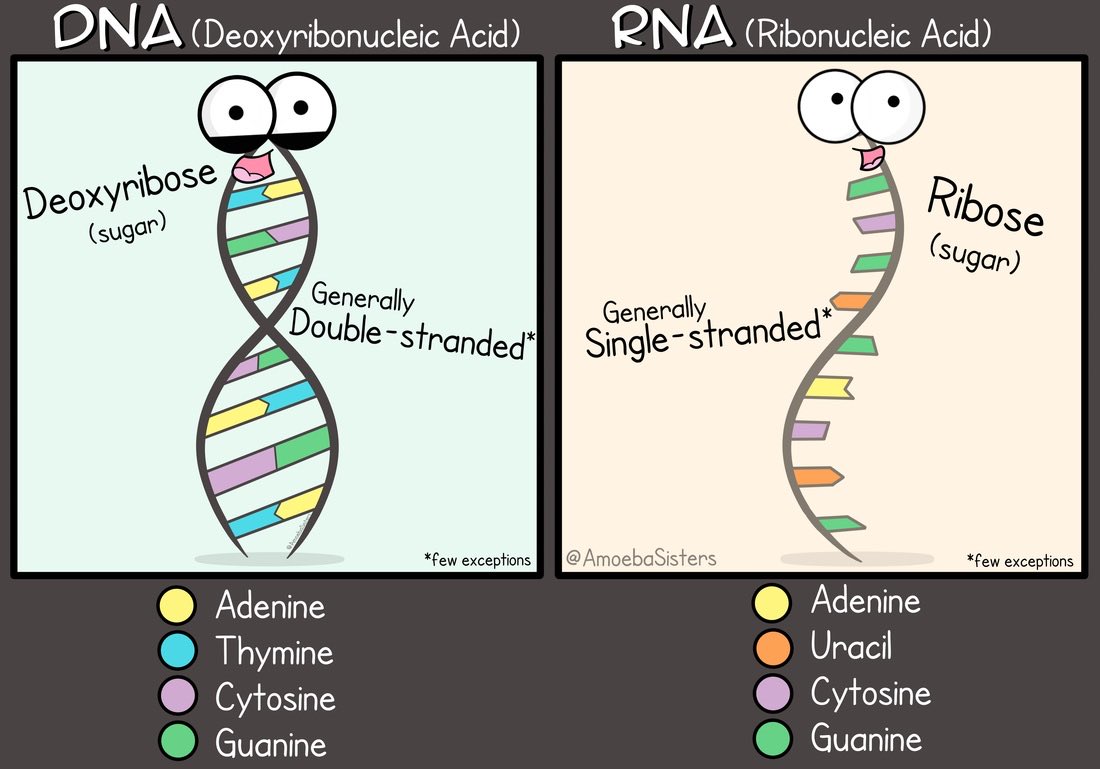
DNA & RNA are two forms of genetic material: DNA is like the mother code, while the RNA is a transcribed copy of (often) a segment of this mother code.
DNA & RNA are two forms of genetic material: DNA is like the mother code, while the RNA is a transcribed copy of (often) a segment of this mother code.
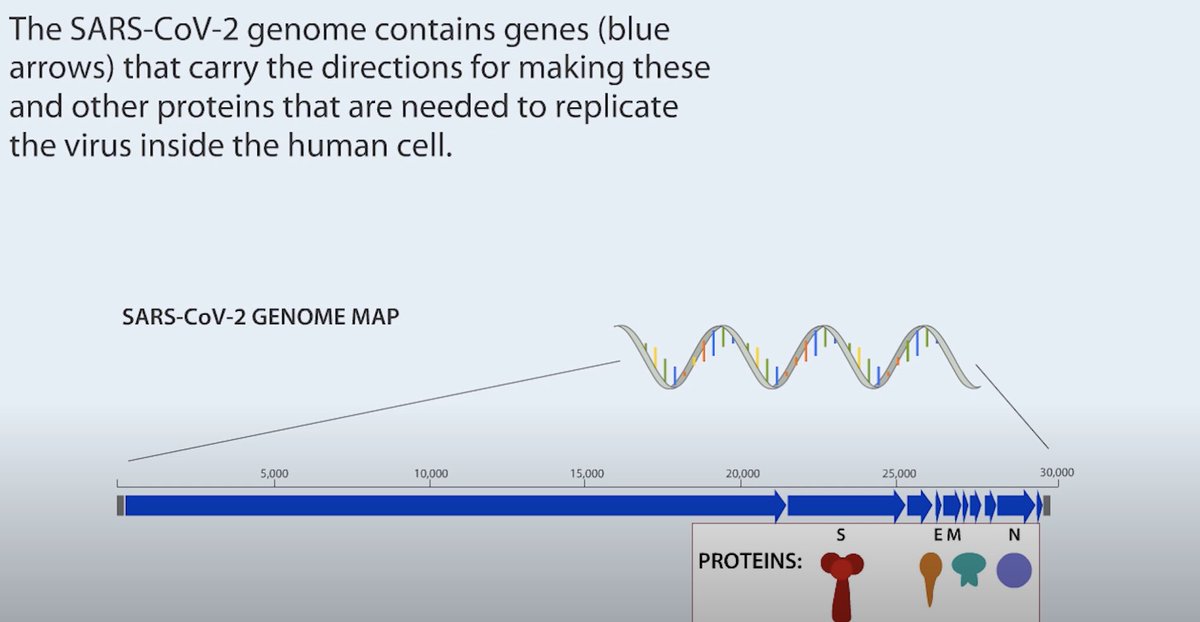
𝟑 #COVID19 virus contains this transcribed form (RNA) wrapped in a protective protein capsule
To detect its presence in cells we collect a swab from a person suspected to be infected w/ the virus.
Note: swab will contain human, viral & other microbes’ particles
To detect its presence in cells we collect a swab from a person suspected to be infected w/ the virus.
Note: swab will contain human, viral & other microbes’ particles
𝟒 First, we need to reverse transcribe (reverse copy) whatever RNA we have collected using the swab into DNA. This step is necessary because:
 https://abs.twimg.com/emoji/v2/... draggable="false" alt="🔸" title="Kleine orangene Raute" aria-label="Emoji: Kleine orangene Raute">DNA is a lot more stable than RNA to work with in the lab.
 https://abs.twimg.com/emoji/v2/... draggable="false" alt="🔸" title="Kleine orangene Raute" aria-label="Emoji: Kleine orangene Raute">Methods we have for amplification of genetic material work on DNA only.
𝟓 The next step is to amplify this reverse transcribed DNA. This allows us to identify whether #SARSCoV2 genome was present in the swab sample & quantify its amount.
But 1st we need to make sure that we’re amplifying only the #SASRCoV2 DNA & nothing else.
But 1st we need to make sure that we’re amplifying only the #SASRCoV2 DNA & nothing else.
𝟔 Using other genetic methods we know the genetic code of #SASRCoV2, this allows us to design stickers (primers) that are so specific they will be able to find and stick to particular segments of the reverse transcribed viral DNA & act as a guide to copy its entire length.
𝟕 The process of using specific stickers to copy the entire length of the viral DNA over and over again is called Polymerase Chain Reaction (PCR).
PCR doubles the amount of DNA in each cycle.
Typically we run the PCR for ~35-40 cycles https://abs.twimg.com/emoji/v2/... draggable="false" alt="➡️" title="Pfeil nach rechts" aria-label="Emoji: Pfeil nach rechts"> end up with 35-40 billion DNA molecules
PCR doubles the amount of DNA in each cycle.
Typically we run the PCR for ~35-40 cycles
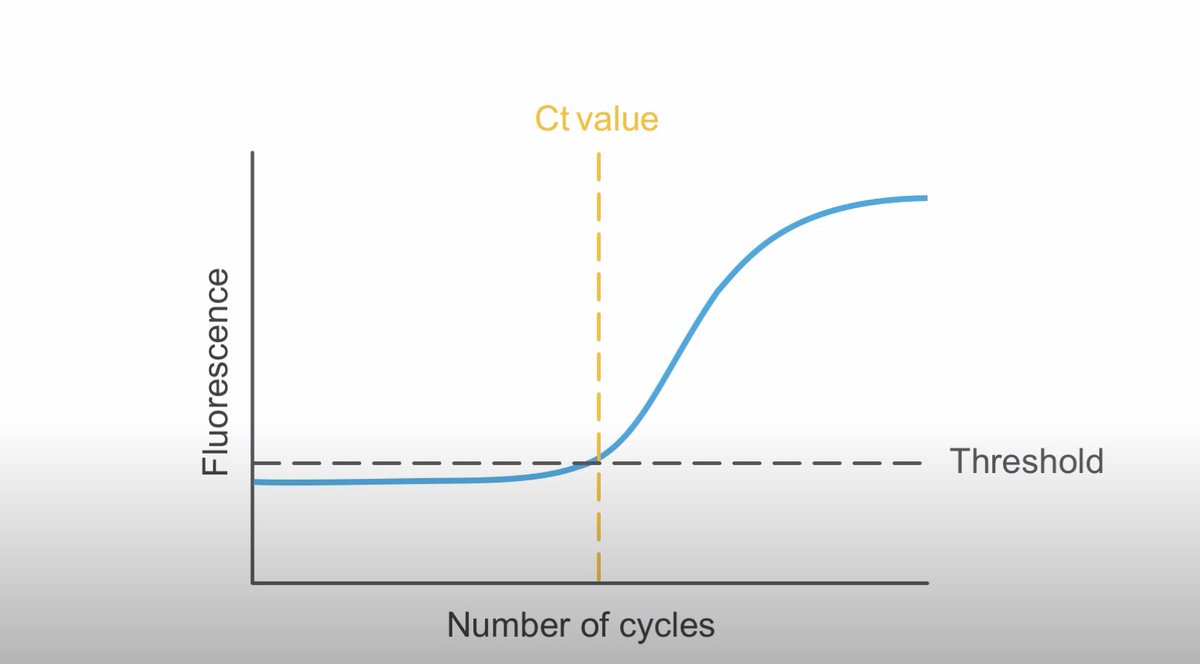
𝟖 qPCR is a variation of the PCR, which contains a fluorescent molecule that generates a fluorescent signal at each amplification cycle. The fluorescence signal increases proportionally to the amount of amplified viral DNA  https://abs.twimg.com/emoji/v2/... draggable="false" alt="➡️" title="Pfeil nach rechts" aria-label="Emoji: Pfeil nach rechts"> help us ESTIMATE amount of virus present in the swab.
𝟗 What is Cycle Threshold (Ct) value?
It’s the number of cycles of qPCR amplification required for the fluorescence signal to be detected crossing a threshold, which is above the background signal (a low level signal that is present in the assay regardless of presence of virus)
It’s the number of cycles of qPCR amplification required for the fluorescence signal to be detected crossing a threshold, which is above the background signal (a low level signal that is present in the assay regardless of presence of virus)
𝟏𝟎 How is Ct determined?
First, validation experiments are performed using serial dilutions of a sample of known quantity; this helps establish the limit of detection (LOD): an upper and lower range for detection
First, validation experiments are performed using serial dilutions of a sample of known quantity; this helps establish the limit of detection (LOD): an upper and lower range for detection
𝟏𝟏 POSITIVITY cut-off: a Ct value similar to that generated by the lowest copies of target that can be reliably detected (e.g. Ct ≤ 38)
NEGATIVITY cut-off: a Ct value at which target is no longer expected to be detected based on LOD (e.g. Ct ≥40)
NEGATIVITY cut-off: a Ct value at which target is no longer expected to be detected based on LOD (e.g. Ct ≥40)
𝟏𝟐 Ct is inversely proportional to the log of viral load, BUT their precise relationship depends mostly on sampling variation  https://abs.twimg.com/emoji/v2/... draggable="false" alt="➡️" title="Pfeil nach rechts" aria-label="Emoji: Pfeil nach rechts"> Ct is a snapshot of ONE point in the course of infection & depends on when the sample was collected relative to when infection happened
 https://abs.twimg.com/emoji/v2/... draggable="false" alt="❗️" title="Rotes Ausrufezeichen" aria-label="Emoji: Rotes Ausrufezeichen">
𝟏𝟑 Furthermore, there are studies that show that distribution of Ct values has changed over the course of the pandemic
https://www.medrxiv.org/content/10.1101/2020.10.08.20204222v1
https://www.medrxiv.org/content/1... href=" https://www.medrxiv.org/content/10.1101/2020.07.20.20157792v1.full.pdf
What">https://www.medrxiv.org/content/1... does this mean?
https://www.medrxiv.org/content/10.1101/2020.10.08.20204222v1
What">https://www.medrxiv.org/content/1... does this mean?
𝟏𝟒 This means that epidemic dynamics  https://abs.twimg.com/emoji/v2/... draggable="false" alt="➡️" title="Pfeil nach rechts" aria-label="Emoji: Pfeil nach rechts"> time since infection distribution
  https://abs.twimg.com/emoji/v2/... draggable="false" alt="➡️" title="Pfeil nach rechts" aria-label="Emoji: Pfeil nach rechts"> viral load distribution
  https://abs.twimg.com/emoji/v2/... draggable="false" alt="➡️" title="Pfeil nach rechts" aria-label="Emoji: Pfeil nach rechts"> observed Ct values. How these steps link might change depending on for example the instrument used to measure Ct values, but the general principle holds.
𝟏𝟓 In conclusion: Ct values in Quebec will NOT necessarily be the same ones as Germany, France, or even Ontario b/c our pandemic trajectory is different
Please verify the information you read with experts in the field; it is our pleasure & duty to communicate science to you!
Please verify the information you read with experts in the field; it is our pleasure & duty to communicate science to you!
@threadreaderapp unroll please

 Read on Twitter


