1/
Get a cup of coffee.
In this thread, I& #39;ll help you understand the pitfalls of relying too much on averages.
Get a cup of coffee.
In this thread, I& #39;ll help you understand the pitfalls of relying too much on averages.
2/
We humans are simple creatures.
We like to boil down complex situations into a single number.
For example, the economy is complex. So we reduce it to one number -- GDP.
Valuing a company is complex. So we reduce it to one number -- a P/E ratio.
And so on.
We humans are simple creatures.
We like to boil down complex situations into a single number.
For example, the economy is complex. So we reduce it to one number -- GDP.
Valuing a company is complex. So we reduce it to one number -- a P/E ratio.
And so on.
3/
Averages are the same way.
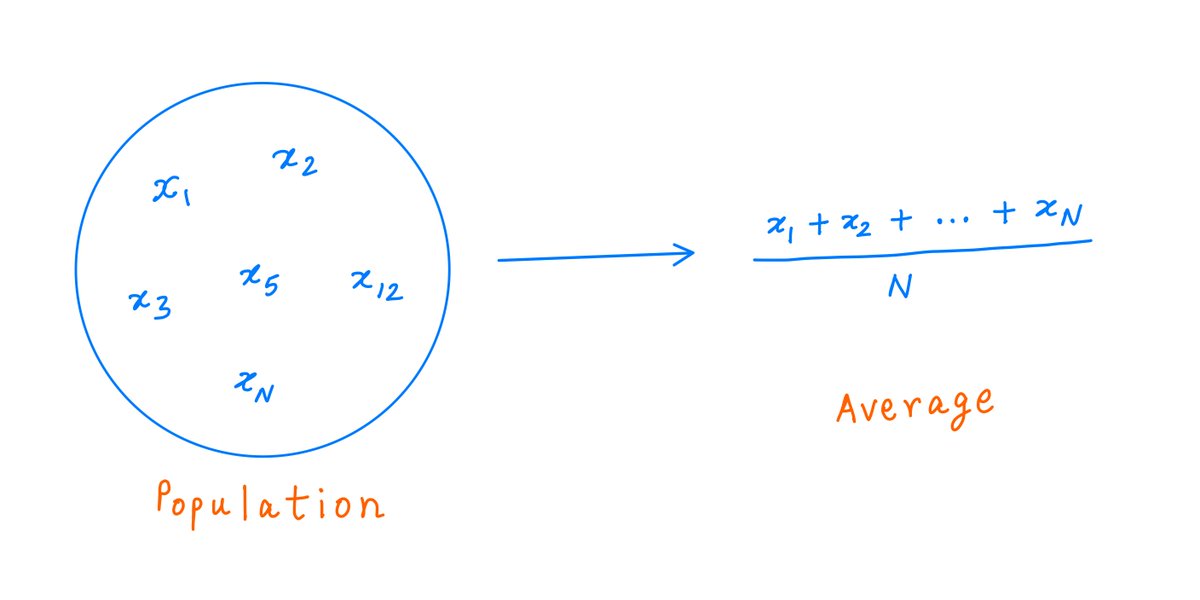
Studying a population is complex. So we tend to look for one number that can represent the whole population.
This number -- more often than not -- ends up being the population& #39;s "average".
Averages are the same way.
Studying a population is complex. So we tend to look for one number that can represent the whole population.
This number -- more often than not -- ends up being the population& #39;s "average".
4/
In general, averages are pretty useful. In many cases, they represent the underlying population reasonably well.
But in one *important* case, they fail. This is when the population has significant outliers.
Outliers can skew averages so much that they become meaningless.
In general, averages are pretty useful. In many cases, they represent the underlying population reasonably well.
But in one *important* case, they fail. This is when the population has significant outliers.
Outliers can skew averages so much that they become meaningless.
5/
In a nutshell, the problem is this:
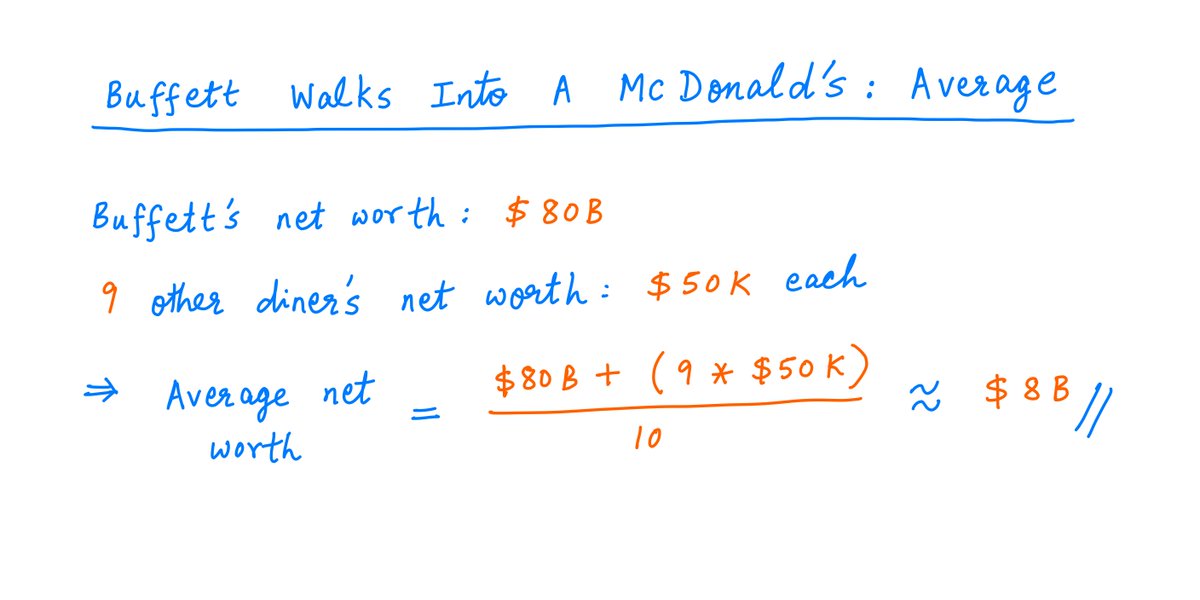
When Warren Buffett walks into a McDonald& #39;s, the *average* diner there becomes a billionaire.
It& #39;s simple math: Buffett is worth ~$80B. If he joins 9 diners who are each worth ~$50K, the *average* net worth of the group is now ~$8B.
Pic:
In a nutshell, the problem is this:
When Warren Buffett walks into a McDonald& #39;s, the *average* diner there becomes a billionaire.
It& #39;s simple math: Buffett is worth ~$80B. If he joins 9 diners who are each worth ~$50K, the *average* net worth of the group is now ~$8B.
Pic:
6/
But of course, this is absurd.
9 out of those 10 diners will probably never see anything like $8B in their lifetimes.
What happened is that a single outlier -- Buffett -- skewed the group& #39;s average so much that the average itself became meaningless.
But of course, this is absurd.
9 out of those 10 diners will probably never see anything like $8B in their lifetimes.
What happened is that a single outlier -- Buffett -- skewed the group& #39;s average so much that the average itself became meaningless.
7/
In life, there are outliers everywhere.
A small part of the population often significantly skews the average of the whole.
The richest people skew the average net worth.
The biggest companies skew the average market cap.
Ultra luxury homes skew the average home price.
In life, there are outliers everywhere.
A small part of the population often significantly skews the average of the whole.
The richest people skew the average net worth.
The biggest companies skew the average market cap.
Ultra luxury homes skew the average home price.
8/
One way to avoid this kind of skewing is to use the *median* instead of the average.
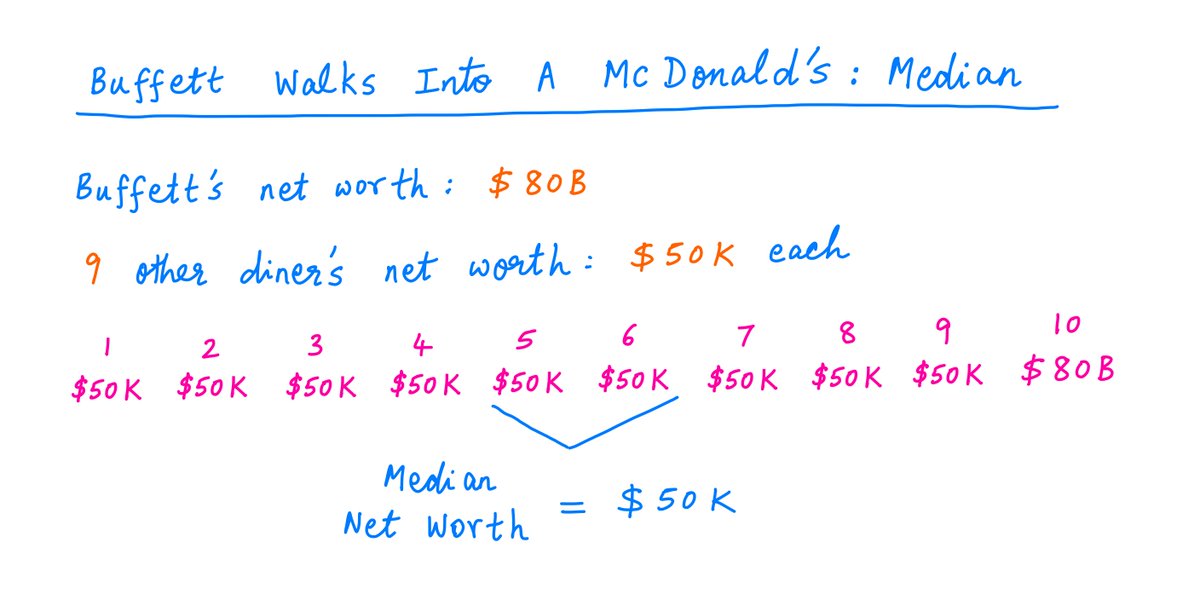
Unlike the average, the median doesn& #39;t sum up the population. Instead, it *sorts* the population and *picks the middle* of the pack.
One way to avoid this kind of skewing is to use the *median* instead of the average.
Unlike the average, the median doesn& #39;t sum up the population. Instead, it *sorts* the population and *picks the middle* of the pack.
9/
This way, the outliers -- who, by definition, are at the extreme ends of the pack, not in the middle -- don& #39;t have much of an impact.
So, even if Buffett walks into a McDonald& #39;s, he won& #39;t be able to single-handedly skew the median net worth of the diners:
This way, the outliers -- who, by definition, are at the extreme ends of the pack, not in the middle -- don& #39;t have much of an impact.
So, even if Buffett walks into a McDonald& #39;s, he won& #39;t be able to single-handedly skew the median net worth of the diners:
10/
When analyzing businesses as potential investments, it& #39;s always a good idea to keep an eye out for outliers skewing averages.
Do a few large customers skew ARPU (Average Revenue Per User)?
Do a few highly profitable stores skew the average profit margin of the whole chain?
When analyzing businesses as potential investments, it& #39;s always a good idea to keep an eye out for outliers skewing averages.
Do a few large customers skew ARPU (Average Revenue Per User)?
Do a few highly profitable stores skew the average profit margin of the whole chain?
11/
Do a few luckily timed derivatives contracts mask losses from a large number of other trades?
Do a few big insurance premiums mask widespread underwriting losses?
Do a few large loans mask widespread delinquency rates?
Do a few luckily timed derivatives contracts mask losses from a large number of other trades?
Do a few big insurance premiums mask widespread underwriting losses?
Do a few large loans mask widespread delinquency rates?
12/
Whenever we think *average* numbers reported by a company are subject to outlier skewing, we should try and work out the *median* numbers.
If there are significant differences between the two, it& #39;s an indication that we should spend some effort understanding the outliers.
Whenever we think *average* numbers reported by a company are subject to outlier skewing, we should try and work out the *median* numbers.
If there are significant differences between the two, it& #39;s an indication that we should spend some effort understanding the outliers.
13/
Another observation: averages may be perfectly good for some applications, but not for others.
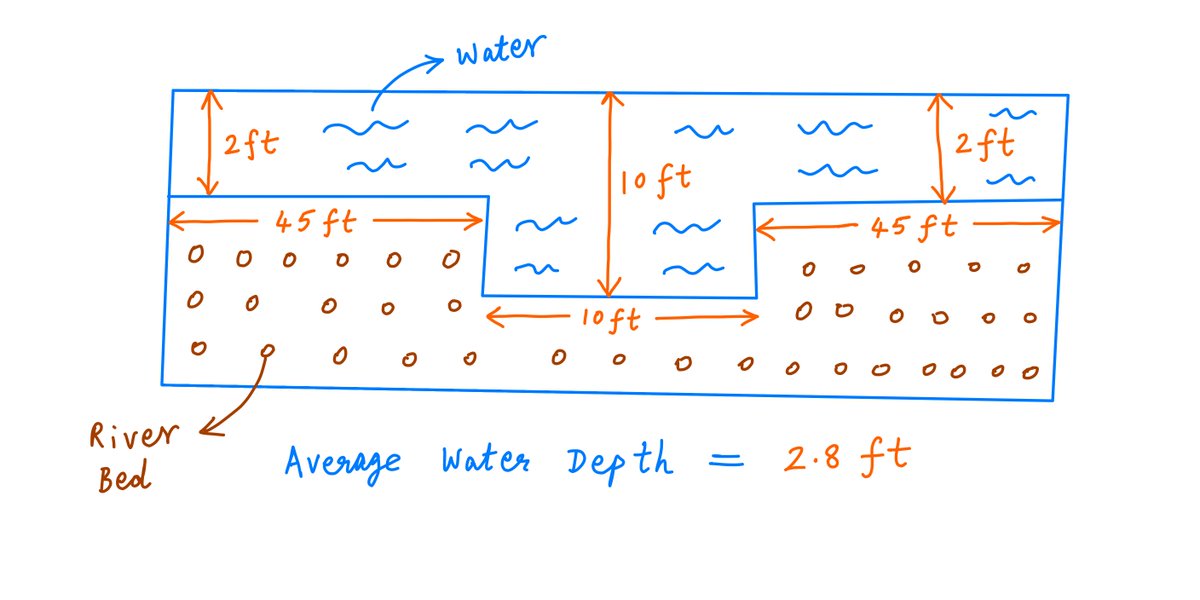
For example, here& #39;s a river that& #39;s 100 ft across. The water is 2 ft deep 90% of the way, but there& #39;s a 10 ft deep stretch in the middle.
The *average* water depth is 2.8 ft.
Another observation: averages may be perfectly good for some applications, but not for others.
For example, here& #39;s a river that& #39;s 100 ft across. The water is 2 ft deep 90% of the way, but there& #39;s a 10 ft deep stretch in the middle.
The *average* water depth is 2.8 ft.
14/
Suppose we want to estimate the amount of water in this river.
For this task, using the *average* water depth works well. In fact, the average is exactly the right metric to use in this case.
Suppose we want to estimate the amount of water in this river.
For this task, using the *average* water depth works well. In fact, the average is exactly the right metric to use in this case.
15/
But suppose we didn& #39;t know swimming, and we want to figure out whether it& #39;s safe to walk across the river.
If we use the *average* depth for this, we will drown.
Here, we should of course decide based on the *worst case* depth (10 ft), not the *average* depth (2.8 ft).
But suppose we didn& #39;t know swimming, and we want to figure out whether it& #39;s safe to walk across the river.
If we use the *average* depth for this, we will drown.
Here, we should of course decide based on the *worst case* depth (10 ft), not the *average* depth (2.8 ft).
16/
When making investment decisions, understanding the *worst case downside* is often far more important than understanding the *average case upside*.
Yet, most financial projections seem to be built around average case (and sometimes, better than average case) assumptions.
When making investment decisions, understanding the *worst case downside* is often far more important than understanding the *average case upside*.
Yet, most financial projections seem to be built around average case (and sometimes, better than average case) assumptions.
17/
For example, suppose we have 2 businesses: A and B.
A is in a rapidly changing industry, and its competitive advantages may or may not prove durable.
In other words, A& #39;s stock is a "big upside, big downside" type investment.
For example, suppose we have 2 businesses: A and B.
A is in a rapidly changing industry, and its competitive advantages may or may not prove durable.
In other words, A& #39;s stock is a "big upside, big downside" type investment.
18/
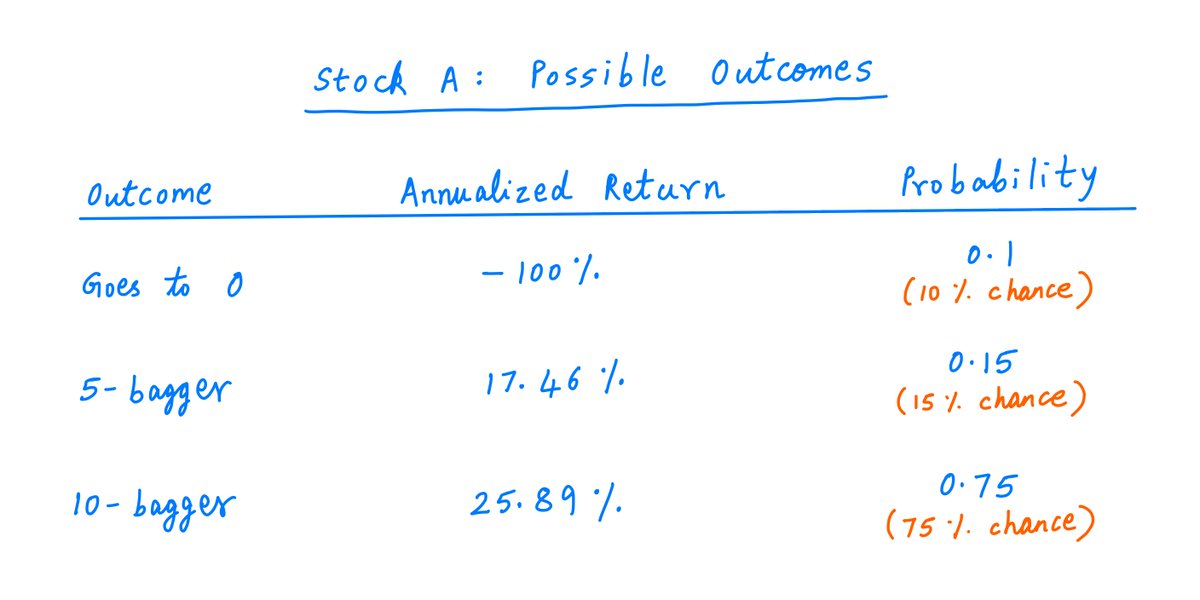
Let& #39;s say there& #39;s a 10% chance that A& #39;s stock will go to 0 in the next 10 years, but a 90% chance that it will do very well (become a 5-bagger or 10-bagger).
Here are the possible outcomes and their respective probabilities:
Let& #39;s say there& #39;s a 10% chance that A& #39;s stock will go to 0 in the next 10 years, but a 90% chance that it will do very well (become a 5-bagger or 10-bagger).
Here are the possible outcomes and their respective probabilities:
20/
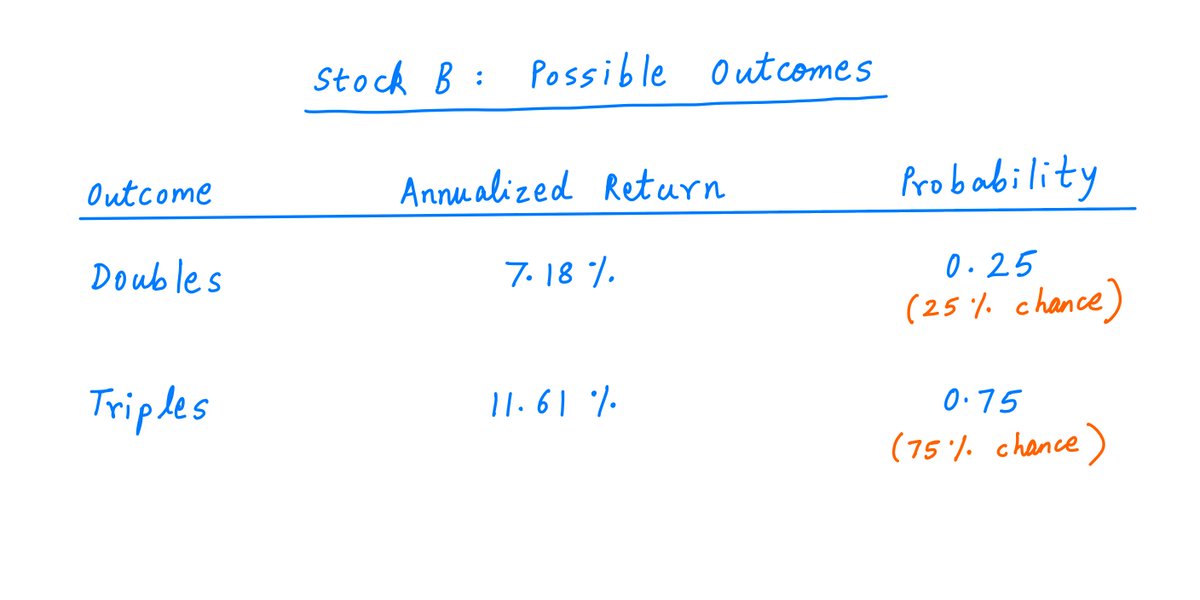
Business B, on the other hand, is in a stable industry -- where it enjoys a dominant position and predictable cash flows.
This is a "moderate upside, no downside" type investment.
Here& #39;s the distribution of outcomes for B& #39;s stock:
Business B, on the other hand, is in a stable industry -- where it enjoys a dominant position and predictable cash flows.
This is a "moderate upside, no downside" type investment.
Here& #39;s the distribution of outcomes for B& #39;s stock:
22/
Suppose we could pick only one stock -- A or B -- to put our entire net worth into. Which one should we pick?
If we went solely on the basis of *averages*, the answer is obvious.
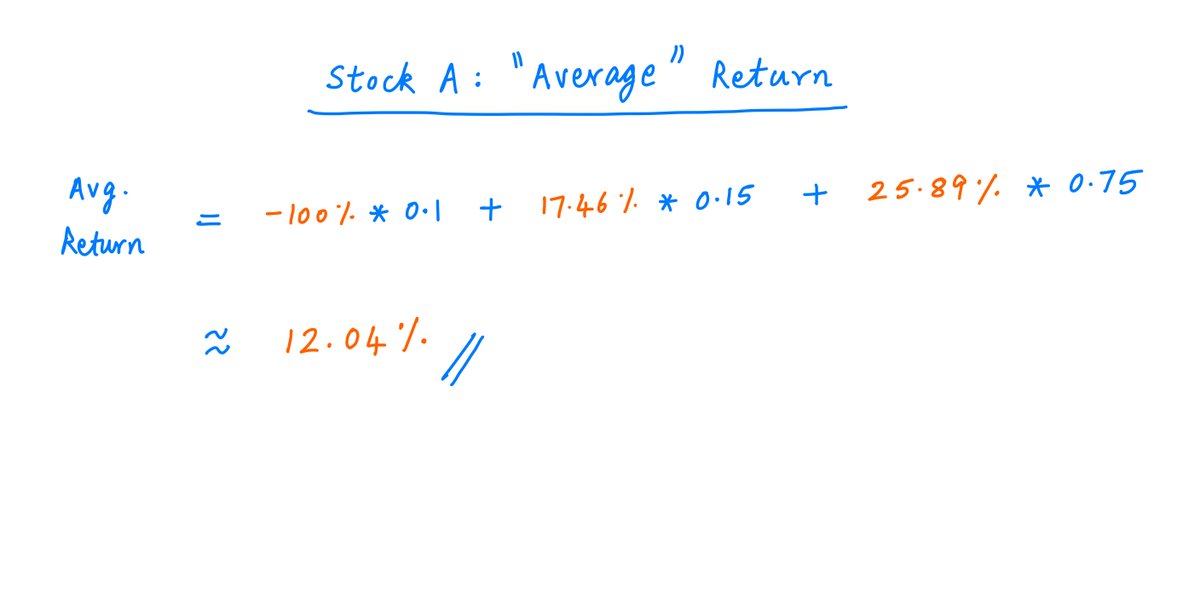
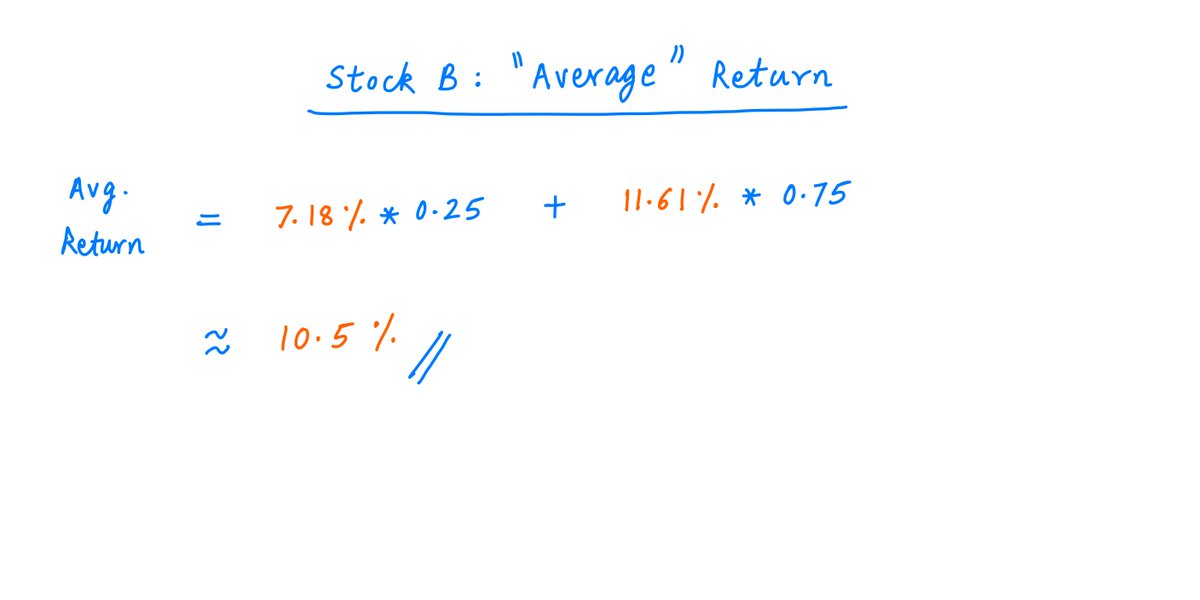
A (with its 12.04% expected return) clearly wins over B (with its 10.5%).
Suppose we could pick only one stock -- A or B -- to put our entire net worth into. Which one should we pick?
If we went solely on the basis of *averages*, the answer is obvious.
A (with its 12.04% expected return) clearly wins over B (with its 10.5%).
23/
If we went by this logic and picked A, we& #39;d be following what& #39;s known as the "expectation maximization" strategy.
This simply means: from the available options, we pick the one that promises to deliver the greatest expected return on our investment.
If we went by this logic and picked A, we& #39;d be following what& #39;s known as the "expectation maximization" strategy.
This simply means: from the available options, we pick the one that promises to deliver the greatest expected return on our investment.
24/
A lot of economic theory is based on expectation maximization.
When faced with two or more probabilistic choices, rational agents -- the theory goes -- would seek to maximize their expected return.
But if you gave *me* this exact choice, I& #39;d pick B over A in a heartbeat.
A lot of economic theory is based on expectation maximization.
When faced with two or more probabilistic choices, rational agents -- the theory goes -- would seek to maximize their expected return.
But if you gave *me* this exact choice, I& #39;d pick B over A in a heartbeat.
25/
Why?
Because I don& #39;t believe in expectation maximization. I believe in *survival* -- first and foremost.
There& #39;s a 10% chance that stock A will go to 0. If we pick A, and this happens, our net worth is gone. Poof.
In my mind, this risk is simply not worth taking.
Why?
Because I don& #39;t believe in expectation maximization. I believe in *survival* -- first and foremost.
There& #39;s a 10% chance that stock A will go to 0. If we pick A, and this happens, our net worth is gone. Poof.
In my mind, this risk is simply not worth taking.
26/
As Charlie Munger is fond of saying: "All I want to know is where I& #39;ll die, so I& #39;ll never go there."
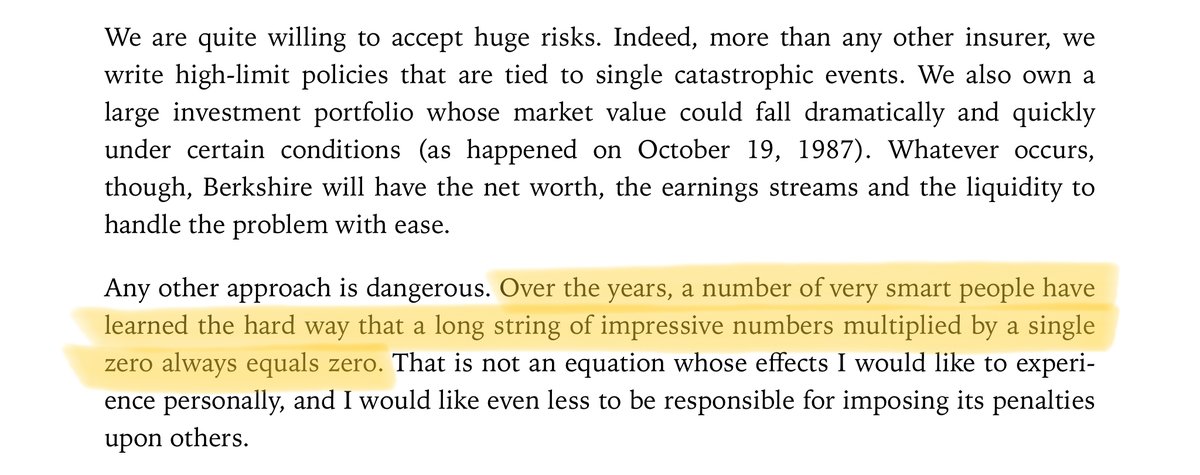
Going all in on stock A type situations is how investors die -- by taking excessive risk with a big portion of their capital.
As Buffett put it in his 2008 letter:
As Charlie Munger is fond of saying: "All I want to know is where I& #39;ll die, so I& #39;ll never go there."
Going all in on stock A type situations is how investors die -- by taking excessive risk with a big portion of their capital.
As Buffett put it in his 2008 letter:
27/
One way to decide between A and B is to imagine repeating our choice many times in succession.
For example, what would happen if we bet our entire net worth on a "type A" bet again and again?
One way to decide between A and B is to imagine repeating our choice many times in succession.
For example, what would happen if we bet our entire net worth on a "type A" bet again and again?
28/
Now, the answer is clear.
We may get lucky a few times -- with a 5-bagger or 10-bagger. But sooner or later, we& #39;d go to 0.
And once we go to 0, we stay there forever.
From Buffett& #39;s 2005 letter:
Now, the answer is clear.
We may get lucky a few times -- with a 5-bagger or 10-bagger. But sooner or later, we& #39;d go to 0.
And once we go to 0, we stay there forever.
From Buffett& #39;s 2005 letter:
29/
This is the essence of the famous Kelly Criterion for position sizing.
Instead of treating bets as "one-off" events, we should imagine that we& #39;re going to bet repeatedly -- taking our winnings from each iteration and betting it all on the next iteration.
This is the essence of the famous Kelly Criterion for position sizing.
Instead of treating bets as "one-off" events, we should imagine that we& #39;re going to bet repeatedly -- taking our winnings from each iteration and betting it all on the next iteration.
30/
Then the goal is simple: we try to maximize the long-term expected growth rate of our capital in this "repeated betting" scenario.
So, if there& #39;s even a tiny chance of a 100% loss, we shouldn& #39;t bet our entire net worth -- no matter how big the expected return is.
Then the goal is simple: we try to maximize the long-term expected growth rate of our capital in this "repeated betting" scenario.
So, if there& #39;s even a tiny chance of a 100% loss, we shouldn& #39;t bet our entire net worth -- no matter how big the expected return is.
31/
So, if the choice is to bet our entire net worth on either A or B, Kelly would pick B over A every time.
But if we were allowed to split our net worth between A and B, then Kelly would put ~85% of it into A and the remaining ~15% into B.
For more: https://twitter.com/10kdiver/status/1264622958468726785">https://twitter.com/10kdiver/...
32/
Another approach to get around the limitations of averages is to use "weighted averages".
Here, we assign a "utility" to each return outcome. Then we maximize "expected utility", rather than "expected return".
Another approach to get around the limitations of averages is to use "weighted averages".
Here, we assign a "utility" to each return outcome. Then we maximize "expected utility", rather than "expected return".
33/
A 100% loss has highly negative utility because of "loss aversion" -- our pain from a $1 loss is more than our happiness from a $1 gain.
And a 10-bagger has more utility than a 5-bagger, but not twice as much -- as utility diminishes with each incremental dollar.
A 100% loss has highly negative utility because of "loss aversion" -- our pain from a $1 loss is more than our happiness from a $1 gain.
And a 10-bagger has more utility than a 5-bagger, but not twice as much -- as utility diminishes with each incremental dollar.
34/
This way, "expectation maximization" becomes "expected utility maximization".
This is a whole new branch of economics -- and possibly a future thread topic.
This way, "expectation maximization" becomes "expected utility maximization".
This is a whole new branch of economics -- and possibly a future thread topic.
35/
One final factoid on averages.
We often see headlines like: 90% of investors think they& #39;re better than average.
Or: 80% of people think they& #39;re better than average drivers.
As if these are mathematical impossibilities.
One final factoid on averages.
We often see headlines like: 90% of investors think they& #39;re better than average.
Or: 80% of people think they& #39;re better than average drivers.
As if these are mathematical impossibilities.
36/
But you know what?
It& #39;s definitely possible for 90% of investors to be better than average.
The remaining 10% just have to be really bad outliers.
Just as it& #39;s possible for 90% of McDonald& #39;s diners to be poorer than average. All it takes is 1 Buffett in the mix.
But you know what?
It& #39;s definitely possible for 90% of investors to be better than average.
The remaining 10% just have to be really bad outliers.
Just as it& #39;s possible for 90% of McDonald& #39;s diners to be poorer than average. All it takes is 1 Buffett in the mix.
37/
To summarize:
When dealing with complex/uncertain situations, we tend to take decisions based solely on "average outcomes" and "average case scenarios".
But this can be a bad idea.
To summarize:
When dealing with complex/uncertain situations, we tend to take decisions based solely on "average outcomes" and "average case scenarios".
But this can be a bad idea.
38/
Averages suffer from all kinds of problems.
Potential workarounds include: medians, worst case scenarios, Kelly-inspired strategies, and utility theory/weighted averages.
Averages suffer from all kinds of problems.
Potential workarounds include: medians, worst case scenarios, Kelly-inspired strategies, and utility theory/weighted averages.

 Read on Twitter
